
Research article · 2025 · Full text
International Journal of Biology SciencesCharacter association and path analysis of yield and yield-contributing traits in Indian mustard (Brassica juncea L. czern and coss.)
Volume 7(8) · Pages 146–153 · DOI: 10.33545/26649926.2025.v7.i8b.459 ↗
Research areasNitrogen and Sulfur Effects on BrassicaAgricultural Science and FertilizationPlant Micronutrient Interactions and Effects
Abstract
Author-writtenThe experimental material consisted of 50 genotypes of Indian mustard, grown in a Randomised Block Design to estimate heritability, genetic advance, correlation, and path analysis. Observations on twelve important yield traits were recorded on five competitive plants randomly selected from each plot, while flowering traits were recorded on a row basis. The analysis of variance revealed significant differences among genotypes for all studied characters, indicating ample genetic variability. High heritability estimates in the broad sense, along with high genetic advance as a percentage of the mean, were observed for the number of siliquae per plant and biological yield. Association studies revealed that days to 50% flowering showed a significant positive correlation with seed yield. Harvest index exhibited the highest positive direct effect on seed yield, followed by biological yield per plant, days to 50% flowering, number of primary branches, siliqua length, number of siliquae per plant, and plant height.
Summary
Source-checkedPlain-language reading of the full paper, prepared with AI and checked against the text. Each point links to the authors' own words.
Why it matters
- Indian mustard (Brassica juncea L.) is a natural amphidiploid species created through the hybridization of Brassica rapa and Brassica nigra. View evidence ↗
- Parameters such as heritability, genetic advance, and coefficients of variation are critical for making effective selections in plant breeding. View evidence ↗
- Analyzing genetic diversity allows breeders to identify and select the most suitable parent genotypes for specific breeding goals. View evidence ↗
What they did
- The researchers evaluated 50 Indian mustard genotypes using a Randomized Block Design with three replications. View evidence ↗
- Observations for the traits were recorded from five randomly selected competitive plants per plot in each replication. View evidence ↗
What they found
- Analysis of variance for the 2022-2023 rabi season showed significant differences among all 50 genotypes for all 12 studied traits, indicating high genetic variability. View evidence ↗
- The highest genetic advance as a percentage of the mean was recorded for the number of siliquae per plant (65.7%), harvest index (43.3%), and seed yield (39.991%). View evidence ↗
- The number of siliquae per plant showed the highest phenotypic (32.453) and genotypic (32.163) coefficients of variation, followed by harvest index and seed yield. View evidence ↗
- Phenotypic correlation analysis revealed that harvest index had a strong positive correlation with seed yield (0.885). View evidence ↗
- At the phenotypic level, harvest index had the highest positive direct effect on seed yield (1.00078), followed by biological yield per plant (0.46339). View evidence ↗
- At the genotypic level, the strongest positive direct effects on seed yield were exerted by harvest index (0.82523), number of seeds per siliqua (0.59951), and biological yield (0.56491). View evidence ↗
What it means
- The combination of high heritability and high genetic advance for traits like seed yield and harvest index suggests that additive gene action is dominant, making simple selection effective. View evidence ↗
Visual summary
2 visualsIllustrations explain the paper; charts are replotted from the paper's own table values.
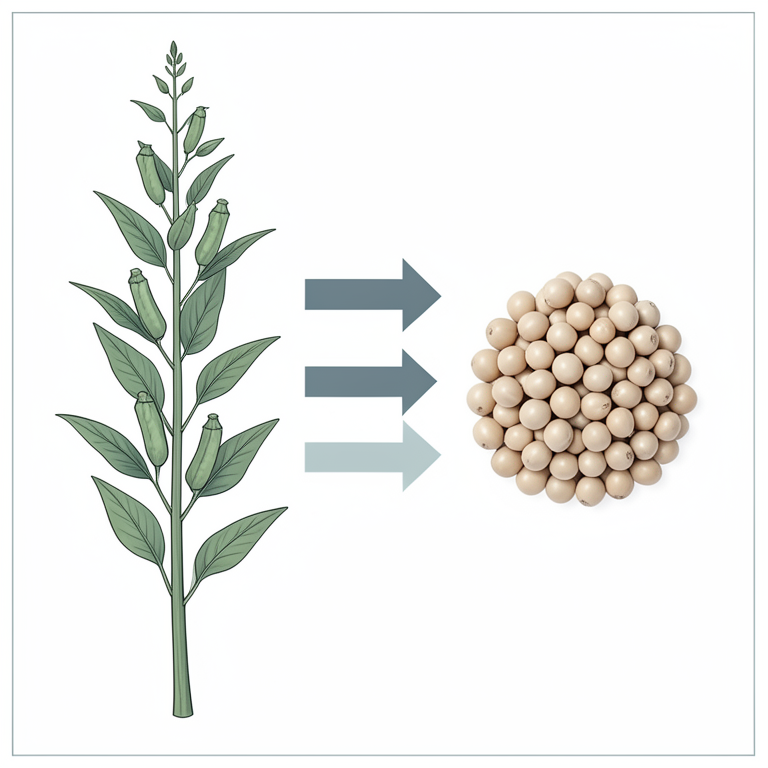
Direct Effects on Seed Yield
AI-generated conceptual illustration (Indian mustard (Brassica juncea) plants). It explains the idea and does not show study data.
View source evidence ↗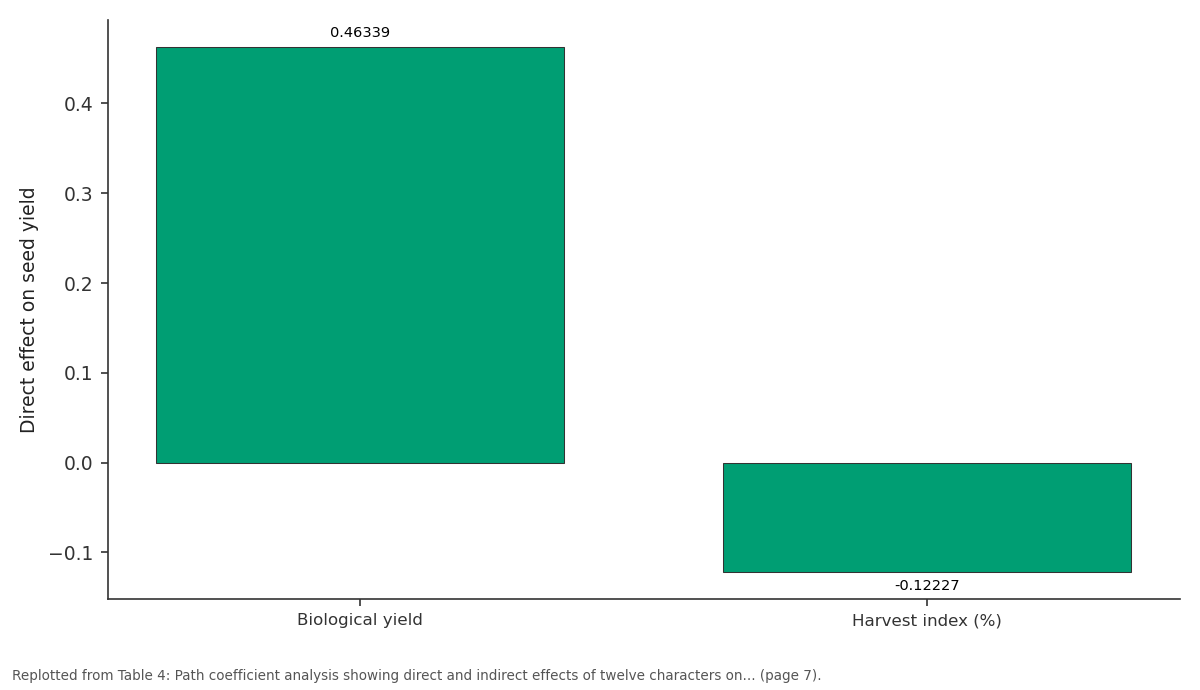
Biological yield: Biological yield vs Harvest index (%)
Replotted from Table 4 (page 7) of the original paper. Every bar is the paper's own table value.
View source evidence ↗Figures & tables
From the original paper Table 1
 Table 2
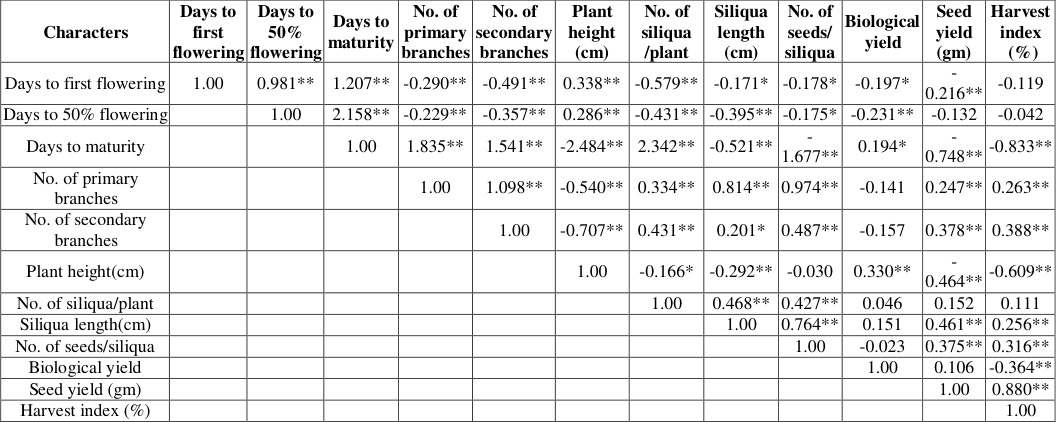 Table 2
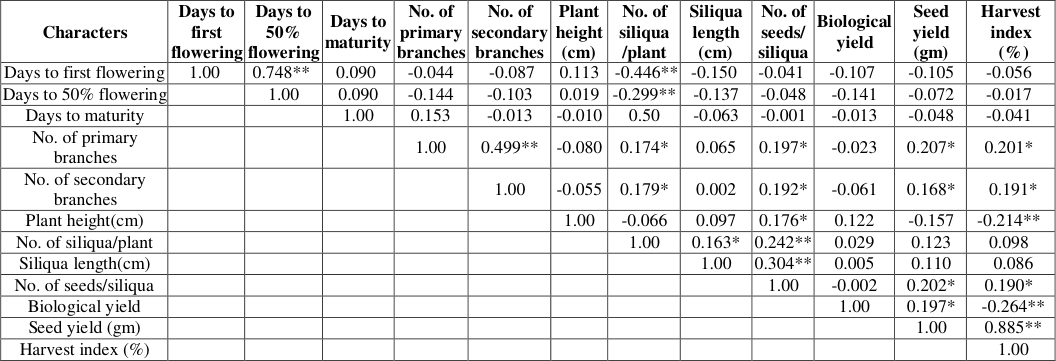 Table 3
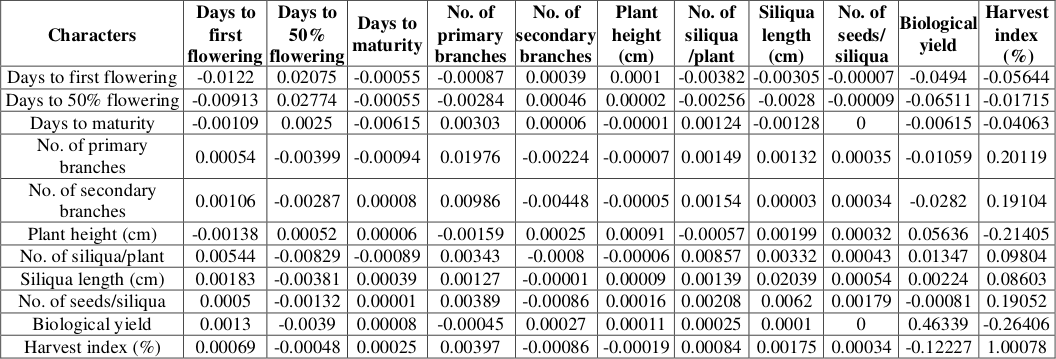 Table 4
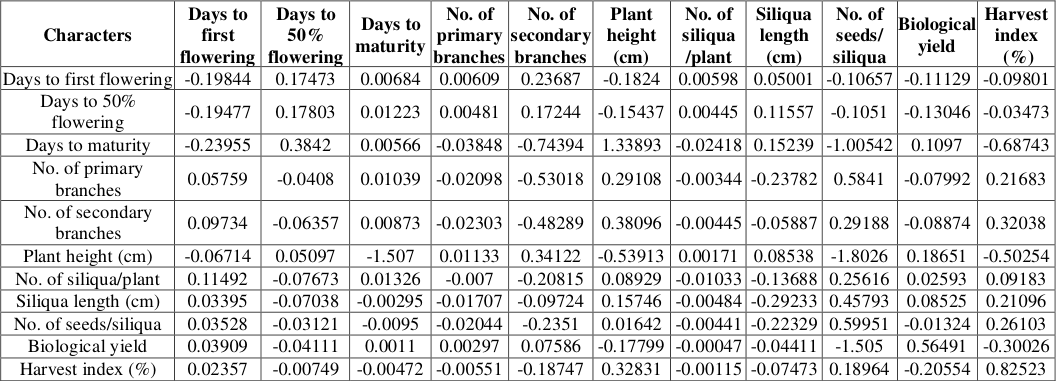 Table 5
Introduction
Mustard (Brassica juncea L.) is a member of the Cruciferae family under the genus Brassica, which comprises 37 species. Among them, Brassica campestris, commonly known as rapeseed, is the most widely cultivated. Indian mustard, or brown mustard, is a natural amphidiploid (2n = 36) formed by hybridization between Brassica rapa (2n = 20) and Brassica nigra (2n = 16). Although it is predominantly a self-pollinated crop, up to 30% natural cross-pollination can occur under field conditions, depending on wind and pollinator activity. It originated in Asia, with its primary centre of diversity in China (Vaughan, 1977) [28] . Mustard was introduced to India from China and subsequently spread to Afghanistan and other regions. Although it is largely self-pollinated, cross-pollination rates may vary from 0 to 16.5%. In India, mustard is cultivated as a rabi crop (Singh et al., 2013). Mustard can thrive in both tropical and temperate climates. It requires temperatures ranging between 10°C and 25°C and grows best in areas receiving 625-1000 mm of annual rainfall (Reddy, 2015) [15] . The crop adapts to various soil types, from sandy loam to clay loam, but performs best in well-drained light loam soils. Waterlogged or heavy soils are unsuitable. The ideal soil pH ranges from 6.0 to 7.0 (Madhusoodanan et al., 2016) [11] . Heritability (in the broad sense), phenotypic and genotypic coefficients of variation, and genetic advance as a percentage of the mean are essential parameters for making effective selections (Lodhi, 2014). Evaluating available germplasm enables identification of genetic sources for desirable traits (Tomooka, 1992) [27] . Understanding genetic diversity helps breeders select appropriate parents for targeted breeding programs. Evaluating genetic diversity in a germplasm collection simplifies classification and facilitates the identification of useful genotypes for specific breeding goals (Choudhary et al., 2016) [3] . Hence, the current study was designed to evaluate and categorize fifty genotypes of Indian mustard using principal component and factor analysis. Genetic parameters such as heritability and genetic advance are crucial in selecting genotypes with greater potential by eliminating environmental effects from total variability (Salam et al., 2017) [16] .
In each replication, five competitive plants were randomly selected for recording observations on all traits. For statistical analysis, the mean values from each replication were used for each character.
Results and Discussion
Results and Discussion
Analysis of Variance
The analysis of variance conducted for 50 treatments across 12 yield and yield-contributing traits during the rabi season of 2022-2023 revealed significant differences for all characters studied. These included: days to first flowering, days to 50% flowering, number of primary branches, number of secondary branches, plant height, number of siliquae per plant, siliqua length, number of seeds per siliqua, days to maturity, biological yield, seed yield per plant, and harvest index. The significant mean sum of squares for all these traits confirmed the presence of substantial genetic variability among genotypes. Similar findings were also reported by Pant and Singh (2001) and Shekhawat et al. (2014) [13,35] .
Heritability and Genetic Advance: High heritability estimates were observed for the number of siliquae per plant (98.2%), followed by biological yield (78.1%), harvest index (73.1%), seed yield per plant (67.942%), days to first flowering (60.839%), and days to 50% flowering (50.255%). Moderate to low heritability was recorded for the number of seeds per siliqua (35.0%), number of primary branches (40.0%), plant height (35.0%), and the number of secondary branches (18.648%), siliqua length (25.0%), and days to maturity (4.1%). High heritability indicates that most of the observed phenotypic variation is governed by genetic factors rather than environmental influences. Thus, simple selection would be effective for improving these traits. In contrast, the low heritability observed in days to maturity suggests that environmental factors play a greater role than genetic ones in the expression of this trait. The highest estimates of genetic advance were recorded for number of siliquae per plant (145.80), followed by biological yield per plant (26.64), harvest index (6.74), seed yield per plant (8.012), days to first flowering (5.603), days to 50% flowering (5.246), number of seeds per siliqua (2.10), number of primary branches (1.20), plant height (8.50), number of secondary branches (1.231), siliqua length (0.50), and days to maturity (1.80). In terms of genetic advance as percent of mean, the highest value was again observed for number of siliquae per plant (65.7%), followed by harvest index (43.3%), seed yield (39.991%), biological yield per plant (20.5%), number of seeds per siliqua (12.0%), number of primary branches (10.0%), number of secondary branches (8.019%), days to first flowering (7.395%), days to 50% flowering (6.204%), siliqua length (5.0%), plant height (6.5%), and days to maturity (1.5%). These results indicate that traits with low GA as percent of mean, such as days to maturity, offer limited scope for improvement through direct selection. Traits such as number of siliquae per plant, biological yield, harvest index, and seed yield per plant showed both high heritability and high genetic advance, suggesting the influence of additive gene action. For traits such as harvest index, total number of branches per plant, and days to 50% flowering, high heritability was coupled with moderate genetic advance, indicating that both additive and nonadditive gene effects might be involved. These findings are in accordance with those reported by Mehla et al. (2003), Brar et al. (2007), and Singh et al. (2011) [2,12] . At the 1% level of significance, genetic advance as percent of mean was highest for number of siliquae per plant, followed by harvest index and seed yield. These results align with earlier findings reported by Singh et [20,22,25] , who also observed high heritability and high genetic advance for these traits. The presence of high heritability in combination with high genetic advance implies that additive gene effects play a major role in the inheritance of these characters, making them ideal for improvement through simple selection. For traits such as number of siliquae per plant and biological yield, where high heritability was associated with moderate genetic advance at the 1% significance level, it suggests that these characters are governed by both additive and nonadditive gene action with minimal environmental influence. Similar results were also reported by Synrem et al. (2014) [24] . Moderate heritability combined with moderate genetic advance suggests limited environmental influence, but the involvement of both additive and non-additive gene action implies that selection may lead to only modest gains in the next generations. Traits like plant height and siliqua length, which showed low heritability and genetic advance, may not respond effectively to selection. These findings are consistent with the reports of Johnson et al. (1995) and Tiwari (2019) [9,26] .
Genetic Variability (PCV and GCV)
Analysis of variance revealed significant differences for all twelve traits studied. The estimates of genetic variability parameters are presented in Table 4.2. The results clearly indicate that the phenotypic coefficient of variation (PCV) was higher than the corresponding genotypic coefficient of variation (GCV) for all traits, suggesting the influence of environmental factors on trait expression. Among the yield and yield-contributing traits, the highest PCV and GCV were recorded for number of siliquae per plant (32.453 and 32.163, respectively), followed by harvest index (28.785 and 24.602), seed yield (28.573 and 23.552), number of secondary branches (20.874 and 9.014), number of primary branches (19.199 and 9.470), number of seeds per siliqua (17.767 and 9.793), siliqua length (13.559 and 4.643), biological yield (12.746 and 11.263), plant height (7.589 and 3.333), days to 50% flowering (5.993 and 4.248), days to first flowering (5.901 and 4.602), and days to maturity (1.659 and 0.106), respectively. These findings indicate that for all traits, PCV was consistently higher than GCV, confirming the role of environmental factors in the expression of these traits. The degree of variation across 50 genotypes of Indian mustard demonstrated considerable genetic diversity. Table 4.2 also provides phenotypic and genotypic coefficients of variation for 14 traits. For all characters, the phenotypic coefficients were slightly higher than the genotypic ones, indicating minor environmental influence. Similar trends were reported by Akabari [1,6,8,23] . The highest PCV and GCV values were found for number of siliquae per plant, followed by traits like seed yield and harvest index. This suggests that substantial variability exists for these traits, offering scope for effective selection. In contrast, traits like days to maturity showed low PCV and GCV values, confirming limited variability. Devi et al. (2017) [4] also observed low PCV and GCV for days to maturity, further supporting this result.
| Characters | Days to first flowering | Days to 50% flowering | Days to maturity | No. of primary branches | No. of secondary branches | Plant height (cm) | No. of siliqua /plant | Siliqua length (cm) | No. of seeds/ siliqua | Biological yield | Harvest index (%) |
|---|---|---|---|---|---|---|---|---|---|---|---|
| Days to first flowering | -0.0122 | 0.02075 | -0.00055 | -0.00087 | 0.00039 | 0.0001 | -0.00382 | -0.00305 | -0.00007 | -0.0494 | -0.05644 |
| Days to 50% flowering | -0.00913 | 0.02774 | -0.00055 | -0.00284 | 0.00046 | 0.00002 | -0.00256 | -0.0028 | -0.00009 | -0.06511 | -0.01715 |
| Days to maturity | -0.00109 | 0.0025 | -0.00615 | 0.00303 | 0.00006 | -0.00001 | 0.00124 | -0.00128 | 0 | -0.00615 | -0.04063 |
| No. of primary branches | 0.00054 | -0.00399 | -0.00094 | 0.01976 | -0.00224 | -0.00007 | 0.00149 | 0.00132 | 0.00035 | -0.01059 | 0.20119 |
| No. of secondary branches | 0.00106 | -0.00287 | 0.00008 | 0.00986 | -0.00448 | -0.00005 | 0.00154 | 0.00003 | 0.00034 | -0.0282 | 0.19104 |
| Plant height (cm) | -0.00138 | 0.00052 | 0.00006 | -0.00159 | 0.00025 | 0.00091 | -0.00057 | 0.00199 | 0.00032 | 0.05636 | -0.21405 |
| No. of siliqua/plant | 0.00544 | -0.00829 | -0.00089 | 0.00343 | -0.0008 | -0.00006 | 0.00857 | 0.00332 | 0.00043 | 0.01347 | 0.09804 |
| Siliqua length (cm) | 0.00183 | -0.00381 | 0.00039 | 0.00127 | -0.00001 | 0.00009 | 0.00139 | 0.02039 | 0.00054 | 0.00224 | 0.08603 |
| No. of seeds/siliqua | 0.0005 | -0.00132 | 0.00001 | 0.00389 | -0.00086 | 0.00016 | 0.00208 | 0.0062 | 0.00179 | -0.00081 | 0.19052 |
| Biological yield | 0.0013 | -0.0039 | 0.00008 | -0.00045 | 0.00027 | 0.00011 | 0.00025 | 0.0001 | 0 | 0.46339 | -0.26406 |
| Harvest index (%) | 0.00069 | -0.00048 | 0.00025 | 0.00397 | -0.00086 | -0.00019 | 0.00084 | 0.00175 | 0.00034 | -0.12227 | 1.00078 |
Table text extracted from the original PDF; superscript letters are shown inline. The original table image is below.
View original table image
Correlation Coefficient Analysis Phenotypic Correlation
Correlation coefficient analysis, first introduced by Karl Pearson in 1902, is a statistical method to assess the strength and direction of the relationship between two or more variables. Phenotypic correlation coefficients are presented in Table 4.3. In general, positive correlations are desirable in plant breeding, as they enable simultaneous improvement of multiple traits, whereas negative correlations may hinder combined improvement. Days to first flowering showed a strong positive correlation with days to 50% flowering (0.748), but a negative correlation with number of siliquae per plant (-0.446), biological yield per plant (-0.107), siliqua length (-0.150), and seed yield per plant (-0.105). ), but a slight negative correlation with biological yield (-0.002). Days to maturity exhibited positive correlations with number of primary branches (0.153) and number of siliquae per plant (0.50), and negative correlations with number of secondary branches (-0.013), plant height (-0.010), siliqua length (-0.063), number of seeds per siliqua (-0.001), biological yield (-0.013), seed yield (-0.048), and harvest index (-0.041). Biological yield per plant showed a significant positive correlation with seed yield per plant (0.197) and a significant negative correlation with harvest index (-0.264). Seed yield per plant had strong positive correlation with number of seeds per siliqua (0.202), number of primary branches (0.207), and negative correlation with plant height (-0.157) and days to first flowering (-0.105). Harvest index showed a strong positive correlation with seed yield (0.885) and number of secondary branches (0.191), while being negatively correlated with biological yield (-0.264) and plant height (-0.214
Genotypic Correlation
Correlation coefficient analysis, first introduced by Karl Pearson in 1902, is a statistical method used to measure the degree and direction of association between two or more variables. The genotypic correlation coefficients are presented in [14,34] . Phenotypic associations also revealed that seed yield, harvest index, number of seeds per siliqua, and siliqua length were significantly and positively correlated with seed yield per plant. Similar findings were recorded by Gangapur et al. (2009) and Lyngdsoh et al. (2017) [7,10] .
Path Analysis: Path analysis, introduced by Wright in 1921 [29] and first applied to plant selection by Dewey and Lu in 1959 [5] , provides insight into the cause-and-effect relationships between variables. It quantifies both direct and indirect effects of different independent traits on a dependent trait. Path coefficient analysis thus assists in selecting superior genotypes from diverse breeding populations. Phenotypic path coefficients for yield and its contributing characters are presented in Table 4.6.
Path Analysis at the Phenotypic Level Direct Effects at the Phenotypic Level
The highest positive direct effect on seed yield per plant was observed for harvest index (1.00078), followed by biological yield per plant (0.46339), days to 50% flowering (0.02774), number of primary branches (0.01976), siliqua length (0.00857), number of siliquae per plant (0.00179), and plant height (0.00091). Strongly negative direct effects were recorded for the number of secondary branches (-0.00448), days to maturity (-0.00615), and days to first flowering (-0.0122).
Indirect Effects at the
Indirect Effects at the
Path Analysis at the Genotypic Level
Path coefficient analysis at the genotypic level provides insights into the direct and indirect effects of yield-contributing traits on seed yield per plant. The phenotypic path coefficient values discussed in this section are presented in Table 4.6.
Direct Effects at the Genotypic Level
Analysis of direct effects revealed that the highest positive direct effect on seed yield per plant was exerted by harvest index (0.82523), followed by number of seeds per siliqua (0.59951), biological yield (0.56491), plant height (0.53913), days to 50% flowering (0.17803), number of secondary branches (0.02098), number of siliquae per plant (0.01033), siliqua length (0.29233), and days to maturity (0.00566).
In contrast, days to first flowering (-0.19844) and number of secondary branches (-0.48289) showed highly negative direct effects on seed yield per plant. were observed through number of seeds per siliqua (0.25616), days to first flowering (0.11492), harvest index (0.09183), plant height (0.08929), biological yield (0.02593), and days to maturity (0.01326). Negative effects were recorded through the number of primary branches (-0.007), days to 50% flowering (-0.07673), siliqua length (-0.13688), and number of secondary branches (-0.20815). Siliqua Length: Positive indirect effects were contributed by the number of seeds per siliqua (0.45793), harvest index (0.21096), plant height (0.15746), biological yield (0.08525), and days to first flowering (0.03395). Negative effects included days to maturity (-0.00295), number of siliquae per plant (-0.00484), number of primary branches (-0.01707), days to 50% flowering (-0.07038), and number of secondary branches (-0.09724). Number of Seeds per Siliqua: Positive effects came from harvest index (0.26103), days to first flowering (0.03528), and plant height (0.01642). Negative indirect effects were through days to maturity (-0.0095), number of siliquae per plant (-0.00441), biological yield (-0.01324), number of primary branches (-0.02044), number of secondary branches (-0.2351), and siliqua length (-0.22329). Biological Yield per Plant: Positive indirect effects were seen through the number of secondary branches (0.07586), days to first flowering (0.03909), number of primary branches (0.00297), and days to maturity (0.0011). Negative effects included number of siliquae per plant (-0.00047), number of seeds per siliqua (-1.505), days to 50% flowering (-0.04111), siliqua length (-0.04411), and plant height (-0.17799). Harvest Index: Showed positive indirect effects via plant height (0.32831), number of seeds per siliqua (0.18964), and days to first flowering (0.02357). Negative effects were through the number of siliquae per plant (-0.00551), days to maturity (-0.18747), and biological yield (-0.20554).
Indirect Effects at the
Path coefficient analysis is a valuable method for separating direct and indirect effects and for evaluating the relative importance of causal traits that ultimately influence seed yield per plant. A character with a high direct effect on seed yield suggests that direct selection for that trait would be effective in improving seed yield in breeding programs. Indirect effects reflect the interrelationships among component traits that contribute to seed yield. Simple correlation coefficients measure bilateral associations between two variables, without considering complex multivariate relationships (Kempthorne, 1957; Niehaus and Pickett, 1966) [30] . Path analysis, however, allows for a deeper understanding of these interactions.
A significantly high positive direct effect on seed yield was observed for harvest index and biological yield per plant. Similar findings were reported by Rout et al. (2018) [31] . This implies a true relationship between biological yield and seed yield, as well as between harvest index and seed yield. Singh et al. (2014) [32] also observed a strong positive direct effect of harvest index on seed yield. Therefore, based on these results, biological yield per plant and harvest index emerge as the most reliable selection criteria for yield improvement in mustard. Similar results were supported by Mandal and Sinha (2004) [33] . Interestingly, traits such as number of secondary branches, number of siliquae per plant, and days to maturity, which did not show strong correlation with seed yield, exhibited considerable negative direct effects. However, these negative contributions were largely neutralized by positive indirect effects, primarily through biological yield per plant. Similar trends were also reported by Shekhawat et al. (2014) [18] .
Figures and tables from the paper
| Source of variation | DF | Days to first flowering | Days to 50% flowering | No. of primary branches | No. of secondary branches | Plant height(cm) | No. of siliqua/plant |
|---|---|---|---|---|---|---|---|
| Replication | 2 | 166.264 | 187.547 | 0.318 | 25.553 | 4,186.42 | 713.666 |
| Treatment | 49 | 44.309 | 51.478 | 2.753 | 14.096 | 160.186 | 15,388.44 |
| Error | 98 | 7.827 | 12.771 | 1.401 | 8.352 | 93.287 | 92.504 |
Table text extracted from the original PDF; superscript letters are shown inline. The original table image is below.
View original table image
| Source of variation | DF | Siliqua length(cm) | No. of seeds/siliqua | Days to maturity | Biological yield | Seed yield (gm) | Harvest index (%) |
|---|---|---|---|---|---|---|---|
| Replication | 2 | 7.595 | 713.666 | 312.087 | 56.046 | 14.532 | 4.202 |
| Treatment | 49 | 0.443 | 15,388.44 | 4.612 | 702.588 | 77.3 | 49.391 |
| Error | 98 | 0.317 | 92.504 | 4.556 | 60.114 | 10.506 | 5.408 |
Table text extracted from the original PDF; superscript letters are shown inline. The original table image is below.
View original table image
| Characters | Days to first flowering | Days to 50% flowering | Days to maturity | No. of primary branches | No. of secondary branches | Plant height (cm) | No. of siliqua /plant | Siliqua length (cm) | No. of seeds/ siliqua | Biological yield | Seed yield (gm) | Harvest index (%) |
|---|---|---|---|---|---|---|---|---|---|---|---|---|
| Days to first flowering | 1.00 | 0.981** | 1.207** | -0.290** | -0.491** | 0.338** | -0.579** | -0.171* | -0.178* | -0.197* | - 0.216** | -0.119 |
| Days to 50% flowering | 1.00 | 2.158** | -0.229** | -0.357** | 0.286** | -0.431** | -0.395** | -0.175* | -0.231** | -0.132 | -0.042 | |
| Days to maturity | 1.00 | 1.835** | 1.541** | -2.484** | 2.342** | -0.521** | - 1.677** | 0.194* | - 0.748** | -0.833** | ||
| No. of primary branches | 1.00 | 1.098** | -0.540** | 0.334** | 0.814** | 0.974** | -0.141 | 0.247** | 0.263** | |||
| No. of secondary branches | 1.00 | -0.707** | 0.431** | 0.201* | 0.487** | -0.157 | 0.378** | 0.388** | ||||
| Plant height(cm) | 1.00 | -0.166* | -0.292** | -0.030 | 0.330** | - 0.464** | -0.609** | |||||
| No. of siliqua/plant | 1.00 | 0.468** | 0.427** | 0.046 | 0.152 | 0.111 | ||||||
| Siliqua length(cm) | 1.00 | 0.764** | 0.151 | 0.461** | 0.256** | |||||||
| No. of seeds/siliqua | 1.00 | -0.023 | 0.375** | 0.316** | ||||||||
| Biological yield | 1.00 | 0.106 | -0.364** | |||||||||
| Seed yield (gm) | 1.00 | 0.880** | ||||||||||
| Harvest index (%) | 1.00 |
Table text extracted from the original PDF; superscript letters are shown inline. The original table image is below.
View original table image
| Characters | Days to first flowering | Days to 50% flowering | Days to maturity | No. of primary branches | No. of secondary branches | Plant height (cm) | No. of siliqua /plant | Siliqua length (cm) | No. of seeds/ siliqua | Biological yield | Seed yield (gm) | Harvest index (%) |
|---|---|---|---|---|---|---|---|---|---|---|---|---|
| Days to first flowering | 1.00 | 0.748** | 0.090 | -0.044 | -0.087 | 0.113 | -0.446** | -0.150 | -0.041 | -0.107 | -0.105 | -0.056 |
| Days to 50% flowering | 1.00 | 0.090 | -0.144 | -0.103 | 0.019 | -0.299** | -0.137 | -0.048 | -0.141 | -0.072 | -0.017 | |
| Days to maturity | 1.00 | 0.153 | -0.013 | -0.010 | 0.50 | -0.063 | -0.001 | -0.013 | -0.048 | -0.041 | ||
| No. of primary branches | 1.00 | 0.499** | -0.080 | 0.174* | 0.065 | 0.197* | -0.023 | 0.207* | 0.201* | |||
| No. of secondary branches | 1.00 | -0.055 | 0.179* | 0.002 | 0.192* | -0.061 | 0.168* | 0.191* | ||||
| Plant height(cm) | 1.00 | -0.066 | 0.097 | 0.176* | 0.122 | -0.157 | -0.214** | |||||
| No. of siliqua/plant | 1.00 | 0.163* | 0.242** | 0.029 | 0.123 | 0.098 | ||||||
| Siliqua length(cm) | 1.00 | 0.304** | 0.005 | 0.110 | 0.086 | |||||||
| No. of seeds/siliqua | 1.00 | -0.002 | 0.202* | 0.190* | ||||||||
| Biological yield | 1.00 | 0.197* | -0.264** | |||||||||
| Seed yield (gm) | 1.00 | 0.885** | ||||||||||
| Harvest index (%) | 1.00 |
Table text extracted from the original PDF; superscript letters are shown inline. The original table image is below.
View original table image
| Characters | Days to first flowering | Days to 50% flowering | Days to maturity | No. of primary branches | No. of secondary branches | Plant height (cm) | No. of siliqua /plant | Siliqua length (cm) | No. of seeds/ siliqua | Biological yield | Harvest index (%) |
|---|---|---|---|---|---|---|---|---|---|---|---|
| Days to first flowering | -0.19844 | 0.17473 | 0.00684 | 0.00609 | 0.23687 | -0.1824 | 0.00598 | 0.05001 | -0.10657 | -0.11129 | -0.09801 |
| Days to 50% flowering | -0.19477 | 0.17803 | 0.01223 | 0.00481 | 0.17244 | -0.15437 | 0.00445 | 0.11557 | -0.1051 | -0.13046 | -0.03473 |
| Days to maturity | -0.23955 | 0.3842 | 0.00566 | -0.03848 | -0.74394 | 1.33893 | -0.02418 | 0.15239 | -1.00542 | 0.1097 | -0.68743 |
| No. of primary branches | 0.05759 | -0.0408 | 0.01039 | -0.02098 | -0.53018 | 0.29108 | -0.00344 | -0.23782 | 0.5841 | -0.07992 | 0.21683 |
| No. of secondary branches | 0.09734 | -0.06357 | 0.00873 | -0.02303 | -0.48289 | 0.38096 | -0.00445 | -0.05887 | 0.29188 | -0.08874 | 0.32038 |
| Plant height (cm) | -0.06714 | 0.05097 | -1.507 | 0.01133 | 0.34122 | -0.53913 | 0.00171 | 0.08538 | -1.8026 | 0.18651 | -0.50254 |
| No. of siliqua/plant | 0.11492 | -0.07673 | 0.01326 | -0.007 | -0.20815 | 0.08929 | -0.01033 | -0.13688 | 0.25616 | 0.02593 | 0.09183 |
| Siliqua length (cm) | 0.03395 | -0.07038 | -0.00295 | -0.01707 | -0.09724 | 0.15746 | -0.00484 | -0.29233 | 0.45793 | 0.08525 | 0.21096 |
| No. of seeds/siliqua | 0.03528 | -0.03121 | -0.0095 | -0.02044 | -0.2351 | 0.01642 | -0.00441 | -0.22329 | 0.59951 | -0.01324 | 0.26103 |
| Biological yield | 0.03909 | -0.04111 | 0.0011 | 0.00297 | 0.07586 | -0.17799 | -0.00047 | -0.04411 | -1.505 | 0.56491 | -0.30026 |
| Harvest index (%) | 0.02357 | -0.00749 | -0.00472 | -0.00551 | -0.18747 | 0.32831 | -0.00115 | -0.07473 | 0.18964 | -0.20554 | 0.82523 |
Table text extracted from the original PDF; superscript letters are shown inline. The original table image is below.
View original table image
References
35 in the original paper- Akabari VR, Niranjana M. Genetic variability and trait association studies in Indian mustard (Brassica juncea L.). Int J Agric Sci. 2015;1(11):35-39.
- Brar KS, Mittal VP, Singh P. Estimation of genetic parameters, character association and path analysis for seed yield and components in Indian mustard (Brassica juncea L. Czern & Coss). In: Extended summaries, National Seminar on Changing Global Vegetable Oils Scenario: Issues and Challenges before India. Indian Soc Oilseed Res, DOR, Hyderabad; 2007 Jan 29-31. p. 42-43.
- Choudhary BR, Solanki ZS, Kumhar SR. Diversity analysis in Indian mustard (Brassica juncea Czern & Coss.). Genet Breed. 2016;1:386-387.
- Devi R, Devi ND, Vivekananda Y, Sharma R. Genetic diversity analysis in Indian mustard [Brassica juncea (L) Czern & Coss] genotypes using agro-morphological parameters. Electron J Plant Breed. 2017;8(3):749-753.
- Dewey DR, Lu KH. A correlation and path-coefficient analysis of components of crested wheatgrass seed production. Agron J. 1959;51:515-518.
- Dilip S, Shyam T, Singh SK, Kumar R. Genetic variability, character association and path analysis in Indian mustard. J Multidiscip Adv Res. 2016;5(1):5058.
- Gangapur DR, Parkash BG, Salimath PM, Ravi Kumar RL, Rao MSL. Correlation and path analysis in Indian mustard (Brassica juncea L. Czern & Coss). J Agric Sci. 2009;22(5):971-977.
- Hyder A, Iqbal A, Sheikh FA, Wani MA, Nagoo S, Khan MH, et al. Genetic variability studies for yield and yield attributing traits in Gobhi Sarson (Brassica napus L.) genotypes under temperate ecology of Kashmir. J Oilseed Brassica. 2021;12(1):44-48.
- Johnson HW, Robinson HF, Comstock RE. Estimates of genetic and environmental variability in soybean. Agron J. 1955;47(7):314-318.
- Lyngdoh Y, Kanaujia SP, Shah P. Genetic variability, character association and path coefficient analysis in green mustard (Brassica juncea L.) genotypes. Int J Recent Sci Res. 2017;8(8):388-391.
- Madhusoodanan KJ, Hrideek TK, Kuruvilla KM, Thomas J. Mustard cultivation practices. Indian J Arecanut Spices Med Plants. 2016;5(4):157-161.
- Mehla HR, Jambhukar SJ, Yadav OK, Sharma R. Genetic variability, correlation and path analysis in Indian mustard (Brassica juncea L. Czern & Coss). J Genet Plant Breed. 2003;63(2):171-172.
- Pant SC, Singh P. Genetic variability in Indian mustard. Agric Sci Dig. 2001;21(1):28-30.
- Ray K, Pal AK, Banerjee H, Phonglosa A. Correlation and path analysis studies for growth and yield International Journal of Biology Sciences https://www.biologyjournal.net contributing traits in Indian mustard (Brassica juncea L.). Int J Bioresour Stress Manag. 2014;5(2):200-206.
- Reddy J. Comprehensive guide for mustard farming. Agrifarming; 2015. Available from: https://www.agrifarming.in/mustard-farminginformation
- Salam JL, Mehta N, Tomar NS, Saxena RR, Sarawagi AK. Genetic variability analysis of yield and its components in Brassica campestris var. toria. Electron J Plant Breed. 2017;8(1):320-323.
- Singh AP. Comprehensive analysis of the nutritional profile of mustard (Brassica juncea L.) Seeds. International Journal of Agriculture and Nutrition. 2023;5(2):100-102. DOI: https://doi.org/10.33545/26646064.2023.v5.i2b.164
- Shekhawat N, Jadeja GC, Singh J. Genetic variability for yield and its components in Indian mustard (Brassica juncea L. Czern & Coss). Electron J Plant Breed. 2014;5(1):117-119.
- Singh C, Singh P, Singh R. Modern techniques of field crops. 2nd ed. New Delhi: Oxford & IBH Publishing; 2015. p. 58-59.
- Singh DK, Kumar K, Singh P. Heterosis and heritability analysis for different crosses in Brassica juncea with inheritance of white rust resistance. J Oilseed Brassica. 2012;3(1):18-26.
- Singh KH, Shakya R, Thakur AK, Chauhan DK, Chauhan JS. Genetic diversity in Indian mustard [Brassica juncea (L.) Czern & Coss] as revealed by agronomic traits and RAPD markers. Natl Acad Sci Lett. 2013;36(4):419-427.
- Singh M, Tomar A, Mishra CN, Srivastava SBL. Genetic parameters and character association studies in Indian mustard. J Oilseed Brassica. 2011;2(1):35-38.
- Srivastava K, Vimal SC, Giri SP, Verma AK. Studies on seed quality parameters in Indian mustard (Brassica juncea L.). Indian J Agric Sci. 2016;12(2):241-244.
- Synrem GJ, Rangare NR, Myrthong I, Bahadure DM. Variability studies in intraspecific crosses of Indian mustard (Brassica juncea L. Czern & Coss.). J Agric Vet Sci. 2014;7(9):29-32.
- Tiwari AK, Singh AK, Tomar, Singh M. Heritability, genetic advance and correlation coefficient analysis in Indian mustard (Brassica juncea L. Czern & Coss.). J Pharmacogn Phytochem. 2016;6(1):356-359.
- Tiwari VK. Morphological parameters in breeding for higher seed yield in Indian mustard (Brassica juncea L.). Electron J Plant Breed. 2019;10(1):187-195.
- Tomooka N, Lairungreang C, Nakeeraks P, Egawa Y, Thavarasook C. Center of genetic diversity and dissemination pathways in mung bean deduced from seed protein electrophoresis. Theor Appl Genet. 1992;83:289-293.
- Vaughan JG. Multidisciplinary subject of taxonomy and origin of Brassica crops. Bioscience. 1977;27(1):351.
- Wright S. Correlation and causation. J Agric Res. 1921;20:557-585.
- Kempthorne O. An Introduction to Genetic Statistics. New York: John Wiley & Sons; 1957. SCIRPGoogle Books
- Rout BK, Brooks G, Rhamdhani MA, et al. Dynamic model of basic oxygen steelmaking process based on multizone reaction kinetics modeling of manganese removal. Metall Mater Trans B. 2018;49:2191. doi:10.1007/s11663-018-1306-8 SCIRP
- Singh P, Gupta R, Patidar D, Singh RK. (Based on IJPSR 2014 reference as placeholder until full details available). Int J Pharm Sci Res. 2014;5(6):2095-2112. doi:10.13040/IJPSR.0975-8232.5(6).2095-12 xdocs.net
- Mandal K, Sinha A. Nutrient management effects on light interception, photosynthesis, growth, dry-matter production and yield of Indian mustard (Brassica juncea). J Agron Crop Sci. 2004;190(2):119-29. doi:10.1046/j.1439-037X.2003.00083.x
- Priyamedha, V.V., Singh, J.S., Chauhan, M.L., Meena, D.C., and Mishra, D.K. Correlation and path coefficient analysis for yield and yield components in early generation lines of Indian mustard (Brassica juncea L.). Current Advances in Agricultural Sciences. 2013;5(1):37-40.
- Shekhawat G, Jadeja C, Singh J, Shekhawat RS. Character association studies among yield and its component characters in Indian mustard (Brassica juncea L. Czern & Coss). Bioscan. 2014;9(2):685-688.