
Research article · 2025 · Full text
International Journal of Horticulture and Food ScienceThe effect of micronutrients and GA3 on growth and yield of tomato (Lycopersicon esculentum Mill.) cv. Kashi Chayan
Volume 7(8) · Pages 102–104 · DOI: 10.33545/26631067.2025.v7.i8b.373 ↗
Research areasCrop Yield and Soil FertilityAgricultural Science and FertilizationPlant Micronutrient Interactions and Effects
Abstract
Author-writtenThis study was conducted with the objective to determine the effect of micronutrients and GA3 on growth and yield of Tomato (Lycopersicon esculentum Mill.) cv. Kashi Chayan and an experiment was conducted at the horticultural farm, Udai Pratap (Autonomous) College, Varanasi (U.P.) during Rabi season of 2023-2024. Experiment was laid out in a randomized block design (RBD) with seven treatments replicated three times comprising GA3 and micronutrients with control i.e. T1: GA3 (50ppm), T2: GA3 (100ppm), T3: ZnSO4 (0.5%), T4: ZnSO4 (1%), T5: Boric acid (50ppm), T6: Boric acid (100ppm) and T7: Control. Significantly, differences were found for plant growth parameters viz. plant height (cm), number of branches plant-1, number of flower cluster-1, number of cluster plant-1, was recorded highest in T2: GA3 (100ppm). The treatment T2: GA3 (100ppm) was also found best in early days to 50% flowering, days to first fruit set and yield attributes viz., no. of fruit per cluster, no. of fruit plant-1, average fruit weight (g), fruit length (cm), fruit width (cm), fruit yield per plant (kg) and fruit yield (q/ha) in tomato cv. Kashi Chayan. It is revealed that the use of GA3 at the concentration of 100ppm, considerably increased the vegetative growth parameters and significantly increased growth and yield of tomato.
Summary
Source-checkedPlain-language reading of the full paper, prepared with AI and checked against the text. Each point links to the authors' own words.
Why it matters
- Tomato is a globally cultivated crop from the Solanaceae family known for its adaptability to various climates and soil types. View evidence ↗
- Foliar application of micronutrients can improve tomato yield and quality by increasing photosynthetic activity. View evidence ↗
- Gibberellic acid (GA3) is a growth regulator used to modify plant growth and yield traits. View evidence ↗
The question
- The study aimed to evaluate how different concentrations of micronutrients and GA3 affect the growth and yield of the tomato cultivar Kashi Chayan. View evidence ↗
What they did
- The field experiment took place at Udai Pratap College in Varanasi during the 2023-2024 Rabi season. View evidence ↗
- The study used a randomized block design with three replicates and seven treatments: GA3 (50 and 100 ppm), ZnSO4 (0.5% and 1%), Boric acid (50 and 100 ppm), and a control. View evidence ↗
- Researchers measured growth parameters (height, branches, flowering time) and yield attributes (fruit number, weight, dimensions, and total yield per plant and hectare). View evidence ↗
- Data analysis was performed using ANOVA with mean separation at a 5% probability level. View evidence ↗
What they found
- Treatment with 100 ppm GA3 resulted in the most branches per plant (11.95), while the control had the fewest (7.10). View evidence ↗
- Plants treated with 100 ppm GA3 reached 50% flowering fastest (62.34 days), whereas the control took the longest (76.51 days). View evidence ↗
- The number of fruits per plant was highest in the 100 ppm GA3 group (47.80) and lowest in the control (22.43). View evidence ↗
- Average fruit weight peaked at 104.46g with 100 ppm GA3, compared to 82.32g for the control. View evidence ↗
- Fruit yield per plant was highest with 100 ppm GA3 (3.33 kg) and lowest in the control (1.56 kg). View evidence ↗
- The total fruit yield per hectare was highest for 100 ppm GA3 (437.35 q/ha) and lowest for the control (240.56 q/ha). View evidence ↗
What it means
- The authors conclude that 100 ppm of GA3 is the most effective treatment for enhancing the growth and yield of Kashi Chayan tomatoes. View evidence ↗
Visual summary
3 visualsIllustrations explain the paper; charts are replotted from the paper's own table values.
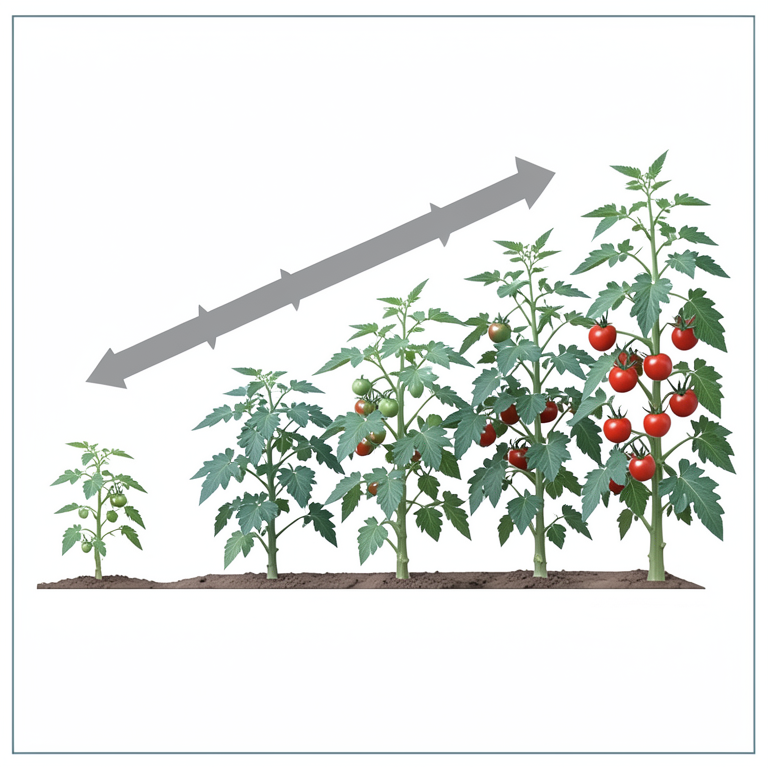
Experimental Treatment Layout
AI-generated conceptual illustration (tomato plants (Lycopersicon esculentum Mill. cv. Kashi Chayan)). It explains the idea and does not show study data.
View source evidence ↗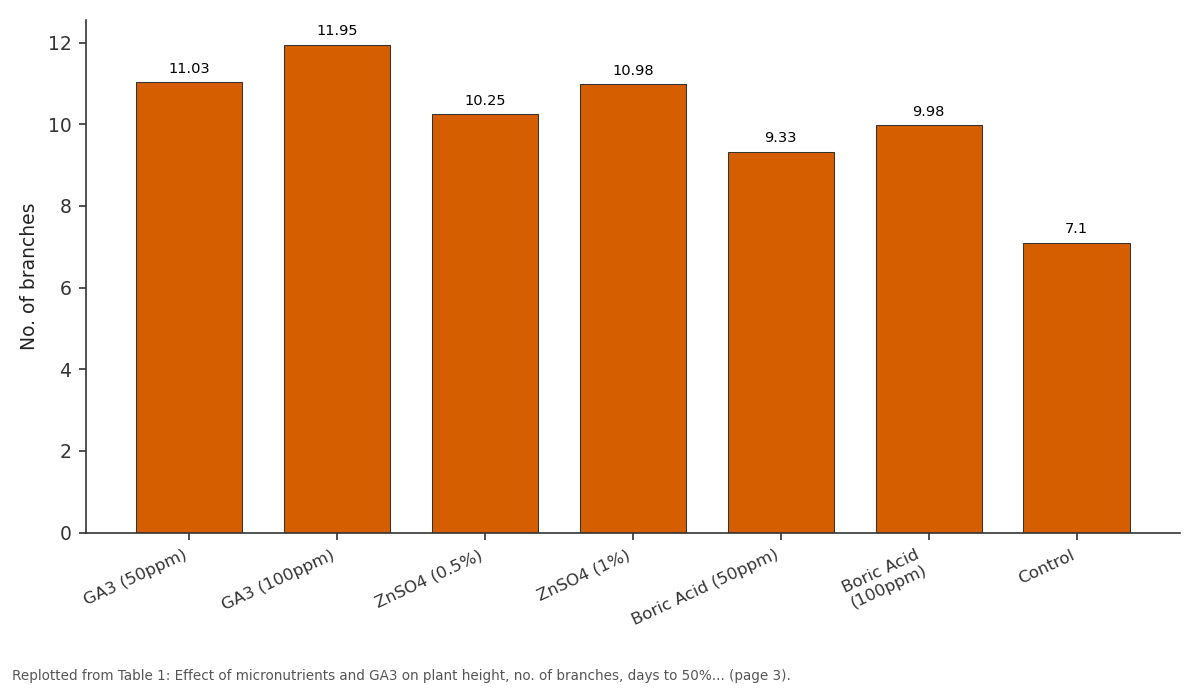
No. of branches: GA3 (50ppm) vs GA3 (100ppm) vs ZnSO4 (0.5%) vs ZnSO4 (1%) vs Boric Acid (50ppm)
Replotted from Table 1 (page 3) of the original paper. Every bar is the paper's own table value.
View source evidence ↗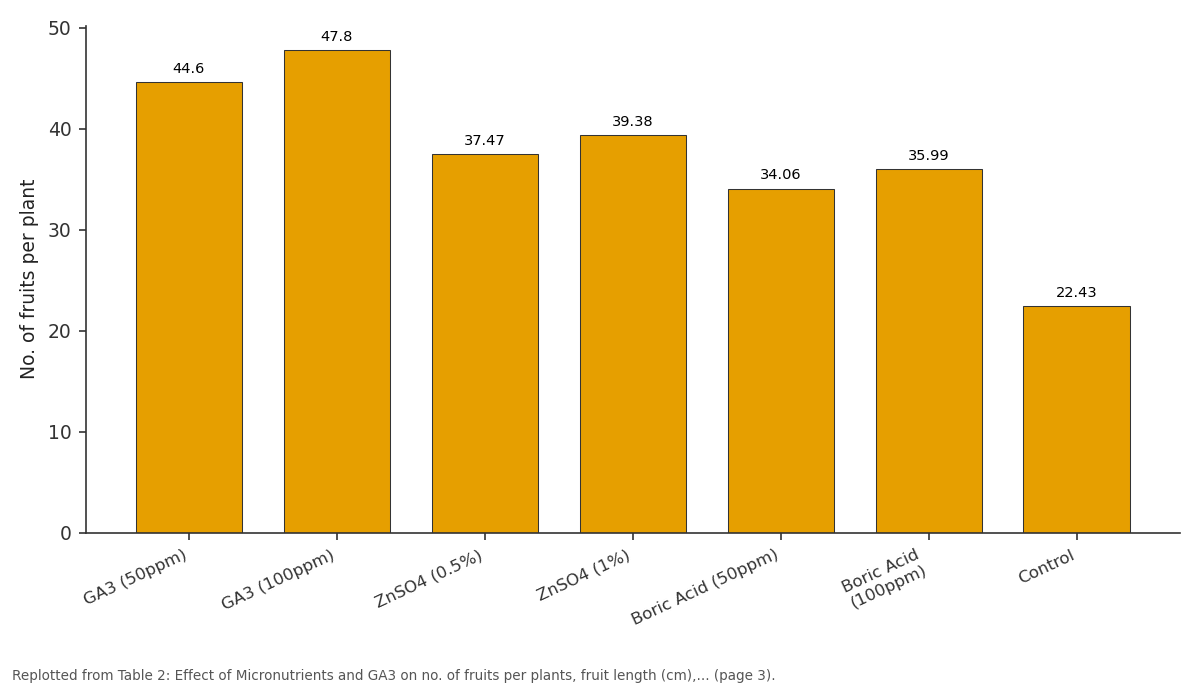
No. of fruits per plant: GA3 (50ppm) vs GA3 (100ppm) vs ZnSO4 (0.5%) vs ZnSO4 (1%) vs Boric Acid (50ppm)
Replotted from Table 2 (page 3) of the original paper. Every bar is the paper's own table value.
View source evidence ↗Figures & tables
From the original paper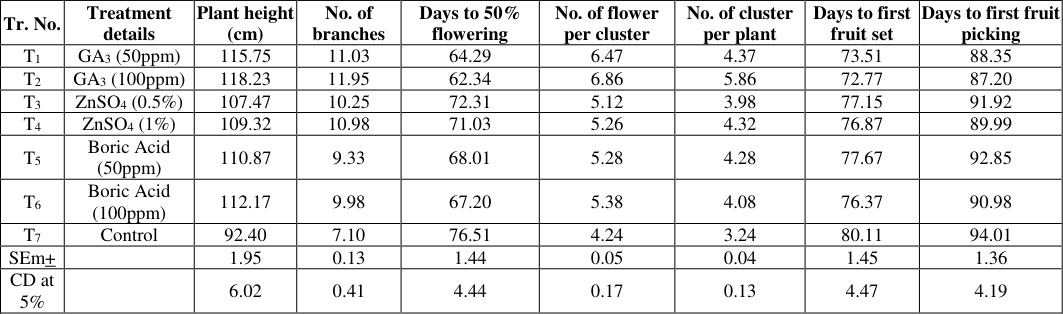 Table 1
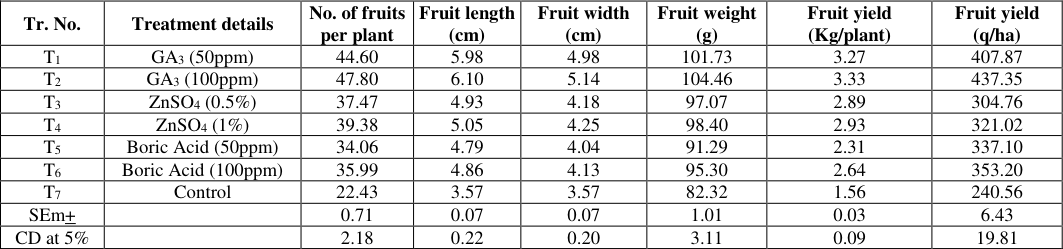 Table 2
Introduction
Tomato (Lycopersicon esculentum Mill.) is a member of the Solanaceae family and is a diploid species with a chromosome number of 2n=24. Originally native to Peru and Mexico, it is now widely cultivated across the globe due to its ability to thrive in a variety of soil types and climates (Gerszberg et al., 2015) [4] . The top tomato-producing countries include China, the United States, India, Egypt, Turkey, Iran, Mexico, Brazil, and Indonesia [FAO, 2022]. Tomato is a warm-season crop that is sensitive to cold temperatures (Afshari et al., 2014) [1] . It can be cultivated in both the wet and dry seasons, provided the annual rainfall ranges from 60 to 150 cm. However, excessive rainfall during its growth period can be detrimental to the plant. Micronutrients play a crucial role in plant processes, and foliar application of these nutrients can enhance both the quality and yield of tomatoes (Ali et al., 2012) [2] by boosting the photosynthetic activity in green plants (Singh and Tiwari, 2013) [13] . Micronutrients management is essential to boost the crop production and also increased the fruits quality. Boron and zinc important micronutrient for quality tomato fruit production. Zinc regulates growth and also promotes balanced sugar consumption and Boron helps to providing some nutrients and essential for proper development of their fruits and seeds. Gibberellic acid is a key growth regulator with various potential applications for altering plant growth, yield, and yield-related traits (Rafeekher). Considering the facts, the current study aims to examine the effects of Micronutrients and GA3 on the growth and yield of tomato.
Materials and Methods
A field experiment entitled "The effect of micronutrients and GA3 on growth and yield of Tomato (Lycopersicon esculentum Mill.) cv. Kashi Chayan" was conducted at the experimental field of Department of Horticulture, Udai Pratap (Autonomous) College, Varanasi (U.P.) during Rabi season of 2023-2024. Experiment was laid out in a randomized block design (RBD) with seven treatments replicated three times comprising GA3 and micronutrients with control i.e. T1: GA3 (50ppm), T2: GA3 (100ppm), T3: ZnSO4 (0.5%), T4: ZnSO4 (1%), T5: Boric acid (50ppm), T6: Boric acid (100ppm) and T7: Control. The collected data includes plant height (cm), number of branches plant -1 , number of flower cluster -1 , number of cluster plant -1 , early days to 50% flowering, days to first fruit set and yield attributes viz., no. of fruit per cluster, no. of fruit plant -1 , average fruit weight (g), fruit length (cm), fruit width (cm), fruit yield per plant (kg) and fruit yield (q/ha) in tomato cv. Kashi Chayan. The data was analyzed using analysis of variance (ANOVA), and mean separation was performed at a 5% probability level Sahu et al., (2022) [12] .
Results and Discussion
The data on the effects of various micronutrients and GA3 on plant height at different growth stages were statistically analyzed and are detailed in Table 1. It clearly showed that the plant height differed significantly with each other, the maximum plant height (118.23 cm) was recorded in the treatment T2 (GA3 @ 100 ppm. The minimum plant height was noted 92.40 cm at the time of harvesting in treatment T7 (Control). The data on the effects of various micronutrients and GA3 on no. of branches per plant at different growth stages were statistically analyzed and are detailed in Table 1. It clearly showed that the no. of branches differed significantly with each other, the highest no. of branches (11.95) was recorded in the treatment T2 (GA3 @ 100 ppm). The lowest no. of branches was noted 7.10 at the time of harvesting in treatment T7 (Control). The shortest duration to reach 50% flowering in tomato plants was observed in treatment T2 (GA3 @ 100 ppm), requiring just 62.34 days. This was followed by treatment T1 (GA3 @ 50 ppm), which required 64.29 days. In contrast, the longest duration of 76.51 days to reach 50% flowering was recorded in the control treatment T7. Onofeghara (1981) [8] reported similar findings, attributing them to the role of GA3 in regulating flower initiation and development. GA3 is crucial for both male and female fertility (Griffiths et al., 2006) [5] . The data on the effects of various micronutrients and GA3 on no. of flower per cluster were statistically analyzed and are detailed in Table 1. The highest number of flowers per cluster, averaging 6.86, was observed in treatment T2 (GA3 @ 100 ppm). This was followed by T1 (GA3 @ 50 ppm) and T6 (Boric acid @ 100 ppm), which had 6.47 and 5.38 flowers per cluster, respectively. The highest number of clusters per plant, at 5.86, was observed in treatment T2 (GA3 @ 100 ppm), followed by T1 (GA3 @ 50 ppm). Both micronutrients and GA3 had a notable impact on the days to the first fruit set during the 2023-24 period. The shortest duration to the first fruit set, at 72.77 days, was observed in treatment T2 (GA3 @100 ppm), followed by T1 (GA3 @ 50 ppm). Both micronutrients and GA3 had a considerable impact on the timing of the first fruit picking during the 2023-24 period. The shortest time to the first fruit picking, at 87.20 days, was recorded in treatment T2 (GA3 @100 ppm), followed by T1 (GA3 @50 ppm) at 88.35 days.
| Tr. No. | Treatment details | Plant height (cm) | No. of branches | Days to 50% flowering | No. of flower per cluster | No. of cluster per plant | Days to first fruit set | Days to first fruit picking |
|---|---|---|---|---|---|---|---|---|
| T1 | GA3 (50ppm) | 115.75 | 11.03 | 64.29 | 6.47 | 4.37 | 73.51 | 88.35 |
| T2 | GA3 (100ppm) | 118.23 | 11.95 | 62.34 | 6.86 | 5.86 | 72.77 | 87.20 |
| T3 | ZnSO4 (0.5%) | 107.47 | 10.25 | 72.31 | 5.12 | 3.98 | 77.15 | 91.92 |
| T4 | ZnSO4 (1%) | 109.32 | 10.98 | 71.03 | 5.26 | 4.32 | 76.87 | 89.99 |
| T5 | Boric Acid (50ppm) | 110.87 | 9.33 | 68.01 | 5.28 | 4.28 | 77.67 | 92.85 |
| T6 | Boric Acid (100ppm) | 112.17 | 9.98 | 67.20 | 5.38 | 4.08 | 76.37 | 90.98 |
| T7 | Control | 92.40 | 7.10 | 76.51 | 4.24 | 3.24 | 80.11 | 94.01 |
| SEm+ | 1.95 | 0.13 | 1.44 | 0.05 | 0.04 | 1.45 | 1.36 | |
| CD at 5% | 6.02 | 0.41 | 4.44 | 0.17 | 0.13 | 4.47 | 4.19 |
Table text extracted from the original PDF; superscript letters are shown inline. The original table image is below.
View original table image
The data on the effects of various micronutrients and GA3 on no. of fruits per plant were statistically analyzed and are detailed in Table 2. Among the treatments, T2 (GA3 @ 100 ppm) yielded the highest number of fruits per plant at 47.80, showing a significant improvement compared to other treatments. This was followed by T1 (GA3 @ 50 ppm), which produced 44.60 fruits per plant. In contrast, the control (T7) recorded a significantly lower number of fruits per plant (22.43). The longest fruit length, measuring 6.10 cm, was observed in treatment T2 (GA3 @ 100ppm), which was significantly superior to other treatments. This was followed by T1 (GA3 @ 50 ppm) and T4 (ZnSO4 @ 1%), with fruit lengths of 5.98 cm and 5.05 cm, respectively. The shortest fruit length, at 3.57 cm, was recorded in the control group T7. The results of various levels of micronutrients and GA3 across different treatment combinations are shown in Table 2. The greatest fruit width, measuring 5.14 cm, was observed in treatment T2 (GA3 at 100 ppm), followed by T1 (GA3 at 50 ppm) at 4.98 cm. The results of various levels of micronutrients and GA3 across different treatment combinations are shown in Table 2. The weight of individual tomato fruits varied significantly with the application of different levels of GA3 and micronutrient. The highest average fruit weight (104.46g), was recorded in treatment T2 (GA3 @ 100 ppm), followed by T1 (101.73g) and T4 (98.40g). The lowest average fruit weight, 82.32g, was observed in the control (T7). These findings are reported by Lilov and Donchev (1984) [7] Naeem et al. (2001) [9] . The results of various levels of micronutrients and GA3 across different treatment combinations are shown in Table 2. Statistical analysis of the data on tomato fruit yield per plant (Kg) revealed significant differences. Different levels of GA3 had a significant impact on the yield of fruit per plant. The highest yield, at 3.33 kg per plant, was achieved with 100 ppm GA3, while the lowest yield, 1.56 kg per plant, was observed under control conditions.The results of various levels of micronutrients and GA3 across different treatment combinations are shown in Table 2. Statistical analysis of the data on tomato fruit yield per hectare (q) revealed significant differences. The application of different levels of GA3 significantly affected the fruit yield per hectare. The highest yield, 437.35 q/ha, was obtained with T2 (GA3 @ 100 ppm), followed by T1 (GA3 @ 50 ppm) at 407.87 q/ha whereas the lowest yield, 240.56 q/ha, was recorded in the control (T7).
| Tr. No. | Treatment details | No. of fruits per plant | Fruit length (cm) | Fruit width (cm) | Fruit weight (g) | Fruit yield (Kg/plant) | Fruit yield (q/ha) |
|---|---|---|---|---|---|---|---|
| T1 | GA3 (50ppm) | 44.60 | 5.98 | 4.98 | 101.73 | 3.27 | 407.87 |
| T2 | GA3 (100ppm) | 47.80 | 6.10 | 5.14 | 104.46 | 3.33 | 437.35 |
| T3 | ZnSO4 (0.5%) | 37.47 | 4.93 | 4.18 | 97.07 | 2.89 | 304.76 |
| T4 | ZnSO4 (1%) | 39.38 | 5.05 | 4.25 | 98.40 | 2.93 | 321.02 |
| T5 | Boric Acid (50ppm) | 34.06 | 4.79 | 4.04 | 91.29 | 2.31 | 337.10 |
| T6 | Boric Acid (100ppm) | 35.99 | 4.86 | 4.13 | 95.30 | 2.64 | 353.20 |
| T7 | Control | 22.43 | 3.57 | 3.57 | 82.32 | 1.56 | 240.56 |
| SEm+ | 0.71 | 0.07 | 0.07 | 1.01 | 0.03 | 6.43 | |
| CD at 5% | 2.18 | 0.22 | 0.20 | 3.11 | 0.09 | 19.81 |
Table text extracted from the original PDF; superscript letters are shown inline. The original table image is below.
View original table image
Conclusion
The results of the present study indicate that the application of GA3 (50 ppm and 100 ppm) and micronutrients such as ZnSO4 (0.5% and 1%) and boric acid (50 ppm and 100 ppm) notably enhanced vegetative growth, flowering, and significantly boosted tomato yield. Based on these findings, it can be concluded that GA3 at a concentration of 100 ppm was the most effective treatment for improving both vegetative growth and yield in tomato variety Kashi Chayan.
References
13 in the original paper- Afshari M, Afsharmanesh GHR, Yousef K. The effect of enriched organic fertilizer and methanol spray on the greenhouse-tomato yield. J Agric Sci. 2014;6(11):1420.
- Ali S, Javed HU, Rehman RN, Sabir IA, Naeem MS, Siddiqui MZ, Saeed DA, Nawaz MA. Foliar application of some macro and micronutrients improves tomato growth, flowering and yield. Int J Biosci. 2012;3(10):280-7.
- Food and Agriculture Organization of the United Nations. World food and agriculture-statistical year book 2022. Rome: FAO; 2022: https://openknowledge.fao.org
- Gerszberg A, Konka KH, Kowalczyk T, Kononowicz AK. Tomato (Solanum lycopersicum L.) in the service of biotechnology. J Plant Biotechnol. 2015;120:881902.
- Griffiths J, Murase K, Rieu I, Zentella R, Zhang ZL, Powers SJ. Genetic characterization and functional analysis of the GID1 gibberellin receptors in Arabidopsis. Plant Cell. 2006;18(3):399-414.
- Kumar A, Biswas TK, Singh N, Lal EP. Effect of gibberellic acid on growth, quality and yield of tomato (Lycopersicon esculentum Mill.). J Agric Vet Sci. 2014;7(4):28-30.
- Lilov D, Donchev T. Effect of Bulgarian gibberellin preparation on tomato fruiting. Gradinarska Lozarska Nauka. 1984;21(1):49-55.
- Onofeghara FA. The effects of growth substance on flowering and fruiting of tomato (Lycopersicon esculentum Mill.). Phyton (Argentina). 1981;40(1):10716.
- Naeem N, Ishitiaq M, Khan P, Mohammad N, Khan J, Jamiher B. Effect of GA3 on growth and yield of tomato cv. Roma. J Biol Sci. 2001;1:448-50.
- Rafeekar M, Nair SA, Sorte PN, Hatwal GP, Chandan PM. Effect of growth regulator on growth and yield of summer cucumber. J Soils Crops. 2002;12(2):108-10.
- Ranjeet RB, Ram P, Meena ML. Growth, flowering, fruiting, yield and quality of tomato (Lycopersicon esculentum Mill.) as influenced by plant bio-regulators. Int J Plant Sci. 2014;9(1):67-71.
- Sahu S, Choudhary AS, Raj S, Ghode N, Kumar A. Effect of micronutrients on yield attributes of tomato. Int. J Agric. Nutr., 2022;4(1):34-38. DOI: 10.33545/26646064.2022.v4.i1a.51
- Singh HM, Tiwari JK. Impact of micronutrient spray on growth, yield and quality of tomato (Lycopersicon esculentum Mill.). HortFlora Res Spectrum. 2013;2(1):87-9.