
Research article · 2025 · Full text
International Journal of Agriculture and Food ScienceAn assessment of selected heavy metals in soil and food crops grown on the mined-out bauxite soil of Guyana
Volume 7(8) · Pages 1066–1079 · DOI: 10.33545/2664844x.2025.v7.i8j.675 ↗
Research areasHeavy metals in environment
Abstract
Author-writtenBackground and Aim: Bauxite mining alters the physicochemical properties of the soil and has increased the levels of some heavy metals in the soil. The study quantifies Al, Cd, Cr, Cu, Mn, Pb and Zn in soils and six food crops collected from three post-mined and one unmined district in two physiographic regions of Guyana. Methods: Sampling were conducted in agreement with the reiteration student’s t-test that was performed to determine appropriate sample size whose margin of error was 10.4% calculated on encountering Pb in soil samples. Twenty-seven soil samples and twenty-four food plant samples (including Brassica rapa cv. chinensis; Spinacia oleracea; Cocos nucifera L, Manihot esculenta, Apium graveolens and Lycopersicon esculentum) were collected from four (three mined-out and one unmined) districts. Using ICP-OES/ICP-MS data, the author calculates geo-accumulation, and bioaccumulation factors and compares results with FAO/WHO Codex standards. In addition, chemical parameters like soil pH and organic matter contents were determined by Activation Laboratory Inc., an ISO 9001:2015: IEC/17025-accredited facility. With the data obtained the geo-chemical index and bioaccumulation factor were calculated and compared with the FAO/WHO Codex Standards using one-way ANOVA and Pearson correlation using version 20 of the Statistical Package for the Social Sciences. QA/QC were performed in accordance with the standard laboratory procedure of Act Lab Inc. Results: In descending order, the mean heavy metals concentration (mg kg-1) in the soils were: Al > Mn > Zn > Cr > Pb > Cu > Cd. The heavy metal concentration in all soil samples did not exceed the permissible limits set by the FAO/WHO. Bauxite-mined soils did not affect soil pH or organic matter content but had significantly higher levels of lead and zinc (p
Summary
Source-checkedPlain-language reading of the full paper, prepared with AI and checked against the text. Each point links to the authors' own words.
Why it matters
- Agriculture is a fundamental pillar of Guyana's economy, encompassing both traditional crops like rice and sugar cane and non-traditional options such as fruits and vegetables. View evidence ↗
- Bauxite mining is known to change the physicochemical properties of soil and increase the concentrations of certain heavy metals. View evidence ↗
- Heavy metals can pose risks to living organisms even if their concentrations do not exceed established Codex standards. View evidence ↗
The question
- The study aims to analyze heavy metal levels in four communities using reclaimed bauxite soil and examine the presence of these metals in six major crops grown there. View evidence ↗
What they did
- Heavy metal concentrations were measured using ICP-OES/ICP-MS to calculate geo-accumulation and bioaccumulation factors, which were then compared to FAO/WHO Codex standards. View evidence ↗
- Soil pH and organic matter content were determined by an ISO-accredited facility, Activation Laboratory Inc. View evidence ↗
What they found
- Bauxite mining did not have a statistically significant effect on soil pH across the studied districts (P=0.835). View evidence ↗
- The mean organic matter (OM) content was similar across treatment means (P=0.788), indicating that bauxite mining did not significantly affect soil OM. View evidence ↗
- Lead (Pb) concentrations differed significantly among districts (p<0.05), with the unmined region showing higher concentrations than the mined-out regions. View evidence ↗
- Zinc (Zn) concentrations were significantly different among the treatment means (P=0.020). View evidence ↗
- Heavy metal concentrations in all tested soil samples remained within the permissible limits set by the FAO/WHO. View evidence ↗
- While coconut water remained below thresholds, leafy vegetables, tomatoes, and cassava often exceeded the Joint FAO/WHO Codex permissible limits for heavy metals. View evidence ↗
- In the Three Friends district, there was a significant positive correlation (r=0.885, p<0.05) between soil pH and organic matter. View evidence ↗
What it means
- The authors conclude that a soil pH of 6.4 and organic matter content of 11.05% are desirable for cultivating food crops on bauxite soil. View evidence ↗
- The study concludes that bauxite mining affects soil heavy metal concentrations and that five of the six food crops tested are effective bio-accumulators of these metals. View evidence ↗
Visual summary
3 visualsIllustrations explain the paper; charts are replotted from the paper's own table values.
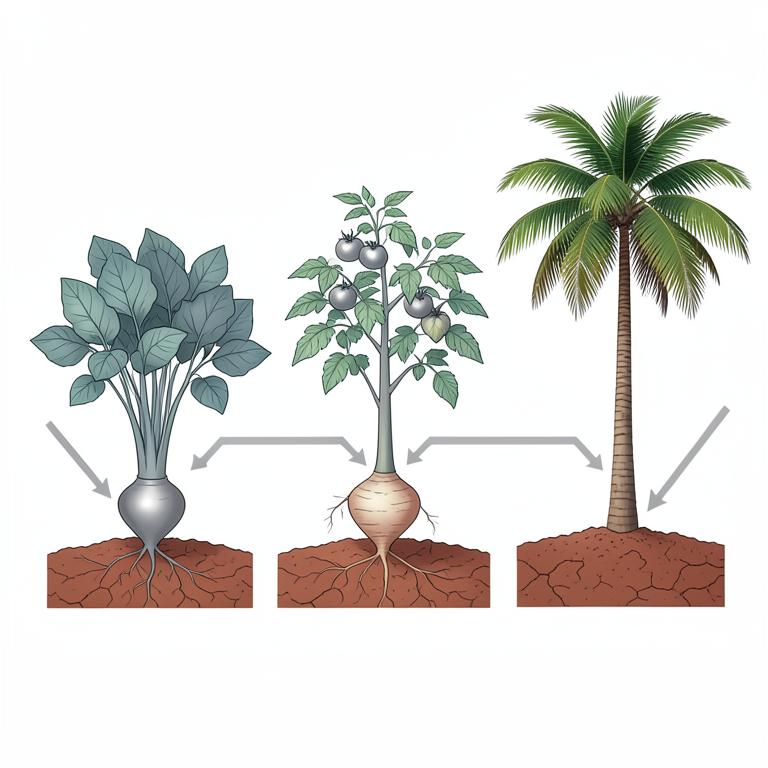
Heavy Metal Accumulation Comparison
AI-generated conceptual illustration (Leafy greens, tomato plants, cassava roots, and coconut palms grown in bauxite-rich soil). It explains the idea and does not show study data.
View source evidence ↗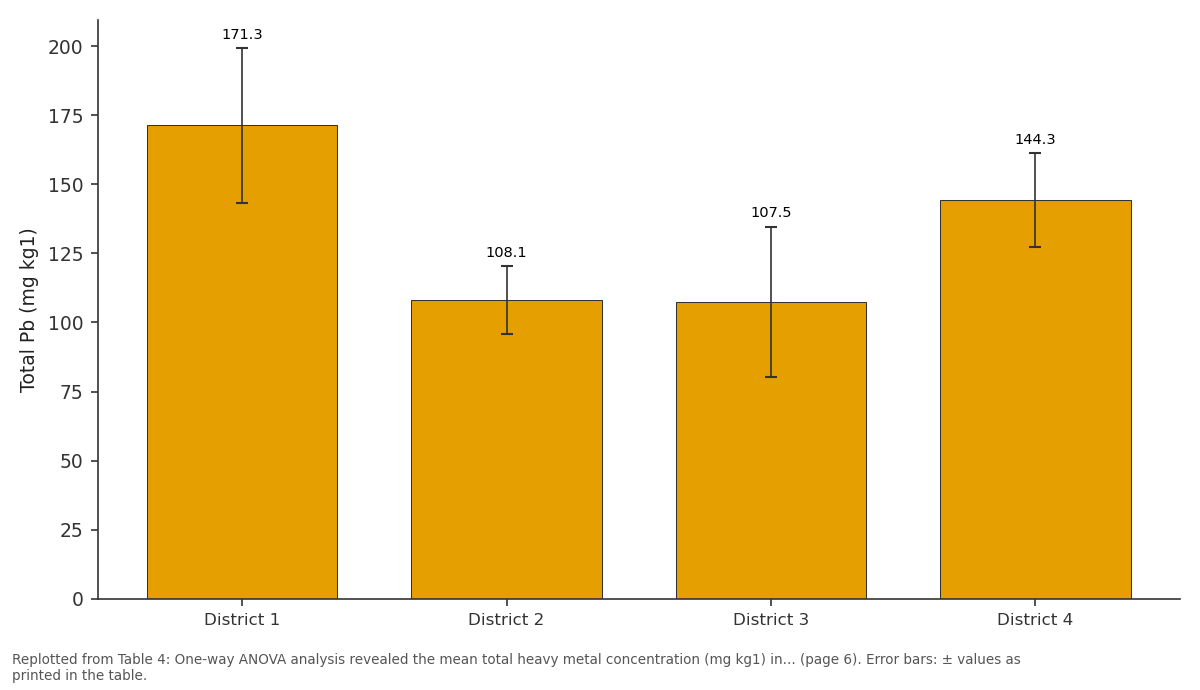
Total Mn: District 1 vs District 2 vs District 3 vs District 4
Replotted from Table 4 (page 6) of the original paper. Every bar is the paper's own table value.
View source evidence ↗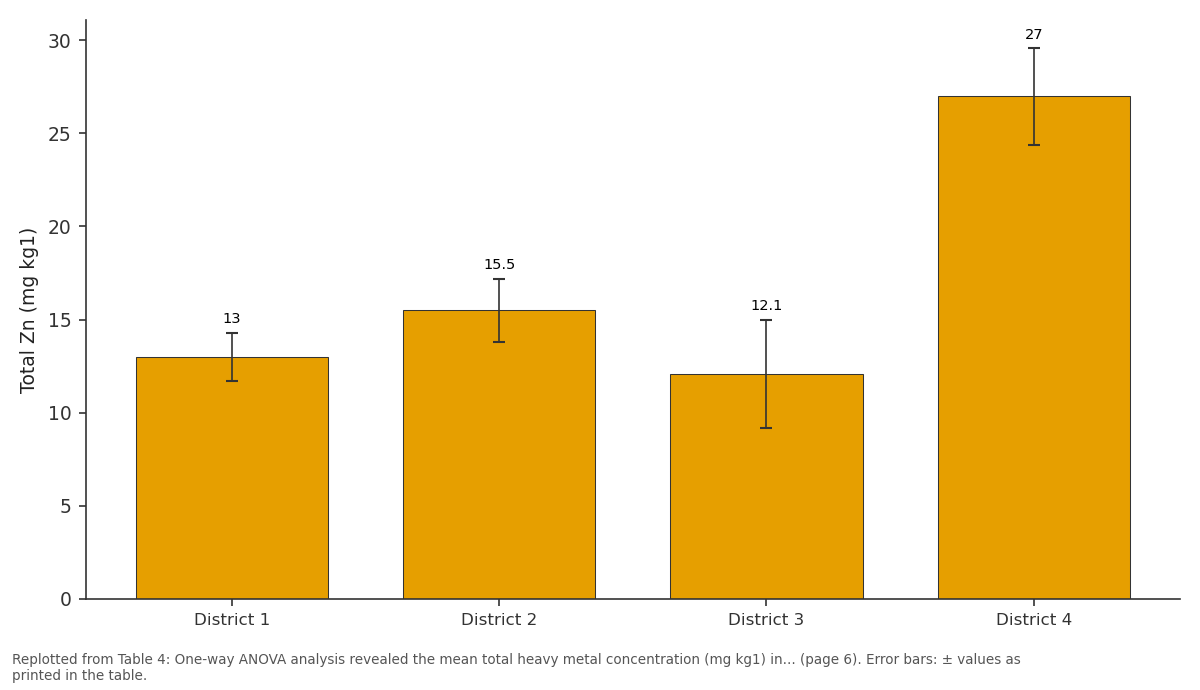
Total Pb: District 1 vs District 2 vs District 3 vs District 4
Replotted from Table 4 (page 6) of the original paper. Every bar is the paper's own table value.
View source evidence ↗Figures & tables
From the original paper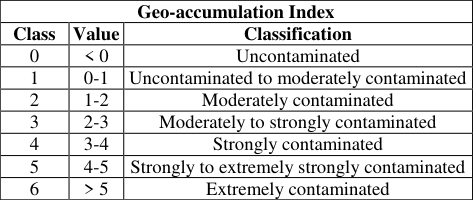 Table 1Page 4
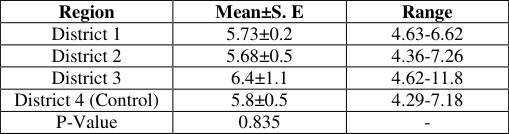 Table 2Page 4
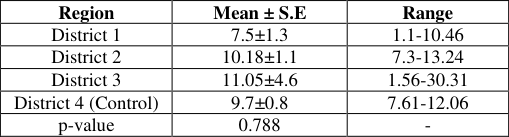 Table 3Page 5
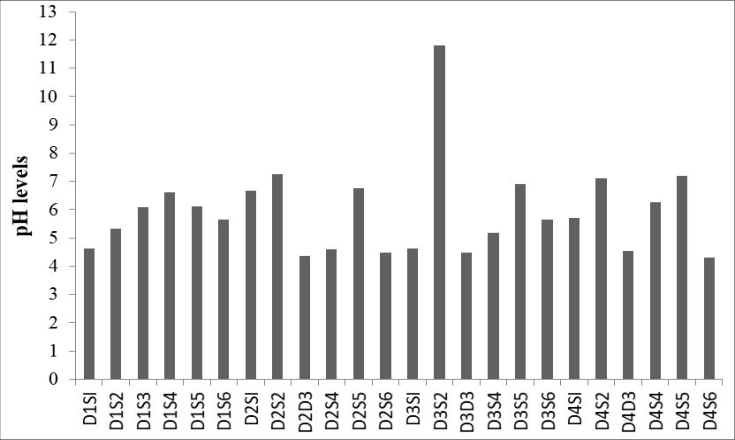 Figure 1Page 5
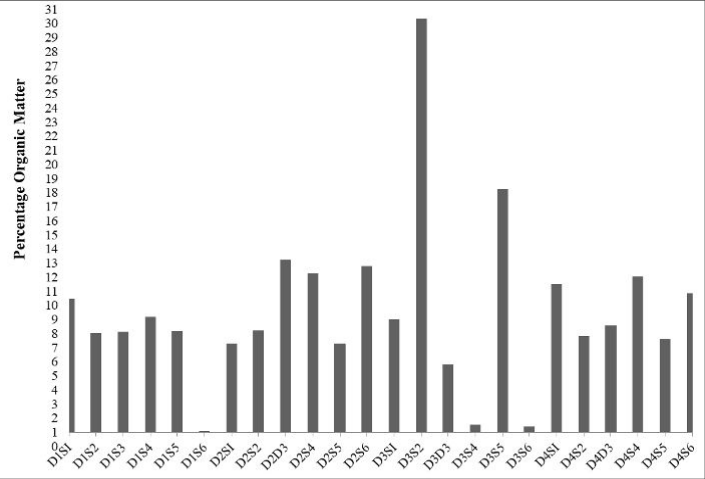 Figure 2Page 5
 Table 4Page 6
 Table 4APage 6
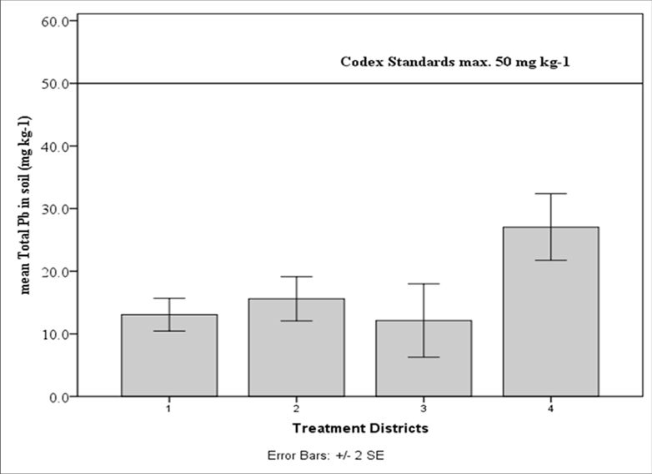 Figure 3Page 6
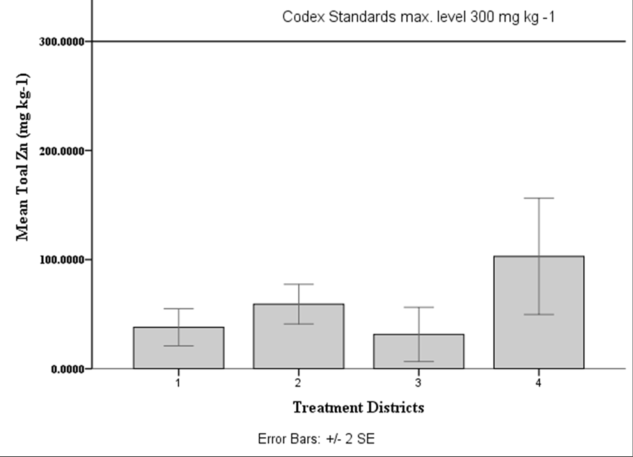 Figure 4Page 6
 Table 5Page 7
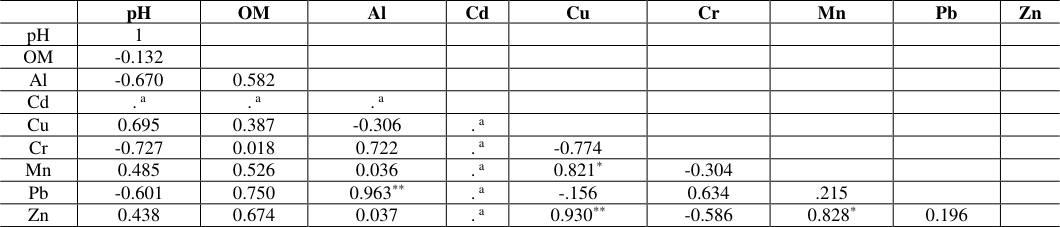 Table 6Page 7
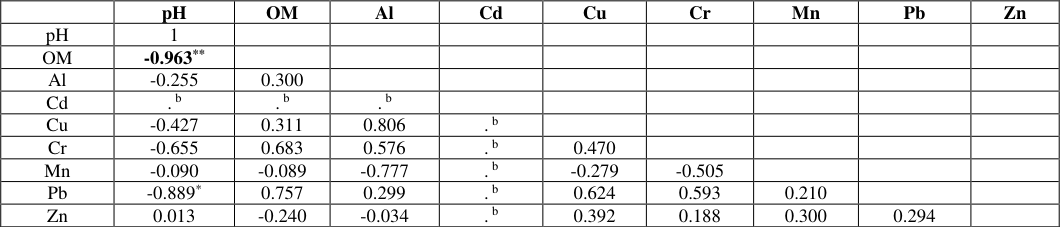 Table 7Page 7
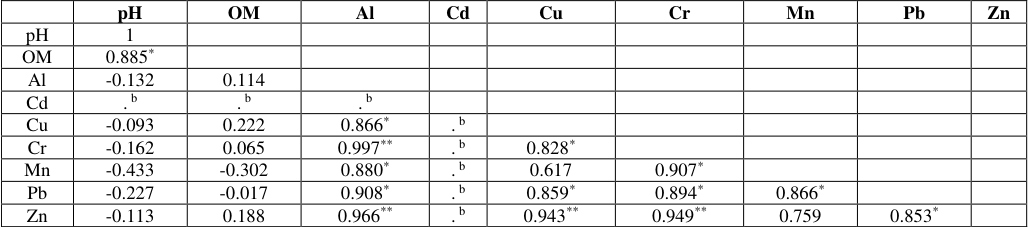 Table 8Page 7
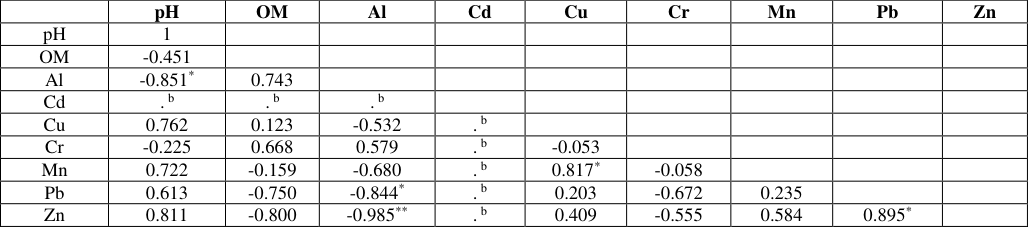 Table 9Page 7
 Table 10Page 8
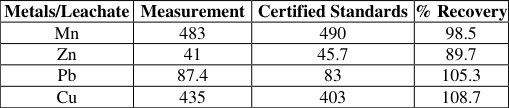 Table 10APage 8
 Table 11Page 8
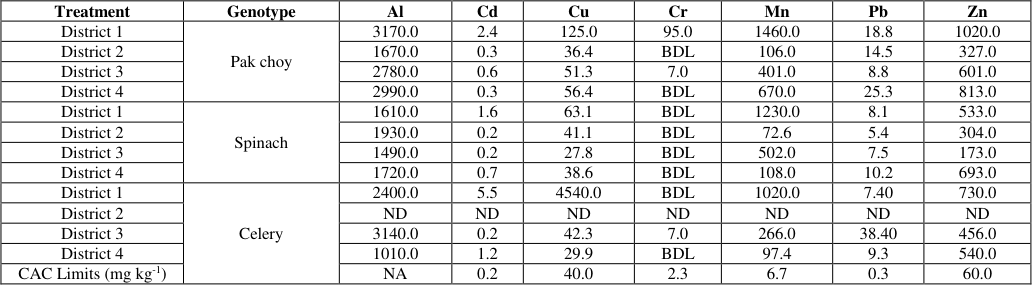 Table 12Page 8
 Table 13Page 8
 Table 13APage 9
 Table 14Page 9
 Table 15Page 9
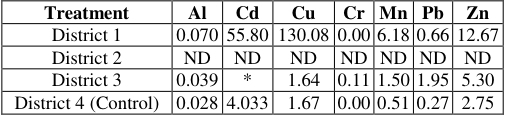 Table 18Page 9
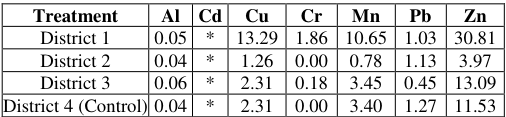 Table 16Page 9
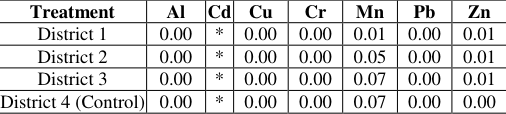 Table 19Page 9
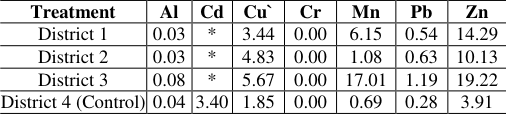 Table 17Page 9
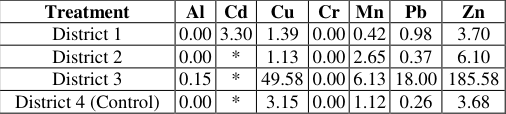 Table 20Page 9
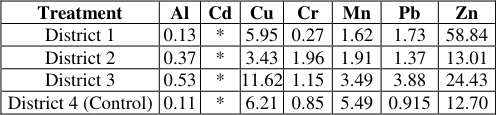 Table 21Page 10
Introduction
Guyana is positioned on the northeastern corridor of South America. This English-speaking country is located on the Atlantic coast, positioned between 1 o & 9 o North Longitude and 57 o & 61 o West Latitude. The nation boasts approximately 214, 970 km 2 in land area. Mining, forestry, agriculture and lately unearthed oil resources are its primary economic activities (Espinosa et al., 2022; GoG, 2013) [33,36] . The agricultural sector is considered the pillar of the Guyanese economy. This sector comprises traditional crops like rice and sugar cane as well as non-traditional crops like fruits, vegetables, orchards, and coconut palms. This sector supplies products for exports as well as domestic use.
The domestic agricultural sector provides food for the local population, of which leafy vegetables (Pak choi, celery and poi), root/tuber (cassava), coconut fluids and tomato are major components. This subsector accounted for 23.8% of non-oil GDP in 2023, highlighting agri-diversification (Benn et al., 2021; Cleveland, 2012; IDB, 2024; Narine et al., 2019) [14,21,44,60] . The mining sector of Guyana includes subsectors of gold, bauxite, diamonds, manganese, sand, and stones. In 2023, this subsector contributed 9.7% of GDP (approximately USD 888.2 million). Bauxite mining has been a significant subsector in Guyana, contributing 0.4% of GDP in 2023, roughly USD 79.6 Million (IDB, 2024) [44] . Bauxite mining activities are centred on Linden. It is located at 107.5 kilometres from Georgetown, the capital of Guyana. Community and agricultural land located on reclaimed mining sites characterise the landscape of the bauxite sector. Approximately 12,000 hectares of land have been effectively reclaimed for agricultural food production. These lands are scattered throughout the bauxite belt, an arc about 300 km long and 25-40 km in width (GoG, 2013; Jaikaran et al., 2017) [36,46] . The mineralogy and origin of the Guyana bauxite commenced in the Paleoproterozoic epoch. These occurrences transpired some 2.2 billion years ago and produced the Guiana Shield. The mineralisation and origin of the bauxite deposits in Guyana are characterised by two theories: The first theory describes weathering as a result of successive physical, chemical, and biological processes acting on sedimentary and igneous parent rocks (Chairidchai & Ritchie, 1990; Mateus et al., 2017) [20,57] . This process results in the formation of fragments that release their components (Kroonenberg et al., 2019) [50] . The other theory posits that acidic rainwater modifies parent rocks, with an annual mean precipitation of 1700-2200 mm, an average annual temperature of 27.5 degrees Celsius, and short dry seasons (BárDoSSy & Aleva, 1990; Beunk et al., 2021) [11,15] . The bauxite deposit is also utilised to extract and concentrate leached minerals that have undergone massive weathering. During the process, fine sediments, silica (Si), free aluminium (Al), and iron (Fe) are reconfigured. The change results from the continuous breakdown of organic matter transforming gibbsite, feldspar, mica, and illite into kaolinite clay. Kaolinite coexists with gibbsite, having formed in situ and substituted the alumina in gibbsite with dissolved silicon. Clay gels are produced by these processes throughout the Tertiary age (Mateus et al., 2017) [57] . The kaolinite present comprises the elements Al, Si, Fe, K, and P, in addition to substantial quantities of contaminants on the soil surface (Hurst & Pickering, 1997; Tan, 1989) [43,78] . The bauxite deposit results from weathering and rainfall modifications that mobilise heavy metals contained in clay, which encases gibbsite. It is possible from this clay that chemisorption is the main process by which Cr and other metals increase the contaminant concentration inside bauxite deposits. The bauxite deposit can be viewed as a vast reservoir for the sequestration of diverse heavy metals. The exploitation of the bauxite resource can generate pollutants to the surface of the land. The diverse nature of pollutants creates a significant impact on land quality. After bauxite mining, bare land is consumed by adsorptiondesorption processes of heavy metals (Tan, 1989) [78] . The adsorption-desorption processes govern the chemical properties that regulate the accumulation and clearance of heavy metals, respectively (Eddleman, 2012; Sposito, 2020) [31, 76] , affecting heavy metal concentration, soil pH, organic matter and oxides (Rengel, 2015) [71] . Eddleman (2012) [31] and Hou et al. (2019) [40] assert that heavy metals pose a risk to living organisms, even when Codex standards are not exceeded. Post-bauxite mining in India (Ahmad et al., 2021; Gautam et al., 2016) [3,34] , Africa (Dabo, 2015) [23] , Guinea (Diallo et al., 2022) [28] , China (Sikdar et al., 2020) [74] and Malaysia (Kusin et al., 2018) [52] reported increases in heavy metals toxicity in food and drinking water. However, there are challenges in physicochemical characteristics, which vary from site to site connected to reclamation of the land for agriculture after bauxite mining. The pH of bauxite soil is a critical determinant in heavy metal adsorption-desorption. Heavy metal desorption escalates when pH falls below 5.5. The desorption and bioavailability of harmful heavy metals also increase at low soil pH (Ditzler, 2017; Liu et al., 2017; Muhammed, 2015) [29, 54, 59] . On the other hand, researchers assert that an increase in pH leads to an increase in heavy metal adsorption. Soil pH can also affect the adsorption of heavy metals due to its ability to generate surface charges on aluminium, manganese and iron oxides (Barrow & Hartemink, 2023; Rengel, 2015; Sposito, 2020) [13,71,76] . Researchers found that in Australian bauxite soil systems with high pH, there were marked increases in negative charge sites on soil surfaces, which helped to increase the adsorption of Zn, but this effect decreased in acidic conditions (Arjoon et al., 2013; Ditzler, 2017; Gnandi & Tobschall, 2002) [8,29,35] . Research on Zn adsorption under soil pH influences revealed that increased Zn adsorption levels were inversely correlated with soil pH (Rengel, 2015; Tessier et al., 1996; Wuana & Okieimen, 2011) [71,85,79,85], . The HM-Zn 2+ behavior is entirely opposed to the established principles of soil pH and heavy metal adsorption or desorption. This contrasts with Cu and Cd adsorption in soil, which correlates to pH levels, preferential inclusion, and coprecipitation (Gundlur & Manjunathaiah, 2000; Hooda, 2003; Tiller, 1989; Zhuang & Yu, 2002) [37,39,80,87] . Soil organic matter (OM) exerts a contradictory influence on soil heavy metals, with some research indicating that elevated levels of OM may have a positive or negative effect. Organic matter possesses reactive sites that function as weak acids, chelating heavy metals. However, OM sorption was found for Zn, Pb, Al, and Cu in strong acidic conditions (Alloway, 2008; Brown Jr & Parks, 2001; Elnajdi et al., 2023; Gundlur & Manjunathaiah, 2000; Jansen, 2003) [5, 18, 32, 37, 47] . In tropical conditions, OM decomposition by oxidation can also liberate Al and Fe (Adiaha, 2017; Alloway, 2008; Jansen, 2003; Mateus et al., 2017) [1,5,47,57] . The incorporation of organic compost increased OM levels and reduced soil pH post-bauxite mining, according to studies by Prematuri et al. (2020) [67] , Vonk et al. (2020) [84] , Di Carlo et al. (2019) [26] , and Paul et al. (1997) [66] . Chicken litter augments soil organic matter (OM), hence enhancing HM complexation, moisture retention, HMs chelation, and soil fertility owing to its negative charges (BárDoSSy & Aleva, 1990; Brown Jr & Parks, 2001; Muhammed, 2015) [11, 18, 59] . Oxides are superior in the adsorption-desorption of heavy metals. Adsorption of Cr and Pb on Al oxides is more related to smaller hydrated ionic size and the presence of H + ability to neutralise negative surface charges that easily adsorb by Al in a soil (Avudainayagam et al., 2003; Violante et al., 2003) [8,83] . Aluminium has strong sorption affinity for oxygen-reactive anions and cations at the soil interface. Chromium binds effectively to oxygen due to analogous synergies and cooperation with Al (Krstic et al., 2012; Sposito, 2020; Zhang et al., 2008) [51,76,86] . In contrast, Cr desorption increases from pH 3 to 7, with no fluctuation at 7 (Aftab, 2022) [2] . Edible food plants include spinach (Spinacia oleracea) (Fam. Amaranthaceae), coconut Cocos nucifera L. (Fam. Arecaceae), celery (Apium graveolens L.), (Fam. Apiaceae), cassava (Manihot esculenta Crantz.), pak choi (Brassica rapa var. chinensis L.), (Fam. Brassicaceae), and tomato (Lycopersicon esculentum Mill.), (Fam. Solanaceae), which are extensively utilised for their nutritional content and sources of food. Food plants possess many mechanisms to manage HMs and the bioaccumulation of HMs in the edible portion of plants (Antonious & Snyder, 2007; Eddleman, 2012) [7,31] . Mahurpawar (2015) [55] and Deepali (2009) [25] report that leafy greens uptake metals ranging from 0.01 to 1300 mg kg -1 . Other researchers found that during a thirtyyear span, coconut ecotypes developed exclusion and tolerance mechanisms to prevent HMs bioaccumulation. Reclaimed bauxite soils are expected to include elevated concentrations of heavy metals (HMs) such as aluminum (Al), chromium (Cr), copper (Cu), cadmium (Cd), manganese (Mn), lead (Pb), and zinc (Zn) due to the breakdown of some of the minerals connected to bauxite deposits. The levels of these heavy metals in the reclaimed bauxite soils and their bioaccumulation in these crops cultivated in these soils have not been previously assessed. The purpose of this research is to fill this knowledge gap by analysing HMs levels in four communities engaged in crop production on reclaimed bauxite soil. Additionally, the study will also examine the presence of these HMs in six major crops grown in these regions.
Materials and Methods
This study was conducted at Three Friends (5.985352,-58.311274) and Coomacka (5.987821,-58.290713) in the white sand plateau and older peneplains to West Watooka (5.905325,-58.311324) and Hubu (6.822502,-58.457471) along the coastal plain. A total of 51 samples (determined using student reiteration T-test) were taken from four different treatment districts using a stratified random sampling method. There were 27 soil samples, 3 of which were background soil samples of the three mined-out locations, 24 soil samples and 24 plant edible samples (4 of which were coconut water samples). Samples were paired from plants and soil to soil alone. Samples of soil from coconut palms were collected in composites around the plants. To achieve homogeneity, samples were gathered in a zigzag manner as described in (Angelova et al., 2004; Carter & Gregorich, 2007; 2020) [6,19] . Approximately 500 grams of soil were collected from under plant roots for each representative sample. Soil composite was extracted from each location using a soil auger whose dimension comprises of 15 cm bucket depth and 10 cm diameter with 100 cm handle length. The 500 grams were weighed, labeled, and transported every day before being gently dried from 40 o C, 60 o C and 80 o C gradually for two days. Samples of edible plants were gathered at the precise location, and soil samples were obtained for each of the 24 sites. For each plant species representing the study districts (1500 grams of fresh weight) were collected for each species.
pH determination
Ground soil samples were weighed to a weight of 2.0 grams on a gravimetric scale. Then, 2.0 mls of distilled water were added to each beaker (100 ml) and vortexed (w/v). To dissolve any salt in the soil, the mixture was mixed and set aside for 10 minutes. After ten minutes, the material was vortexed once more, and the electrode was inserted for reading. The 2-point meter from Thermo Scientific, Waltham, MA, was calibrated for buffers 4.0 and 7.0. At the end of each sampling, the electrode was rinsed with distilled water and blotted dry. Activation Laboratory (Code 4F) in Canada gave readings from buffer 4.0.
OM determination
The Activation Laboratory's method of determining soil organic matter content (%) of soil involved using the loss on ignition method (Code 13). The organic matter is combusted at 550 o C for 4 hours to remove organic and inorganic matter and at 1000 o C for further 2 hours to remove carbonates and calculating the OM loss as described (Carter & Gregorich, 2007; Heiri et al., 2001) [19,38] .
Background concentration analysis
Aqua regia reagents are used to digest 0.5 g of material for two hours at 95 °C. After letting the sample cool, deionized water is added to dilute it. After that, a Varian ICP for the 10-element suite (50% Aqua Regia-ICP-OES AQUAGEO) (Code-1E) is used to analyze the samples.
Soil analysis
Approximately 500 grams of soil were collected from under plants root for each representative sample. The soil auger (described in 3.2) was used to obtain composite soil samples from each site to obtain 500 grams of soil, which were placed in labelled bags and gently oven dried for two days. The sampled were then repackaged and shipped to Activation Laboratory for analysis. Digested samples are diluted by the UT4 Code described and analyzed by Perkin Elmer Sciex ELAN 9000 ICP/MS-OES by Activation laboratory package in Canada (Multi-Acid (4-Acid) Digestion).
Green coconut water analysis
Hydro-chemistry determination. Prior to water coconut analysis for heavy metals, samples were systematically collected from four locations in triplicates. Samples were collected in triplicates, stored in a cooler, and placed in vessels shipped cool to Activation Laboratories in Canada. All the samples have been analyzed for major HMs, using the standard method prescribed by Code 6 MB by Activation laboratory package.
Plant analysis
Samples of vegetable plants were gathered at each soil sampling location for each of the 24 sites. For each plant species representing the study districts (1500 grams of fresh weight) were collected for each species. Plants were uprooted from the soil, washed with distilled water to remove foreign materials that allowed to air-dry. These were then placed in large Ziploc bags and labelled for each site.
Coconuts were taken in triplicates and stored in an ice cooler. At the laboratory, the plant samples were further cleaned and placed in paper wraps (non-aluminum) for dehydration gradually at 40, 60 and 80 degrees Celsius for 24-48 hours. Before being shipped to Activation Laboratories in Canada, plant samples were pulverized using a mortar and pestle, put in sample bags, and weighed. In Canada, each samples were analyzed according to Vegetable Ash Package Digestion, ICP-MS, Code 2D (Eddleman, 2012) [31] . Results for 59 elements were included in all plant-related reports from ACT Labs (Eddleman, 2012) [31] .
Geo-accumulation Index
The geochemical index (Igeo) is a commonly utilised metric for evaluating the presence and concentration of anthropogenic contaminants on the soil surface (Table 1). This index measure quantitatively determines soil contamination levels based on the actual bioavailable percentage (baseline value). This fraction is derived via the application of Muller (Nowrouzi & Pourkhabbaz, 2014) [62] . Consequently, assessing the extent of metal pollution in agricultural areas impacted by industrial activities is crucial. [62] Geochemical index (Igeo) was originally stated by Muller (1969) (Nowrouzi & Pourkhabbaz, 2014) [62] . In order to determine and define metal contamination in sediments by comparing current concentrations with preindustrial levels, Igeo is calculated as follows. 1Where Bn is the background value for the metal n, Cn is the measured concentration of the metal n in the soil, and the factor 1.5 is used to account for any fluctuations in the background data caused by lithological variances. The global average shale data is frequently used to construct the quantity Igeo (Obaje et al., 2019) [63] . Since the Igeo index was developed for this study this background data was used.
| Geo-accumulation Index | — | — |
|---|---|---|
| Class | Value | Classification |
| 0 | < 0 | Uncontaminated |
| 1 | 0-1 | Uncontaminated to moderately contaminated |
| 2 | 1-2 | Moderately contaminated |
| 3 | 2-3 | Moderately to strongly contaminated |
| 4 | 3-4 | Strongly contaminated |
| 5 | 4-5 | Strongly to extremely strongly contaminated |
| 6 | > 5 | Extremely contaminated |
Table text extracted from the original PDF; superscript letters are shown inline. The original table image is below.
View original table image
Igeo=log2 [Cn/1.5Bn] Equation
Igeo=log2 [Cn/1.5Bn] Equation
Bioaccumulation factor
The formula got bioaccumulation-a simple bioconcentration factor (BCF) model, sometimes referred to as bioaccumulation factor (BAF), (Nepal et al., 2024) [61] assesses the metal content of plants based on the total metal concentration measured in the soil:
Where, [M]p=Total metal concentration in plant (mg kg -1 ) [M]s=Total metal concentration in soil (mg kg -1 ) BAFsp=bio-concentration factor from soil to plant, being the ratio of metal concentration in plant to total metal concentration in soil (Eddleman, 2012; Gobas, 2001) [31] .
Quality Control
For verification purposes and to achieve a high accuracy and precision, a reagent blank sample as well as standard reference soil and vegetable samples (OREAS 45d, OREAS 45 d (Aqua Regia Cert) Cert for Geochemical Background Soil, OREAS Cert, Coal Ash Std-2, Coal Ash Std-2 Cert, IV-Stock 1643 (ICP/MS) Meas, IV-Stock 1643 (ICP/MS) Cert., GXR-4 Meas, GXR-4 Cert., SDC-1 Meas, SDC-1 Cert.) were included in the digestion procedure. Plant and soil were first analysed for selected heavy metals according to standard optimum conditions of each metal. All chemicals and reagents used in the experiments were of analytical grade and purchased from Merck (Darmstadt, Germany). All glassware used for digestion and preservation of the digested samples were washed with a solution of 10% of nitric acid followed by washing with double deionized water. An average value of duplicates was used to support the interpretation of findings. For digested soil samples are diluted and analyzed by Perkin Elmer Sciex ELAN 9000 ICP/MS. One blank is run for every 40 samples. In-house control is run every 20 samples. Digested standards are run every 80 samples. After every 15 samples, a digestion duplicate is analyzed. Instrument is recalibrated every 80 samples. For background soil analysis QC for the digestion is 15% for each batch, 2 method reagent blanks, 6 in-house controls, 8 sample duplicates and 5 certified reference materials. An additional 20% QC is performed as part of the instrumental analysis to ensure quality in the areas of instrumental drift. For ash package a matrix blank and digested blank are each run every 35 samples. Two digested standards are run every 35 samples. Instrument is recalibrated every 70 samples. Duplicates are digested and analysed every 14 samples.
Statistical analysis
The data collected was entered into the statistical software program SPSS 20 (International Business Machines Corporation, Armonk, NY, USA) in the analysis of the data. One-way analysis of variance (one-way ANOVA) was utilized to determine statistical significance at p<0.05. To determine significant differences between treatments Duncan's multiple range post hoc test was employed at p<0.05. Correlation between soil physical characteristics such as pH and OM with HMs concentrations in plant tissue (BAF) and HMs concentrations in the soil were conducted using a Pearson's correlation analysis.
Results
Results
On soil pH
Table 2, Figure 1 demonstrates that there is no statistically significant difference (P=0.835, by ANOVA) in mean pH values among treatment/district means. Bauxite mining does not affect soil pH. The finding corresponds with previous studies undertaken in Romania (Oneț et al., 2022) [65] and Indonesia (Ricksy, 2021) [72] post bauxite mining sites. On organic matter Table 3 and Figure 2 Mean percent OM content is similar among treatment means (P=0.788) (Table 5). This would indicate that bauxite mining does not have significant effect on OM content in soil. Similar studies on post bauxite mining soil in Romania (Oneț et al., 2022) [65] and Brazil at various depths (Barros et al., 2013) [12] have been cited. 4 shows the one-way ANOVA results show no significant difference in the treatment means (p > 0.05) of Al, Cd, Cu, Mn, and Cr in bauxite soil. The one-way ANOVA analysis in (Table 4, Figure 3) showed that the mean Pb concentration was significantly different among treatment means (F ratio=9.28, p<0.05). Figure 4 shows that the concentration of total Lead (Pb) was below FAO/WHO limits of 50 mg kg -1 in soil. These values were observed to be below the CAC limit (Joint FAO/WHO Codex Alimentarius Commission, 2017), (i.e., 50 mg Pb kg -1 ) for all soil samples towards human health safety (Alloway, 1995) [4] . The one-way ANOVA analysis in (Table 4) also shows that the mean Zinc (Zn) concentration was significantly different among treatment means (F ratio=4.08, P=0.020). However, in this study District 4=District 2.
| Parameters/ Regions | Post-mined regions | — | — | Unmined region |
|---|---|---|---|---|
| West Watooka | Coomacka | Three Friends | Hubu | |
| pH * OM | -0.132 | -0.963** | 0.885* | -0.451 |
Table text extracted from the original PDF; superscript letters are shown inline. The original table image is below.
View original table image
| Leachate | Measurement | Certified Standards | % Recovery |
|---|---|---|---|
| Cd | 0.4 | 0.42 | 95.2 |
| Al% | 7.4 | 7.29 | 101.5 |
| Cr | 71 | 71 | 100.0 |
| Mn | 954 | 950 | 100.4 |
| Zn | 330 | 345 | 95.6 |
| Pb | 87.3 | 83 | 105.3 |
| Cu | 4210 | 4230 | 99.5 |
Table text extracted from the original PDF; superscript letters are shown inline. The original table image is below.
View original table image
| Treatments | Mean ± Std. Error | — | — | — | — | — | — |
|---|---|---|---|---|---|---|---|
| Total Al | Total Cr | Total Cd | Total Cu | Total Mn | Total Pb | Total Zn | |
| District 1 | 40550±3854 | 37.5±4.3 | 0.1±0.00 | 21.1±5.7 | 171.3±28.1 | 13.0±1.3 | 37.9±8.5 |
| District 2 | 55400±9098 | 37.0±3.3 | BDL | 30.5±10.3 | 108.1±12.3 | 15.5±1.7 | 59.1±9.0 |
| District 3 | 37583±10571 | 34.1±6.7 | BDL | 11.1±4.1 | 107.5±27.2 | 12.1±2.9 | 31.4±12.4 |
| District 4 | 67350±9996 | 35.8±3.1 | 0.25±0.05 | 16.7±2.4 | 144.3±17.0 | 27±2.6 | 102.9±26.6 |
| p-values | 0.091ns | 0.957ns | 0.091ns | 0.211ns | 0.133ns | 0.000* | 0.020* |
Table text extracted from the original PDF; superscript letters are shown inline. The original table image is below.
View original table image
| Region | Mean ± S.E | Range |
|---|---|---|
| District 1 | 7.5±1.3 | 1.1-10.46 |
| District 2 | 10.18±1.1 | 7.3-13.24 |
| District 3 | 11.05±4.6 | 1.56-30.31 |
| District 4 (Control) | 9.7±0.8 | 7.61-12.06 |
| p-value | 0.788 | - |
Table text extracted from the original PDF; superscript letters are shown inline. The original table image is below.
View original table image
| Region | Mean±S. E | Range |
|---|---|---|
| District 1 | 5.73±0.2 | 4.63-6.62 |
| District 2 | 5.68±0.5 | 4.36-7.26 |
| District 3 | 6.4±1.1 | 4.62-11.8 |
| District 4 (Control) | 5.8±0.5 | 4.29-7.18 |
| P-Value | 0.835 | - |
Table text extracted from the original PDF; superscript letters are shown inline. The original table image is below.
View original table image
Figure 5 shows that the concentration of total Zn in soil was below FAO/WHO limits of 10-300 mg kg -1 in soil. These discoveries shed new insights into mining, particularly bauxite mining. A previous study (Dwirama Putra et al., 2018) [30] found contrastingly that mining was the main contributor to elevated Pb levels in the environment. The raw data obtained from the laboratory presented aluminum concentration in percentage, which was mainly due to values exceeding the upper limit of ICP-MS.
Pearson correlation output
Pearson correlation output
Background concentration
Background concentration results for the three mined-out study districts are presented in Table 6. This is the first data from Guyana. Similar, research has been conducted in countries like the USA, Belgium, India, Poland, Scotland, and Spain (Albright, 2004). Often, countries resort to shale values as a substitute for background values when calculating pollution indices, however, this practices is not ideal. The numbers obtained helped calculation of pollution index. It could make the best determining estimate of heavy metals sources from mining, anthropogenic, and environmental influences in soils as a whole.
| — | pH | OM | Al | Cd | Cu | Cr | Mn | Pb | Zn |
|---|---|---|---|---|---|---|---|---|---|
| pH | 1 | ||||||||
| OM | -0.132 | ||||||||
| Al | -0.670 | 0.582 | |||||||
| Cd | . a | . a | . a | ||||||
| Cu | 0.695 | 0.387 | -0.306 | . a | |||||
| Cr | -0.727 | 0.018 | 0.722 | . a | -0.774 | ||||
| Mn | 0.485 | 0.526 | 0.036 | . a | 0.821* | -0.304 | |||
| Pb | -0.601 | 0.750 | 0.963** | . a | -.156 | 0.634 | .215 | ||
| Zn | 0.438 | 0.674 | 0.037 | . a | 0.930** | -0.586 | 0.828* | 0.196 |
Table text extracted from the original PDF; superscript letters are shown inline. The original table image is below.
View original table image
Geo-accumulation Index
Results of the Igeo obtained for soil samples were calculated for the mined-out district and those values obtained from background concentration for specific mined-out treatment districts (Table 11). The Igeo, created by Muller, was used to assess field contamination by HMs. Using the average amount of Igeo for all HMs, the total assessment of HM contamination was performed for all the samples collected, allowing pollution to be identified for all HMs other than Al, for which no background value has been determined (Table 10).
| Districts | Al | Cd | Cr | Cu | Mn | Pb | Zn |
|---|---|---|---|---|---|---|---|
| D1 | - | Class 1 | Class 2 | Class 2 | Class 3 | Class 1 | Class 2 |
| D2 | - | Class 1 | Class 1 | Class 4 | Class 3 | Class 2 | Class 4 |
| D3 | - | Class 1 | Class 1 | Class 1 | Class 1 | Class 1 | Class 1 |
Table text extracted from the original PDF; superscript letters are shown inline. The original table image is below.
View original table image
| Metals/Leachate | Measurement | Certified Standards | % Recovery |
|---|---|---|---|
| Mn | 483 | 490 | 98.5 |
| Zn | 41 | 45.7 | 89.7 |
| Pb | 87.4 | 83 | 105.3 |
| Cu | 435 | 403 | 108.7 |
Table text extracted from the original PDF; superscript letters are shown inline. The original table image is below.
View original table image
| Locations | Coordinates | Heavy metals (mg kg-1) | — | — | — | — | — | — |
|---|---|---|---|---|---|---|---|---|
| Al | Cd | Cu | Cr | Mn | Pb | Zn | ||
| District 1 | 5.908325 -58.311324 | ND | BDL | 5 | ND | 21 | 5 | 12 |
| District 2 | 5.987821 -58.290713 | ND | BDL | 1 | ND | 13 | 3 | 5 |
| District 3 | 5.925471 -58.306338 | ND | BDL | 3 | ND | 36 | 5 | 8 |
| Low Detection Limit (mg kg-1) | NA | 0.5 | 1 | NA | 2 | 2 | 1 | |
| Upper Detection Limit (mg kg-1) | NA | 2000 | 10000 | NA | 100000 | 5000 | 10000 |
Table text extracted from the original PDF; superscript letters are shown inline. The original table image is below.
View original table image
Heavy metal uptake by food plants Leafy greens
Table 12 indicates that leafy vegetables are efficient accumulators of heavy metals. These levels obtain can pose serious health risk to consumers.
| Treatment | Genotype | Al | Cd | Cu | Cr | Mn | Pb | Zn |
|---|---|---|---|---|---|---|---|---|
| District 1 | Pak choy | 3170.0 | 2.4 | 125.0 | 95.0 | 1460.0 | 18.8 | 1020.0 |
| District 2 | 1670.0 | 0.3 | 36.4 | BDL | 106.0 | 14.5 | 327.0 | |
| District 3 | 2780.0 | 0.6 | 51.3 | 7.0 | 401.0 | 8.8 | 601.0 | |
| District 4 | 2990.0 | 0.3 | 56.4 | BDL | 670.0 | 25.3 | 813.0 | |
| District 1 | Spinach | 1610.0 | 1.6 | 63.1 | BDL | 1230.0 | 8.1 | 533.0 |
| District 2 | 1930.0 | 0.2 | 41.1 | BDL | 72.6 | 5.4 | 304.0 | |
| District 3 | 1490.0 | 0.2 | 27.8 | BDL | 502.0 | 7.5 | 173.0 | |
| District 4 | 1720.0 | 0.7 | 38.6 | BDL | 108.0 | 10.2 | 693.0 | |
| District 1 | Celery | 2400.0 | 5.5 | 4540.0 | BDL | 1020.0 | 7.40 | 730.0 |
| District 2 | ND | ND | ND | ND | ND | ND | ND | |
| District 3 | 3140.0 | 0.2 | 42.3 | 7.0 | 266.0 | 38.40 | 456.0 | |
| District 4 | 1010.0 | 1.2 | 29.9 | BDL | 97.4 | 9.3 | 540.0 | |
| CAC Limits (mg kg-1) | NA | 0.2 | 40.0 | 2.3 | 6.7 | 0.3 | 60.0 |
Table text extracted from the original PDF; superscript letters are shown inline. The original table image is below.
View original table image
NA-Not available
NA-Not available
Green coconut fluid
Table 13 indicates that green coconut fluid contains heavy metals at levels below the Joint FAO/WHO Codex requirements for drinking water quality. Except for manganese, which exceeds allowed amounts, manganese is an important microelement for the human body. Consequently, it seems to exist in a water-soluble form, facilitating its absorption.
| Leachate | Measurement | Certified Standards | % Recovery |
|---|---|---|---|
| Cd | 6.19 | 7.0 | 88.4 |
| Al | 8080 | 8000 | 101.0 |
| Cr | 39.4 | 38 | 103.6 |
| Mn | 20.3 | 20 | 101.5 |
| Zn | 22.7 | 23 | 98.6 |
| Pb | 19.2 | 20 | 96.0 |
| Cu | 61.1 | 62 | 98.5 |
Table text extracted from the original PDF; superscript letters are shown inline. The original table image is below.
View original table image
| Treatment | Al | Cd | Cu | Cr | Mn | Pb | Zn |
|---|---|---|---|---|---|---|---|
| District 1 | 0.051 | 0.001 | 0.004 | BDL | 2.293 | 0.001 | 0.342 |
| District 2 | 0.017 | 0.000 | 0.012 | BDL | 6.997 | 0.001 | 0.453 |
| District 3 | 0.046 | 0.001 | BDL | BDL | 9.330 | 0.004 | 0.388 |
| District 4 | 0.026 | 0.001 | BDL | BDL | 8.358 | 0.002 | 0.166 |
| CAC Critical Limit (mg kg-1) | 0.500 | 0.003 | 1.00 | 0.05 | 0.05 | 0.010 | 3.000 |
Table text extracted from the original PDF; superscript letters are shown inline. The original table image is below.
View original table image
Cassava tuber
Table 15 indicates that cassava tuber can effectively accumulate high levels, comparable to leafy greens and tomatoes, of heavy metals in their proliferous layer. These levels far exceed Codex acceptable standards. 0.00 * 0.00 0.00 0.01 0.00 0.01 District 2 0.00 * 0.00 0.00 0.05 0.00 0.01 District 3 0.00 * 0.00 0.00 0.07 0.00 0.01 District 4 (Control) 0.00 * 0.00 0.00 0.07 0.00 0.00
| Treatment | Al | Cd | Cu | Cr | Mn | Pb | Zn |
|---|---|---|---|---|---|---|---|
| District 1 | 4340 | 0.12 | 49.40 | 11 | 156 | 15.40 | 459 |
| District 2 | 20500 | 1.08 | 95.50 | 98 | 190 | 25.40 | 968 |
| District 3 | 21900 | 0.07 | 67.40 | 44 | 549 | 59 | 545 |
| District 4 (Control) | 10300 | 0.34 | 64.60 | 29 | 560 | 23.60 | 662 |
| CAC Critical Limit (mg kg-1) | NA | 0.1 | 20 | 2.3 | NR | 0.1 | 50 |
Table text extracted from the original PDF; superscript letters are shown inline. The original table image is below.
View original table image
Tomato BAF
Tomato BAF
Discussion
Discussion
Soil physicochemical variables of bauxite soil of Guyana Soil pH
The degree to which total heavy metals become available to their biological target is called bioavailability. Despite the absence of major alteration in soil pH, it is important to acknowledge that solubility and desorption of heavy metals are anticipated owing to the predominance of aluminum and iron oxides. Both one-way ANOVA and raw data are provided for clarification of the results. According to Hu et al. (2020) [42] , mining often influences soil disturbances, leading to a noticeable increase in soil pH. The illustration in Figure 1 indicates soil pH variability across different sites. Soil samples had a pH range of 4.29 to 7.26 in water. They are classified as very acidic to alkaline (Ditzler, 2017) [29] . An anomaly at site D3S2 (Three Friends) indicates a pH value of 11.8, classified as ultra-alkaline. These variations are often linked to mineralogy, which is affected by the chemical properties of the soil (Hu et al., 2017) [41] . As a result, the CEC is expected to be above primary levels, mostly due to contributions from exchangeable cations. Similarity has been documented (Zhuang et al., 2009) [86] . According to (Townsend, 1970) [81] and (Tan, 1989) [78] , adsorbates like kaolinite (Al and Si oxides) and the subsequent neutralisation of the exchange sites for sesquioxides account for low CEC. This enables cations, in acidic condition, to substitute and fill vacant sites, potentially reducing permanent CEC. Al may discretely introduce pH-dependent charged sites that displace cations and encourage CEC. These charged sites are introduced by aluminium oxides. H + , Al (OH) 2+ and Al 3+ that predominate the CEC complex under acidic conditions. This study substantiates the hypothesis that the increased presence of heavy metal complexes comes from a greater prevalence of oxide-rich mineralogy. The highest pH value (pH 11.8) in sample D3S2 obtained from the Three Friends shows that the soil pH is alkaline. The mining operation at Three Friends was recorded in 1917 (BárDoSSy & Aleva, 1990; Bishopp et al., 1955) [11,16] . pH values above 6.9 (Coomacka-D2S2; Hubu-D4S2; D4S5), signify that the bauxite soils exhibit surface adsorption and Al precipitation as Al (OH)4 -attributed to different amounts of calcium oxide (CaCO3), lacking below pH 7.0. Confirmed the presence of trace amounts of calcite (lime) in bauxite soil of Guyana. It lends itself to believing, reasonably so, to have contributed to the high soil pH. This site may possess substantial amounts of base cations, as the pH value of 11.8 markedly exceeds that of any other lateritic soils previously reported in India (Ghosh, 2019; Chairidchai & Ritchie, 1990) [, 20] , Taiwan (Ko, 2014), the USA (Hu et al., 2020) [42] , Indonesia (Ricksy, 2021) [72] and Australia (Gnandi & Tobschall, 2022) [35] . These data demonstrate that the bauxite soil exhibits a frightening and inclusionary influence of HMs over a wide range of soil pH.
Soil Organic matter (OM)
Table 3 demonstrates that the average% organic matter content is similar among treatment means (P=0.788). This result suggests that bauxite mining does not significantly affect OM content in soil. Comparable studies on post bauxite mining soil in Romania (Oneț et al., 2022) [65] and Brazil at various depths (Barros et al., 2013) [12] have been referenced. The OM content of the studied districts did not significantly change following bauxite mining. This information indicates that the soil is evolving under the influence of microbial activities that favor the improvement in soil fertility. Numerous studies on bauxite soil focused on variables like C: N ratio, C-organic and CEC where low CEC were linked to low organic carbon levels (Sulakhudin et al., 2023) [77] . They recognized that organic matter is the factor that contributes to cation exchange capacity and organic carbon. The conclusions of (Barros et al., 2013) [12] differ as they delineated the physical and chemical changes from mined lands to natural lands that may potentially augment microbial activity post-mining. Moreover, Li et al. (2018) [53] explained that these changes improved soil structure due to triggers from microbial activity that release chemicals. In addition, OM serves as a source of soil charge derived from OM-functional groups (Borggaard et al., 2019; Jansen, 2003; Marques et al., 2019) [17,47,56] . The specified values indicate that OM levels at or below 5% are classified as deficient, while values above 18% are excessive relative to the present study (Vonk et al., 2020) [84] . The data obtained also suggests that OM is aligned in order to the movement of soil pH. That is, as percent OM increases, soil pH increases. Comparable results (Cotter & Mishra, 1968) [22] in Australian lateritic soil indicated that the improvement of soil pH was attributed to the incorporation of organic matter. The highest value of 30.31% was obtained at the identical site (D3S2) where pH was 11.8. The most desirable outcome would be to have this localized high percentage of OM discovered distributed to all sites that show a considerably deficient amount. The link between high OM content and soil pH change can govern the amount of OM as well as the presence of important plant components and their metabolic byproducts. The finding of this research is supported by (Cotter & Mishra, 1968) [22] in that the alkaline nature of plant materials (OM) results from the dissociation of organic acids as well as the release of H + ions from OM are linked to soil pH. According to (Marques et al., 2019) [56] plant roots can provide 10% OM, whereas soil flora and fauna can offer 5% organic matter. Considering this development, it is abundantly evident that the soil's CEC/OM has a close connection to the pH of the bauxite soil. Similarly, in Nigeria, a decrease in CEC and pH was observed following OM removal from lateritic soil (Diagboya et al., 2015; Oluwatosin et al., 2009) [27,64] . Soil OM is important to the bauxite soil in many ways (BárDoSSy & Aleva, 1990; Diagboya et al., 2015; Jaikaran et al., 2017; Jansen, 2003) [11,27,46,47] . Low values (1.34%) have been reported in the Brazilian bauxite soil (Marques et al., 2019) [56] . These values are crucial because soil OM has a greater involvement in various processes that occur between soil OM and HMs. Likewise, (Brown Jr & Parks, 2001; Oluwatosin et al., 2009; Tsado et al., 2012) [18,64,82] it has been reported that soil organic matter is connected to HMs adsorption. In the Brazilian bauxite soil, OM is connected to carboxylic compounds of HA, FA, and CEC (Bajraktari et al., 2020; Marques, 2019) [10,56] . The process of ligand exchange, which can compete with HMs, makes it possible for soluble OMs to be adsorbed to bauxite soil. This process is explicitly carried out when soluble OM reacts with cations that become bound to the particle surface to form a soluble complex. The soil's surface would become more negatively charged as a result of OM absorption. This finding was also consistent with (Bajraktari et al., 2020; Chairidchai & Ritchie, 1990) [10,20] .
Heavy metal concentration in bauxite soil of Guyana Total Lead
The data on total lead indicates that the Pb concentration measured in District 4 is markedly greater than that in Districts 1-3, in terms of mean concentration. Bauxite mining considerably affects the concentration of lead in the bauxite soil of Guyana. The mean vales obtain shows that in the unmined region possessed higher concentration of Pb than those when compared to the mined-out regions eliciting novel perspective about bauxite mining impact. A previous research (Dwirama Putra et al., 2018) [30] identified mining as the primary contributor to increased Pb levels in the environment.
Total Zinc
The data on total Zn suggests that Zn levels at the control sites behave differently from those in the mined-out soil, due to the impact of bauxite mining and prolonged District 2 tailing discharge (District 2) that foremostly reaches the soil where crops are cultivated. The results also suggested that Zn 2+ was the most likely ionic form in the bauxite soil under both alkaline and acidic conditions, which is expected to contribute to the exchange capacity of the soil, which is a concerning dimension. The bauxite soil inherently has an argillic and tensile deformation nature, with vast variation in OM content, perhaps low clay content, and multiple sites that could support Zn desorption and adsorption to aluminium sesquioxide inner sphere hydroxyl group, which function as acid/base sites on large surface area facilitating zinc binding via ligand and surface complexation (Alloway, 2008; Hooda, 2003; Alina Kabata-Pendias & Pendias, 2001) [8, 39, 48] .
Pearson correlation of physicochemical parameters of the bauxite soil of Guyana
In the case of West Watooka, the solubility of heavy metals is contingent on OM constituents. Ligands and aminopolycarboxylic acids might enhance the extractability of heavy metals within pH 4-7 because of the magnitude of functional organic groups associated with weakened van der Waals forces, π-π, CH-π, and hydrogen forces, rendering them susceptible to adsorption-desorption processes. This property is derived from 1:1 clays like kaolinite that disperse to provide negative charges to particles. At pH > 7, both HA and FA acids are likely to attain dispersion from substitution by phenolic and carboxylic acids. Additionally, in Coomacka, soil pH affects heavy metal desorption in contaminated soil. This is offset by top-soil mixing, which contributes to a drop in soil pH. Even so, heavy metals are present in a range of valency states that can contribute to net H + ions elevating acidity. The bottom line is that an inverse significant relationship (p<0.01) between pH and OM% contradicts the basic theory about OM accumulation primarily at the topsoil level. Acquiring a greater understanding of the physico-chemical properties of postmining bauxite lands is essential for assessing the agricultural viability of the bauxite soil. The study's most ed result (Three Friends), with an r-value of 0.885 (p<0.05), indicates a positive and substantial association between soil pH and OM. Out of all the treatment districts, this one has the highest mean pH at 6.4±1.1 and OM at 11.05±4.6. The value of 11.05% to attain pH and OM correlation is strikingly incipient towards realistic connections for soil quality criteria that are cautious, based on the lower value. The study elicit a novel perspective derived from the accumulation of all sources which gives contextual understanding between total and the 50% aqua regia digestion in the background study. Accordingly, Three Friends mining occurred in 1917, marking a century-old mined-out region. Low content of soil OM (Hubu, unmined) in frequently cultivated lands decreased due to reduction in total organic matter inputs; increases in mineralization rates from tillage of organic matter; influence of the wetting and drying cycles and increase in temperature at the topsoil level.
Heavy metal interaction produced by Pearson's
Heavy metal interaction produced by Pearson's
Correlation
Table 6 shows a positive significant (p<0.05; 0.01) correlation between Cu and Cr, Pb and Cr, Zn and Pb. Higher aluminium and OM tend to capture more lead. In Table 7 increases in soil pH appears to have a significant association with low OM and Pb in soil. Table 8 has a strong positive correlation with Al (0.866*); Pb (0.997*) and Cr (0.828*), suggesting close relationships, and that they increase together. Also, Mn (0.866*) and Zn (0.966*) levels tend to increase alongside Al levels pointing to similar behavior and co-occurrences. In Nepal Khadka et al. (2016) [61] found r value of 41.8% significant correlation between pH and Mn, which goes to show that soil pH and Mn-oxide progressively with OM controlled HMs, some of which are micronutrients, with superior positive r values between pH and OM. Table 9 shows that as pH decreases Al (-0.851*) levels increases, which is consistent with studies. Al, Zn (-0.985**) and Pb (-0.844*) tend to behave inversely. This expansive of data in the finding suggests cooccurrences, similar behavior of metals with the extent to which this complicates agriculture on the bauxite soil of Guyana. This complex nature demonstrates the role of pH and Al, Mn role in controlling the complex of the bauxite soil and also indicating that they tend to be present together.
| — | pH | OM | Al | Cd | Cu | Cr | Mn | Pb | Zn |
|---|---|---|---|---|---|---|---|---|---|
| pH | 1 | ||||||||
| OM | -0.451 | ||||||||
| Al | -0.851* | 0.743 | |||||||
| Cd | . b | . b | . b | ||||||
| Cu | 0.762 | 0.123 | -0.532 | . b | |||||
| Cr | -0.225 | 0.668 | 0.579 | . b | -0.053 | ||||
| Mn | 0.722 | -0.159 | -0.680 | . b | 0.817* | -0.058 | |||
| Pb | 0.613 | -0.750 | -0.844* | . b | 0.203 | -0.672 | 0.235 | ||
| Zn | 0.811 | -0.800 | -0.985** | . b | 0.409 | -0.555 | 0.584 | 0.895* |
Table text extracted from the original PDF; superscript letters are shown inline. The original table image is below.
View original table image
| — | pH | OM | Al | Cd | Cu | Cr | Mn | Pb | Zn |
|---|---|---|---|---|---|---|---|---|---|
| pH | 1 | ||||||||
| OM | 0.885* | ||||||||
| Al | -0.132 | 0.114 | |||||||
| Cd | . b | . b | . b | ||||||
| Cu | -0.093 | 0.222 | 0.866* | . b | |||||
| Cr | -0.162 | 0.065 | 0.997** | . b | 0.828* | ||||
| Mn | -0.433 | -0.302 | 0.880* | . b | 0.617 | 0.907* | |||
| Pb | -0.227 | -0.017 | 0.908* | . b | 0.859* | 0.894* | 0.866* | ||
| Zn | -0.113 | 0.188 | 0.966** | . b | 0.943** | 0.949** | 0.759 | 0.853* |
Table text extracted from the original PDF; superscript letters are shown inline. The original table image is below.
View original table image
| — | pH | OM | Al | Cd | Cu | Cr | Mn | Pb | Zn |
|---|---|---|---|---|---|---|---|---|---|
| pH | 1 | ||||||||
| OM | -0.963** | ||||||||
| Al | -0.255 | 0.300 | |||||||
| Cd | . b | . b | . b | ||||||
| Cu | -0.427 | 0.311 | 0.806 | . b | |||||
| Cr | -0.655 | 0.683 | 0.576 | . b | 0.470 | ||||
| Mn | -0.090 | -0.089 | -0.777 | . b | -0.279 | -0.505 | |||
| Pb | -0.889* | 0.757 | 0.299 | . b | 0.624 | 0.593 | 0.210 | ||
| Zn | 0.013 | -0.240 | -0.034 | . b | 0.392 | 0.188 | 0.300 | 0.294 |
Table text extracted from the original PDF; superscript letters are shown inline. The original table image is below.
View original table image
Heavy metal uptake by crop plants
The examination of edible food plants (11-15) and their bioaccumulation (16-21) concludes the research. Green leafy vegetables, tomatoes and cassava in human diets supply essential nutrients and enhance food and nutritional security. They respond to persistent demands for nutrition to shield the organ systems of the human body against chronic diseases. In people, chronic heavy metal illness resulting from uncontrolled consumption of contaminated food is linked to a diverse range of neurological, gastrointestinal, dermal and cardiovascular illnesses, including Parkinson's disease and Alzheimer's disease (Mahurpawar, 2015) [55] . The findings reported above are in line with the body of literature that demonstrated that exposure to high concentrations of heavy metals poses serious health hazards to people. Heavy metals such as aluminum (Al), chromium (Cr), cadmium (Cd), lead (Pb), zinc (Zn), copper (Cu), and manganese (Mn) can accumulate in humans and animals through contaminated water and food, leading to poisoning of organ systems. Chronic exposure to high levels of these metals may cause various health issues, including increased risk of cancer and organ failure, cardiovascular issues, fertility issues, gastrointestinal issues, anemia, respiratory and pulmonary issues, skin disease, displacement of Ca from bone and neurological dysfunction and early death. These metals tend to interfere with biological processes by disrupting enzyme activity and cellular functions (Oneț et al., 2022) [65] . As such, leafy greens and roots crops emanating from the farms on the bauxite soil present potential toxicities for consumers. The fluids from coconut palms consistently exhibited heavy metal levels below detection limits of ICP. This study consistently demonstrates the coconut crops may stabilize heavy metals via polyphenols, which play a role in blocking heavy metals and forming insoluble complexes that either include or exclude contaminants in food plants. These findings shed new perspective of heavy metals interactions, and the presence of Mn oxides with its role in the exchange complex. The studies by Di Carlo et al. (2019) [26] ; Liu et al. (2017) [54] suggested that aging mined-out lands is a beneficial tool for OM accumulation.
Conclusion
In summary, this study provides information on physicochemical factors and heavy metals concentration in the bauxite soil of Guyana. Bauxite mining also affects heavy metals in the soil. In addition, the study revealed that five out of the six food crops are effective bio-accumulators of heavy metals.
Acknowledgement
AcknowledgementI like to acknowledge M & M Investment and my family for their unwavering support during my studies.
Figures and tables from the paper
| Treatment | Al | Cd | Cu | Cr | Mn | Pb | Zn |
|---|---|---|---|---|---|---|---|
| District 1 | 332.0 | 0.33 | 58.70 | BDL | 124.00 | 12.60 | 242.00 |
| District 2 | 375.0 | 1.95 | 90.50 | BDL | 215.00 | 7.50 | 387.00 |
| District 3 | 1030.0 | 0.43 | 119.00 | BDL | 270.00 | 34.20 | 631.00 |
| District 4 | 277.0 | 0.27 | 55.60 | BDL | 132.00 | 6.50 | 221.00 |
| CAC Critical Limit (mg kg-1) | NA | 0.2 | 40 | 2.3 | 6.7 | 0.3 | 100 |
Table text extracted from the original PDF; superscript letters are shown inline. The original table image is below.
View original table image
| Treatment | Al | Cd | Cu | Cr | Mn | Pb | Zn |
|---|---|---|---|---|---|---|---|
| District 1 | 0.070 | 55.80 | 130.08 | 0.00 | 6.18 | 0.66 | 12.67 |
| District 2 | ND | ND | ND | ND | ND | ND | ND |
| District 3 | 0.039 | * | 1.64 | 0.11 | 1.50 | 1.95 | 5.30 |
| District 4 (Control) | 0.028 | 4.033 | 1.67 | 0.00 | 0.51 | 0.27 | 2.75 |
Table text extracted from the original PDF; superscript letters are shown inline. The original table image is below.
View original table image
| Treatment | Al | Cd | Cu | Cr | Mn | Pb | Zn |
|---|---|---|---|---|---|---|---|
| District 1 | 0.05 | * | 13.29 | 1.86 | 10.65 | 1.03 | 30.81 |
| District 2 | 0.04 | * | 1.26 | 0.00 | 0.78 | 1.13 | 3.97 |
| District 3 | 0.06 | * | 2.31 | 0.18 | 3.45 | 0.45 | 13.09 |
| District 4 (Control) | 0.04 | * | 2.31 | 0.00 | 3.40 | 1.27 | 11.53 |
Table text extracted from the original PDF; superscript letters are shown inline. The original table image is below.
View original table image
| Treatment | Al | Cd | Cu | Cr | Mn | Pb | Zn |
|---|---|---|---|---|---|---|---|
| District 1 | 0.00 | * | 0.00 | 0.00 | 0.01 | 0.00 | 0.01 |
| District 2 | 0.00 | * | 0.00 | 0.00 | 0.05 | 0.00 | 0.01 |
| District 3 | 0.00 | * | 0.00 | 0.00 | 0.07 | 0.00 | 0.01 |
| District 4 (Control) | 0.00 | * | 0.00 | 0.00 | 0.07 | 0.00 | 0.00 |
Table text extracted from the original PDF; superscript letters are shown inline. The original table image is below.
View original table image
| Treatment | Al | Cd | Cu` | Cr | Mn | Pb | Zn |
|---|---|---|---|---|---|---|---|
| District 1 | 0.03 | * | 3.44 | 0.00 | 6.15 | 0.54 | 14.29 |
| District 2 | 0.03 | * | 4.83 | 0.00 | 1.08 | 0.63 | 10.13 |
| District 3 | 0.08 | * | 5.67 | 0.00 | 17.01 | 1.19 | 19.22 |
| District 4 (Control) | 0.04 | 3.40 | 1.85 | 0.00 | 0.69 | 0.28 | 3.91 |
Table text extracted from the original PDF; superscript letters are shown inline. The original table image is below.
View original table image
| Treatment | Al | Cd | Cu | Cr | Mn | Pb | Zn |
|---|---|---|---|---|---|---|---|
| District 1 | 0.00 | 3.30 | 1.39 | 0.00 | 0.42 | 0.98 | 3.70 |
| District 2 | 0.00 | * | 1.13 | 0.00 | 2.65 | 0.37 | 6.10 |
| District 3 | 0.15 | * | 49.58 | 0.00 | 6.13 | 18.00 | 185.58 |
| District 4 (Control) | 0.00 | * | 3.15 | 0.00 | 1.12 | 0.26 | 3.68 |
Table text extracted from the original PDF; superscript letters are shown inline. The original table image is below.
View original table image
| Treatment | Al | Cd | Cu | Cr | Mn | Pb | Zn |
|---|---|---|---|---|---|---|---|
| District 1 | 0.13 | * | 5.95 | 0.27 | 1.62 | 1.73 | 58.84 |
| District 2 | 0.37 | * | 3.43 | 1.96 | 1.91 | 1.37 | 13.01 |
| District 3 | 0.53 | * | 11.62 | 1.15 | 3.49 | 3.88 | 24.43 |
| District 4 (Control) | 0.11 | * | 6.21 | 0.85 | 5.49 | 0.915 | 12.70 |
Table text extracted from the original PDF; superscript letters are shown inline. The original table image is below.
View original table image
References
86 in the original paper- Adiaha M. The role of organic matter in tropical soil productivity. World Scientific News. 2017;86(1):1-66.
- Aftab T. Sustainable management of environmental contaminants: Eco-friendly remediation approaches. Cham: Springer Nature; 2022.
- Ahmad W, Alharthy RD, Zubair M, Ahmed M, Hameed A, Rafique S. Toxic and heavy metals contamination assessment in soil and water to evaluate human health risk. Scientific Reports. 2021;11(1):17006.
- Alloway B. Soil processes and the behaviour of metals. In: Heavy metals in soils. Dordrecht: Springer; 1995, p. 3488.
- Alloway B. Zinc in soils and crop production. Paris: International Fertilizer Industry Association; 2008, p. 139.
- Angelova V, Ivanova R, Ivanov K. Heavy metal accumulation and distribution in oil crops. Communications in Soil Science and Plant Analysis. 2004;35(17-18):2551-2566.
- Antonious GF, Snyder JC. Accumulation of heavy metals in plants and potential phytoremediation of lead by potato, Solanum tuberosum L. Journal of Environmental Science and Health Part A. 2007;42(6):811-816.
- Arjoon A, Olaniran A, Pillay B. Co-contamination of water with chlorinated hydrocarbons and heavy metals: challenges and current bioremediation strategies. International Journal of Environmental Science and Technology. 2013;10:395-412.
- Avudainayagam S, Megharaj M, Owens G, Kookana RS, Chittleborough D, Naidu R. Chemistry of chromium in soils with emphasis on tannery waste sites. Reviews of Environmental Contamination and Toxicology; 2003, p. 53-91.
- Bajraktari D, Petrovska BB, Zeneli L, Dimitrovska A, Kavrakovski Z. Soil chemical evaluation and power plant ash impact on chemical properties of Salix alba L. (Fam. Salicaceae): The impact of bioaccumulation. Toxicology Research and Application. 2020;4:2397847320924849.
- Bárdossy G, Aleva G. Lateritic bauxites. Amsterdam: Elsevier; 1990. Developments in Economic Geology. Vol. 27, p. 1-311.
- Barros DA, Pereira JAA, Ferreira MM, Silva BM, Filho FD, Nascimento GO. Soil physical properties of high mountain fields under bauxite mining. Ciência e Agrotecnologia. 2013;37:419-426.
- Barrow N, Hartemink AE. The effects of pH on nutrient availability depend on both soils and plants. Plant and Soil. 2023;487(1):21-37.
- Benn DK, Nanlall S, Jines A, Eitzinger A. Assessing climate change impact on Guyana's crops using integrated crop and spatial modeling approaches; 2021.
- Beunk FF, de Roever EW, Yi K, Brouwer FM. Structural and tectonothermal evolution of the ultrahigh-temperature Bakhuis Granulite Belt, Guiana Shield, Surinam: Palaeoproterozoic to recent. Geoscience Frontiers. 2021;12(2):677-692.
- Bishopp DW, Winter E, Harrison SJB, Pollard ER, Barron CN. The bauxite resources of British Guiana and their development. Georgetown: Daily Chronicle; 1955.
- Borggaard OK, Holm PE, Strobel BW. Potential of dissolved organic matter (DOM) to extract As, Cd, Co, Cr, Cu, Ni, Pb and Zn from polluted soils: A review. Geoderma. 2019;343:235-246. DOI: 10.1016/j.geoderma.2019.02.041
- Brown Jr GE, Parks GA. Sorption of trace elements on mineral surfaces: Modern perspectives from spectroscopic studies, and comments on sorption in the marine environment. International Geology Review. 2001;43(11):963-1073.
- Carter MR, Gregorich EG. Soil sampling and methods of analysis. 2 nd Ed., Boca Raton: CRC Press; 2007.
- Chairidchai P, Ritchie G. Zinc adsorption by a lateritic soil in the presence of organic ligands. Soil Science Society of America Journal. 1990;54(5):1242-1248.
- Cleveland RP. Second report on the state of plant genetic resources for food and agriculture in Guyana. Agronomy Science; 2012.
- Cotter D, Mishra U. The role of organic matter in soil manganese equilibrium. Plant and Soil. 1968;29:439448.
- Dabo A. The impact of bauxite mining on the health of women and children in Sangaredi (Guinea-West Africa). Bloomington: Indiana University; 2015.
- Vries DW, Groenenberg JE, Lofts S, Tipping E, Posch M. Critical loads of heavy metals for soils. In: Heavy metals in soils: Trace metals and metalloids in soils and International Journal of Agriculture and Food Science https://www.agriculturaljournals.com their bioavailability. Dordrecht: Springer; 2013. p. 211237.
- Deepali GK. Chromium uptake efficiency of Spinacea olaracea from contaminated soil. Journal of Applied Sciences and Environmental Management. 2009;13(4).
- Di Carlo E, Chen C, Haynes R, Phillips I, Courtney R. Soil quality and vegetation performance indicators for sustainable rehabilitation of bauxite residue disposal areas: a review. Soil Research. 2019;57(5):419-446.
- Diagboya PN, Owolabi OBI, Adebowale KO. Effects of time, soil organic matter, and iron oxides on the relative retention and redistribution of lead, cadmium, and copper on soils. Environmental Science and Pollution Research. 2015;22:10331-10339.
- Diallo AM, Konaté AA, Oularé F, Zaheer M. Vulnerability of groundwater to pollution at the Dabiss bauxite mining area, Boké Prefecture, Republic of Guinea. Geology, Ecology, and Landscapes; 2022, p. 120.
- Ditzler G. USDA Handbook 18. Washington, DC: Government Printing Office; 2017.
- Putra DR, Apriadi T, Suryanti A, Irawan H, Raja'I ST, Yulianto T, et al. Preliminary study of heavy metal (Zn, Pb, Cr, As, Cu, Cd) contaminations on different soil levels from post-mining bauxite production for aquaculture. E3S Web of Conferences. 2018;47:02008. doi:10.1051/e3sconf/20184702008
- Eddleman K. Bioaccumulation of heavy metals from soils to plants in watersheds contaminated by acid mine drainage in SE Arizona [Dissertation]. Tucson (AZ): The University of Arizona; 2012.
- Elnajdi A, Berland A, Haeft J, Dowling C. Influence of soil pH, organic matter and clay content on environmentally available lead in soils: A case study in Muncie, Indiana, USA. Open Journal of Soil Science. 2023;13(10):414-430.
- Espinosa ERJ, David DL, Alleyne TS. Soil physical properties and textural map in Guyana. Tropical Agriculture. 2022;99(3):268-281.
- Gautam M, Pandey D, Agrawal S, Agrawal M. Metals from mining and metallurgical industries and their toxicological impacts on plants. In: Gupta DK, Sandalio LM, editors. Plant responses to xenobiotics. Berlin: Springer; 2016, p. 231-272.
- Gnandi K, Tobschall H. Heavy metals distribution of soils around mining sites of cadmium-rich marine sedimentary phosphorites of Kpogame and Hahotoe (Southern Togo). Environmental Geology. 2002;41(5):593-600.
- Government of Guyana. Guyana national land use plan. Georgetown: Guyana Lands and Surveys Commission; 2013.
- Gundlur S, Manjunathaiah H. Distribution and forms of copper fractions in red and lateritic soils of North Karnataka. Journal of the Indian Society of Soil Science. 2000;48(1):103-109.
- Heiri O, Lotter AF, Lemcke G. Loss on ignition as a method for estimating organic and carbonate content in sediments: reproducibility and comparability of results. Journal of Paleolimnology. 2001;25:101-110.
- Hooda P. A special issue on heavy metals in soils: editorial foreword. Advances in Environmental Research. 2003;8(1):1-3.
- Hou S, Zheng N, Tang L, Ji X, Li Y. Effect of soil pH and organic matter content on heavy metals availability in maize (Zea mays L.) rhizospheric soil of non-ferrous metals smelting area. Environmental Monitoring and Assessment. 2019;191:1-10.
- Hu B, Jia X, Hu J, Xu D, Xia F, Li Y. Assessment of heavy metal pollution and health risks in the soil-planthuman system in the Yangtze River Delta, China. International Journal of Environmental Research and Public Health. 2017;14(9):1042.
- Hu Y, Yu Z, Fang X, Zhang W, Liu J, Zhao F. Influence of mining and vegetation restoration on soil properties in the eastern margin of the Qinghai-Tibet Plateau. International Journal of Environmental Research and Public Health. 2020;17(12):4288.
- Hurst VJ, Pickering SM. Origin and classification of coastal plain kaolins, South Eastern USA, and the role of groundwater and microbial action. Clays and Clay Minerals. 1997;45(2):274-285.
- Inter-American Development Bank. Guyana and the IDB Group: Partnering for resilience. Washington (DC): IDB; 2024.
- Ifansyah H. Soil pH and solubility of aluminum, iron, and phosphorus in Ultisols: The roles of humic acid. Journal of Tropical Soils. 2014;18(3):203-208.
- Jaikaran S, Ansari AA, Seecharran D. Growth and bioremediation properties of oyster mushroom (Pleurotus ostreatus) using gold and bauxite mining soils in Guyana. Mushroom Research. 2017;26(1):5767.
- Jansen B. The mobility of aluminium, iron and organic matter in acidic soils [PhD thesis]. Amsterdam: Universiteit van Amsterdam; 2003.
- Kabata-Pendias A, Mukherjee AB. Trace elements from soil to human. Berlin: Springer Science & Business Media; 2007.
- Kashem M, Singh B. Metal availability in contaminated soils: I. Effects of flooding and organic matter on changes in Eh, pH and solubility of Cd, Ni and Zn. Nutrient Cycling in Agroecosystems. 2001;61:247-255.
- Kroonenberg S, Mason PR, Kriegsman L, Wong T, De Roever E. Geology and mineral deposits of the Guiana Shield. Mededelingen Geologische Mijnbouwkundige Dienst Suriname. 2019;29:111-116.
- Krstic D, Djalovic I, Nikezic D, Bjelic D. Aluminium in acid soils: chemistry, toxicity and impact on maize plants. In: Aladjadjiyan A, editor. Food productionapproaches, challenges and tasks. Rijeka: InTech; 2012, p. 231-242.
- Kusin FM, Azani NNM, Hasan SNMS, Sulong NA. Distribution of heavy metals and metalloid in surface sediments of heavily-mined area for bauxite ore in Pengerang, Malaysia and associated risk assessment. Catena. 2018;165:454-464.
- Li W, Wang J, Sun JH, Huang XJ. Persistent toxic substances in aquatic environment. In: Monitoring persistent toxic substances: Nano electrochemical methods. Berlin: Springer; 2018. p. 15-36.
- Liu X, Bai Z, Zhou W, Cao Y, Zhang G. Changes in soil properties in the soil profile after mining and reclamation in an opencast coal mine on the Loess Plateau, China. Ecological Engineering. 2017;98:228239. International Journal of Agriculture and Food Science https://www.agriculturaljournals.com
- Mahurpawar M. Effects of heavy metals on human health. International Journal of Research in Granthaalayah. 2015;3(6):1-7.
- Marques JP, Silva FDEA, Patinha C, Kasemodel MC, Rodrigues VG. Adsorption of lead (Pb) in weathered tropical soil (Ribeira Valley region-Brazil). Earth Sciences Research Journal. 2019;23(4):385-395.
- Mateus ACC, Oliveira FS, Varajão AFDC, Soares CCV. Genesis of soils from bauxite in southeastern Brazil: Resilication as a soil-forming process. Revista Brasileira de Ciência do Solo. 2017;41:e0160507.
- Moir JL, Moot DJ. Medium-term soil pH and exchangeable aluminium response to liming at three high country locations. Proceedings of the New Zealand Grassland Association. 2014;76:41-46.
- Narine R, Chandranauth R, Chibi S, Homenauth O. Evaluation of five hybrid watermelon varieties for cultivation and performance in coastal Guyana, South America. Agricultural Sciences. 2019;10(4):538-545.
- Nepal A, Antonious GF, Bebe FN, Webster TC, Gyawali BR, Neupane B. Heavy metal accumulation in three varieties of mustard grown under five soil management practices. Environments. 2024;11(4):77.
- Nowrouzi M, Pourkhabbaz A. Application of geoaccumulation index and enrichment factor for assessing metal contamination in the sediments of Hara Biosphere Reserve, Iran. Chemical Speciation and Bioavailability. 2014;26(2):99-105.
- Obaje SO, Ogunyele AC, Adeola AO, Akingboye AS. Assessment of stream sediments pollution by potentially toxic elements in the active mining area of Okpella, Edo State, Nigeria. Rudarsko-geološko-naftni zbornik. 2019;34(2):113-124.
- Oluwatosin G, Adeoyolanu O, Ojo A, Are K, Dauda T, Modupe AV. Heavy metal uptake and accumulation by edible leafy vegetable (Amaranthus hybridus L.) grown on urban valley bottom soils in southwestern Nigeria. Soil and Sediment Contamination. 2009;19(1):1-20.
- Oneț A, Brejea R, Dincă L, Enescu R, Oneț C, Besliu E. Evaluation of biological characteristics of soil as indicator for sustainable rehabilitation of a postbauxite-mining land. Diversity. 2022;14(12):1087.
- Paul C, Bullen C, Wickham C, Fletcher R, Adams H, Ross J, et al. Managing a fragile ecosystem for sustainable agricultural production; 1997.
- Prematuri R, Turjaman M, Sato T, Tawaraya K. Postbauxite mining land soil characteristics and its effects on the growth of Falcataria moluccana (Miq.) Barneby & JW Grimes and Albizia saman (Jacq.) Merr. Applied and Environmental Soil Science. 2020;2020:6764380.
- Reddy KJ, Wang L, Gloss SP. Solubility and mobility of copper, zinc and lead in acidic environments. Plant and Soil. 1995;171(1):53-58.
- Reddy M, Dunn S. Accumulation of heavy metals by soybean from sludge-amended soil. Environmental Pollution Series B, Chemical and Physical. 1984;7(4):281-295.
- Rengel Z. Tansley review No. 89. Uptake of aluminium by plant cells. New Phytologist. 1996;134(3):389-406.
- Rengel Z. Availability of Mn, Zn and Fe in the rhizosphere. Journal of Soil Science and Plant Nutrition. 2015;15(2):397-409.
- Ricksy P. Characteristics of post-mining soils in Indonesia and its remediation [dissertation]. Iwate: Iwate University; 2021.
- Shivana. Soil and plant analysis; 2020.
- Sikdar A, Hossain MS, Feng S. Heavy metal pollution of environment by mine tailings and the potential reclamation techniques: a review. Journal of Biology, Agriculture and Healthcare. 2020;10(3):33-37.
- Singleton P, Edmeades D, Smart R, Wheeler D. Soil acidity and aluminium and manganese toxicity in the Te Kauwhata Area, North Island, New Zealand. New Zealand Journal of Agricultural Research. 2011;54(4):517-522.
- Sposito G. The environmental chemistry of aluminum. 3rd ed. Boca Raton (FL): CRC Press; 2020.
- Sulakhudin, Sukirno, Abdilla AM. Impact of bauxite mining on soil chemical properties at several depths. [place unknown]: [publisher unknown]; 2023.
- Tan KS. Adsorption and desorption of chromium on clayey soils; 1989.
- Tessier A, Fortin D, Belzile N, Vitre DR, Leppard G. Metal sorption to diagenetic iron and manganese oxyhydroxides and associated organic matter: narrowing the gap between field and laboratory measurements. Geochimica ET Cosmochimica Acta. 1996;60(3):387-404.
- Tiller K. Heavy metals in soils and their environmental significance. Advances in Soil Science. 1989;9:113142.
- Townsend FC. The influence of sesquioxides on some physico-chemical and engineering properties of a lateritic soil [dissertation]. Stillwater (OK): Oklahoma State University; 1970.
- Tsado P, Osunde A, Igwe C, Adeboye M, Lawal B. Phosphorus sorption characteristics of some selected soils of the Nigerian Guinea Savanna; 2012.
- Violante A, Ricciardella M, Pigna M. Adsorption of heavy metals on mixed Fe-Al oxides in the absence or presence of organic ligands. Water, Air, and Soil Pollution. 2003;145(1-4):289-306.
- Vonk WJ, van Ittersum MK, Reidsma P, Zavattaro L, Bechini L, Guzmán G, et al. European survey shows poor association between soil organic matter and crop yields. Nutrient Cycling in Agroecosystems. 2020;118(3):325-334.
- Wuana RA, Okieimen FE. Heavy metals in contaminated soils: A review of sources, chemistry, risks and best available strategies for remediation. International Scholarly Research Notices. 2011;2011:402647.
- Zhang L, Tian C, Waychunas GA, Shen YR. Structures and charging of α-alumina (0001) water interfaces studied by sum-frequency vibrational spectroscopy. Journal of the American Chemical Society. 2008;130(24):7686-7694.
- Zhuang J, Yu GR. Effects of surface coatings on electrochemical properties and contaminant sorption of clay minerals. Chemosphere. 2002;49(6):619-628.