
Research article · 2025 · Full text
International Journal of Horticulture and Food ScienceA comprehensive study on price spread and marketing efficiency of colour capsicum in Pune district of Maharashtra
Volume 7(8) · Pages 85–88 · DOI: 10.33545/26631067.2025.v7.i8b.369 ↗
Research areasAgricultural Economics and Practices
Abstract
Author-writtenColour capsicum (Capsicum annuum L.), grown under shade net conditions, is a high-value horticultural crop gaining prominence due to its quality, market demand, and profitability. Protected cultivation enhances yield, quality, and income potential for farmers. The present study aims to analyse the price spread and assess the marketing efficiency of colour capsicum under shade net cultivation to identify the most remunerative marketing channels. The study was carried out in Pune district of Maharashtra, focusing on two purposively selected tahsils Baramati and Indapur based on their large area under colour capsicum cultivation. Three villages were randomly selected from each tahsil, making a total of six villages. From these, 90 colour capsicum farmers were selected and categorized into two separate groups. Primary data collected for the agricultural year 2023-24 were analysed using simple tabular methods and functional analytical tools. The analysis of production and disposal patterns of colour capsicum indicated that (99.79%) of the total produce was marketed. Two marketing channels were identified for colour capsicum, with Channel II (Producer-Wholesaler-Retailer- Consumer) being the most preferred by farmers. The highest price spread of ₹ 3387 was observed in Channel I, attributed to the greater number of intermediaries and market places involved and ₹ 729.28 for channel II.
Summary
Source-checkedPlain-language reading of the full paper, prepared with AI and checked against the text. Each point links to the authors' own words.
Why it matters
- Colour capsicum is a high-value horticultural crop that is becoming more prominent because of its profitability, quality, and market demand. View evidence ↗
- Using protected cultivation methods helps farmers increase their income potential, as well as the quality and yield of the crop. View evidence ↗
- In Maharashtra, capsicum is a significant vegetable crop; during 2023-24, it had a productivity of 9.10 T/ha and a total production of 39.27 thousand MT across 4.32 thousand ha. View evidence ↗
The question
- The study aims to identify the most profitable marketing channels by analyzing the marketing efficiency and price spread of colour capsicum grown under shade nets. View evidence ↗
What they did
- The research was conducted in the Baramati and Indapur tahsils of the Pune district in Maharashtra, chosen because they have large areas dedicated to colour capsicum. View evidence ↗
- The study sampled 90 colour capsicum farmers from six randomly selected villages (three per tahsil), dividing them into two groups. View evidence ↗
- Primary data from the 2023-24 agricultural year were analyzed using functional analytical tools and simple tabular methods. View evidence ↗
What they found
- The study found that nearly all of the total produce (99.79%) was marketed. View evidence ↗
- Two marketing channels were identified, and farmers most preferred Channel II, which consists of the Producer, Wholesaler, Retailer, and Consumer. View evidence ↗
- Marketing costs per quintal were higher for small farmers (₹324.50) than for large farmers (₹212.50). View evidence ↗
- Channel I had the highest price spread at ₹3,387 due to more intermediaries, while Channel II had a much lower price spread of ₹729.28. View evidence ↗
- Farmers retained a larger share of the consumer price in Channel II (73.88%) compared to Channel I (61.57%). View evidence ↗
- Channel II was significantly more efficient than Channel I, with a marketing efficiency ratio of 8.31 compared to 2.43. View evidence ↗
What it means
- The authors conclude that Channel II is the most profitable marketing route because it allows farmers to keep the highest portion of the final consumer price. View evidence ↗
Visual summary
2 visualsIllustrations explain the paper; charts are replotted from the paper's own table values.
Comparison of Marketing Channels
AI-generated conceptual illustration (colored capsicum peppers). It explains the idea and does not show study data.
View source evidence ↗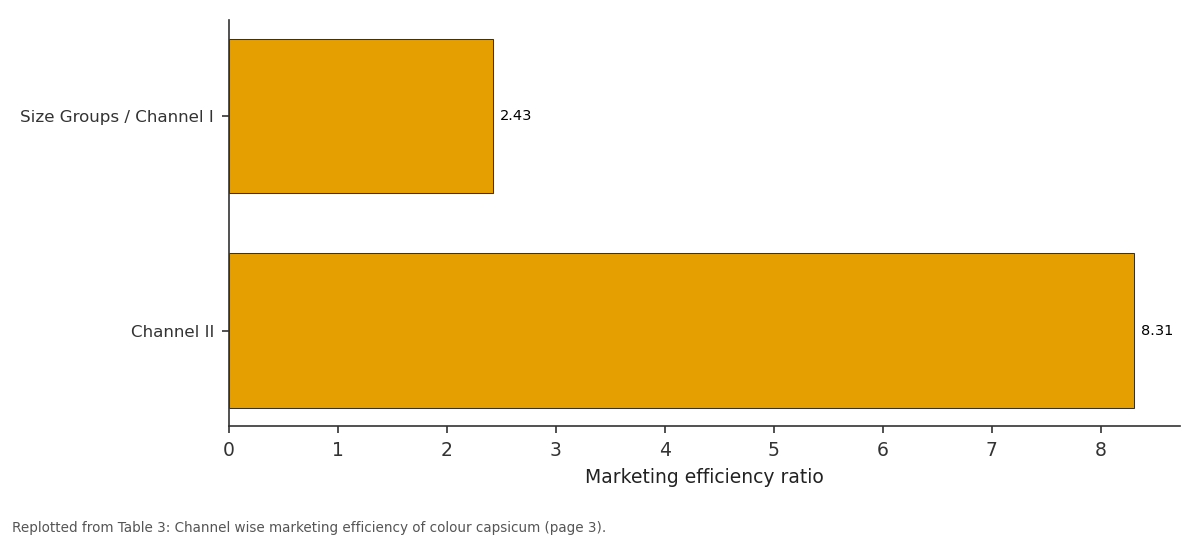
Marketing efficiency ratio: Size Groups / Channel I vs Channel II
Replotted from Table 3 (page 3) of the original paper. Every bar is the paper's own table value.
View source evidence ↗Figures & tables
From the original paper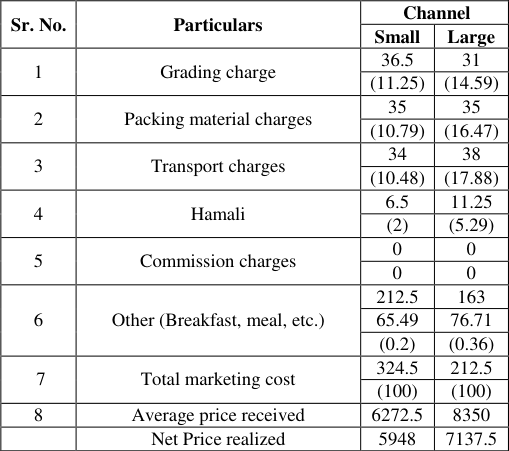 Table 1
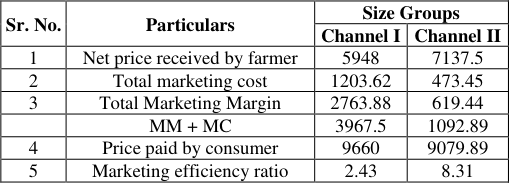 Table 3
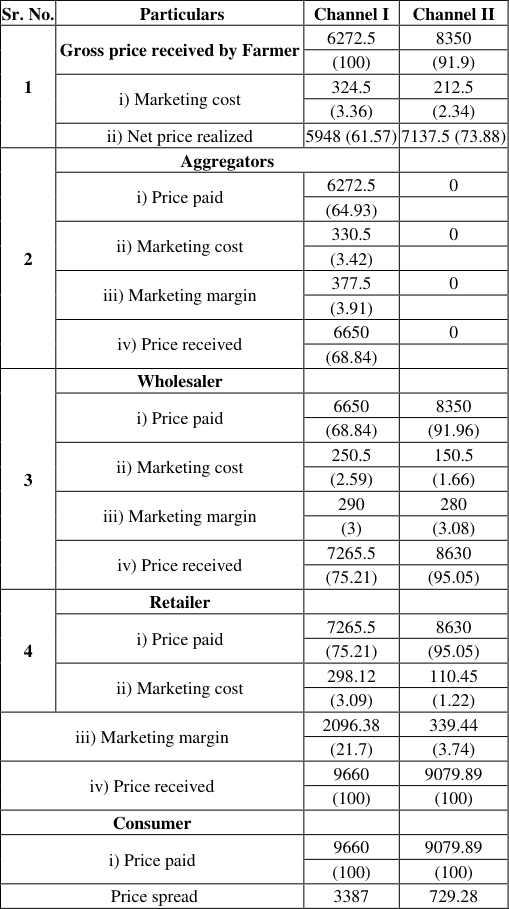 Table 2
Introduction
(Capsicum spp), commonly known as pepper, is a member of the Solanaceae family. Often referred to as sweet pepper, bell pepper, or Shimla Mirch, it is a popular vegetable widely cultivated across India. Capsicum is widely known as a highly preferred vegetable and salad. Capsicum is also called as sweet pepper due to absence of capsaicin thus it has taken up the role of an important vegetable crop around Among various vegetables it holds significance due to its nutritional value and market demand (Maitra et al., 2024) [6] . It is extensively grown in countries such as India, China, Mexico, Indonesia, and Spain. The fruit of capsicum is classified as a berry and includes a range of varieties, such as sweet peppers, chili peppers, and bell peppers. In modern agriculture, capsicum is recognized as a significant vegetable and cash crop, alongside other key crops like tomatoes, potatoes, and onions. Approximately 36 million tonnes of capsicum was produced worldwide from 2 million hectares area, led by China (46% of the total production), followed by Mexico, Indonesia, and Turkey (Anon. 2023) [1] . Capsicum is important vegetable crop in Maharashtra. It was cultivated on an area of 4.32 thousand ha with a total production of 39.27 thousand MT and productivity of 9.10 T/ha during 2023-24.
Materials and Methods
The sampling process for the present study involved the purposive selection of the study area, including the district, tehsils, villages, cultivators, and markets. Pune district was purposively selected due to maximum numbers of cultivators under colour capisucm. Among its 14 tehsils, Baramati and Indapur had a maximum cultivators under colour capisucm and were therefore selected at the second stage. Subsequently, three villages from each tehsil were purposively identified, resulting in a total of six villages.
From each village, 15 colour capisucm growers were randomly selected, constituting a total sample size of 90 respondents for the study.
Tools of Analysis
Total Marketing Cost: For calculating total marketing cost, this formula was used. C = Cr + Cm1+ Cm2……. Cmn Where, C = Total marketing cost Cr = Cost paid by the producer from the time the produce leaves the farm till he sells it. Cm = Cost incurred by its middleman in the process of buying and selling the product.
Marketing Margin: The intermediary's margin is the difference between the total market payments he makes during his transaction. For obtaining marketing margin following formula was used.
Where, MT = Total Marketing Value Si = Sell value of a product paid by i th firm Pi = Purchase value of product paid by i th firm Qi = Quantity of product handled by i th firm Price Spread: Price spread means difference between consumer's price and price received by the farmer. In this study, price spread covered the overall cost of marketing as well as the profit or loss made by intermediaries in the process of moving produce from the farm to the customer.
Result and Discussion
The following were the key marketing channels observed in colour capsicum marketing during the study.
Cost of marketing colour capsicum
Table 1 presents the marketing costs incurred by colour capsicum producers across various post-harvest operations, including loading-unloading, packing, transportation, and commission charges. Marketing encompasses various functions such as loadingunloading, packing, transportation, and handling of produce. The costs associated with these activities play a crucial role in colour capsicum marketing, as they directly influence both consumer prices and producer profitability. It could be revealed from the Table 1. that, the per quintal cost of marketing of colour capsicum for small and large size groups was ₹ 324.50 and ₹ 212.50, respectively. Thus, the per quintal marketing cost was highest in the small size group, indicating higher marketing expenditure compared to large farmers due to the role of aggregators. Among the marketing costs, other expenses (breakfast, meal, etc.) and transportation charges were the major items, contributing the highest share in total marketing cost.
| Sr. No. | Particulars | Channel | — |
|---|---|---|---|
| Small | Large | ||
| 1 | Grading charge | 36.5 | 31 |
| (11.25) | (14.59) | ||
| 2 | Packing material charges | 35 | 35 |
| (10.79) | (16.47) | ||
| 3 | Transport charges | 34 | 38 |
| (10.48) | (17.88) | ||
| 4 | Hamali | 6.5 | 11.25 |
| (2) | (5.29) | ||
| 5 | Commission charges | 0 | 0 |
| 0 | 0 | ||
| 6 | Other (Breakfast, meal, etc.) | 212.5 | 163 |
| 65.49 | 76.71 | ||
| (0.2) | (0.36) | ||
| 7 | Total marketing cost | 324.5 | 212.5 |
| (100) | (100) | ||
| 8 | Average price received | 6272.5 | 8350 |
| Net Price realized | 5948 | 7137.5 |
Table text extracted from the original PDF; superscript letters are shown inline. The original table image is below.
View original table image
Price spread in different marketing channels of colour capsicum
The price spread represents the gap between the amount paid by the consumer and the price realized by the producer, encompassing all post-harvest expenses and the profit margins of intermediaries. The detailed breakdown of costs and margins associated with each agency in the marketing structure is provided in Table 2.
| Sr. No. | Particulars | Channel I | Channel II |
|---|---|---|---|
| 1 | Gross price received by Farmer | 6272.5 | 8350 |
| (100) | (91.9) | ||
| i) Marketing cost | 324.5 | 212.5 | |
| (3.36) | (2.34) | ||
| ii) Net price realized | 5948 (61.57) | 7137.5 (73.88) | |
| 2 | Aggregators | ||
| i) Price paid | 6272.5 | 0 | |
| (64.93) | |||
| ii) Marketing cost | 330.5 | 0 | |
| (3.42) | |||
| iii) Marketing margin | 377.5 | 0 | |
| (3.91) | |||
| iv) Price received | 6650 | 0 | |
| (68.84) | |||
| 3 | Wholesaler | ||
| i) Price paid | 6650 | 8350 | |
| (68.84) | (91.96) | ||
| ii) Marketing cost | 250.5 | 150.5 | |
| (2.59) | (1.66) | ||
| iii) Marketing margin | 290 | 280 | |
| (3) | (3.08) | ||
| iv) Price received | 7265.5 | 8630 | |
| (75.21) | (95.05) | ||
| 4 | Retailer | ||
| i) Price paid | 7265.5 | 8630 | |
| (75.21) | (95.05) | ||
| ii) Marketing cost | 298.12 | 110.45 | |
| (3.09) | (1.22) | ||
| iii) Marketing margin | 2096.38 | 339.44 | |
| (21.7) | (3.74) | ||
| iv) Price received | 9660 | 9079.89 | |
| (100) | (100) | ||
| Consumer | |||
| i) Price paid | 9660 | 9079.89 | |
| (100) | (100) | ||
| Price spread | 3387 | 729.28 |
Table text extracted from the original PDF; superscript letters are shown inline. The original table image is below.
View original table image
Channel wise marketing efficiency of colour capsicum
Marketing efficiency was assessed using the modified method proposed by Acharya and Aggarwal (1999), which provides a comprehensive framework for evaluating the efficiency of marketing channels based on costs and price realization.
Figures and tables from the paper
| Sr. No. | Particulars | Size Groups | — |
|---|---|---|---|
| Channel I | Channel II | ||
| 1 | Net price received by farmer | 5948 | 7137.5 |
| 2 | Total marketing cost | 1203.62 | 473.45 |
| 3 | Total Marketing Margin | 2763.88 | 619.44 |
| MM + MC | 3967.5 | 1092.89 | |
| 4 | Price paid by consumer | 9660 | 9079.89 |
| 5 | Marketing efficiency ratio | 2.43 | 8.31 |
Table text extracted from the original PDF; superscript letters are shown inline. The original table image is below.
View original table image
References
12 in the original paper- Anonymous. FAOSTAT. 2023. [cited 2025 Aug 19]. Available from: https://www.fao.org/faostat/en/
- Barwal P. A study on marketing channels and marketing efficiency of colour capsicum in Mid-Hills of Himachal Pradesh. Int J Agric Environ Biotechnol. 2022;15.
- Choudhary S, Meena NM, Moond NSK, Ram ND, Shukla NUN. Productivity, Quality and Economics of Sweet Pepper (Capsicum annum) Cultivars under Modified Net House Conditions in Arid Regions. Ann Arid Zone. 2024;63(2):21-7.
- Jakhar RK, Singh AK, Kumawat N. Performance of capsicum cultivars (Capsicum annum L.) grown under shade net and open field in arid ecosystem of Rajasthan. Environ Ecol. 2017;35(1):290-4.
- Kalia P, Kathuria K, Kumar K, Farooq MS. Price Spread and Marketing Efficiency of Capsicum: A Study of Kandaghat Block of Solan District in Himachal Pradesh (India). Asian J Dairy Food Res. 2021;40(2):225-8.
- Maitra S, Sairam M, Santosh DT, Gaikwad DJ, Sahoo U. Growth, productivity and quality of colored capsicum (Capsicum annuum L.) as influenced by hybrids and plant growth regulators under controlled environment conditions. Res Crops. 2024;25(2):328-35.
- Pavithra KN, Gaddi GM, Pooja. Price spread in capsicum cultivation under open-field and protected cultivation in Chikkaballapura district of Karnataka. Pharma Innov J. 2021;10(7):7109.
- Shekhaliya V, Mishra S. Analysis of marketing channels of Papaya in Middle Gujarat, India. J Exp Agric Int. 2024;46(8):355-63.
- Shukla C, Acharya SK, Bhakar SR, Jamrey PK. Effect of different micro climate on the physiological parameters and yield of capsicum. Hortic Int J. 2019;3(2):61-5.
- Singh N, Sharma R, Kayastha R. Comparative Economics Analysis of Capsicum Cultivation under Protected and Open Field Conditions in Himachal Pradesh. Int J Curr Microbiol Appl Sci. 2020;9(8):1002-12.
- Thakur P, Mehta P, Lal P, Chaudhary R, Pani SK, Singh AG, et al. Agricultural Produce Supply Chain Network of Colour capsicum: Empirical Evidence from India. Economies. 2024;12(1):24.
- Thapa K, Kafle B, Bohara B, Shahi M, Regmi K. Production and Marketing Economics of Off-Season Tomato in Kaski District, Nepal. Food Agribus Manag. 2024;5(2):66-72.