
Research article · 2025 · Full text
International Journal of Agriculture and Food ScienceDevelopment of moringa pod powder Burfi
Volume 7(8) · Pages 601–909 · DOI: 10.33545/2664844x.2025.v7.i8h.656 ↗
Research areasMoringa oleifera research and applicationsFood Science and Nutritional StudiesHibiscus Plant Research Studies
Abstract
Author-writtenA moringa pod powder (MPP) fortified Burfi was developed with the aim to enhance its nutritional and functional profile. Response Surface Methodology (RSM) employing a central composite rotatable design was used to optimize the variable levels of MPP (0.50–1.00%) and sugar (5.00–7.00%), against sensory responses (colour & appearance, flavour, sweetness, body & texture, overall acceptability) and instrumental hardness. The optimized formulation, comprising 0.69% MPP and 6.02% sugar, achieved a desirability of 1.00. The predicted values for sensory scores and hardness closely matched the actual values obtained from seven independent trials, with all differences found non-significant (p
Summary
Source-checkedPlain-language reading of the full paper, prepared with AI and checked against the text. Each point links to the authors' own words.
Why it matters
- Traditional milk products, particularly khoa and khoa-based sweets, represent a significant portion of milk utilization and market value in the Indian subcontinent. View evidence ↗
- The use of moringa in commercial dairy products is limited because it can introduce an astringent taste and a green color. View evidence ↗
The question
- The study aimed to develop a Burfi fortified with moringa pod powder (MPP) by optimizing the levels of MPP to achieve ideal sensory characteristics and hardness. View evidence ↗
What they did
- The Burfi was made using full cream milk (6% fat, 9% SNF), M30 grade sugar, moringa pod powder, and green cardamom for flavoring. View evidence ↗
- Researchers used Response Surface Methodology (RSM) with a central composite rotatable design to optimize MPP (0.50–1.00%) and sugar (5.00–7.00%) levels based on sensory scores and hardness. View evidence ↗
- A trained panel of judges evaluated the sensory properties of the Burfi using a 9-point hedonic scale. View evidence ↗
What they found
- The highest score for color and appearance (8.50) was achieved with 0.75% moringa pod powder and 6% sugar. View evidence ↗
- The highest flavor acceptability score (8.20) was reached using 0.75% moringa pod powder and 6% sugar. View evidence ↗
- A combination of 0.75% moringa pod powder and 6% sugar produced the highest sweetness score (8.12). View evidence ↗
- The best body and texture score (8.50) was observed with 0.75% moringa pod powder and 6% sugar. View evidence ↗
- The highest overall acceptability score (8.45) was obtained with 0.75% moringa pod powder and 6% sugar. View evidence ↗
- The lowest instrumental hardness (22.83 N), indicating a more desirable soft texture, was found in the 0.75% moringa pod powder and 6% sugar formulation. View evidence ↗
- Numerical optimization identified the ideal formulation as 0.69% moringa pod powder and 6.02% sugar, achieving a desirability value of 1.00. View evidence ↗
- The optimized Burfi had a nutritional profile consisting of 19.80±0.45% moisture, 17.46±0.25% fat, 15.40±0.30% protein, 3.16±0.04% ash, and 44.64±0.16% total carbohydrates. View evidence ↗
- Physico-chemical analysis of the optimized product showed 0.30±0.02% lactic acid acidity, 0.21±0.02% oleic acid FFA, a tyrosine value of 12.20±0.50 µg/5 ml filtrate, water activity of 0.84±0.01, and hardness of 16.10±0.70 N. View evidence ↗
What it means
- The authors concluded that a value-added Burfi with highly acceptable sensory and textural properties was successfully developed using 0.69% moringa pod powder and 6.02% sugar. View evidence ↗
Visual summary
3 visualsIllustrations explain the paper; charts are replotted from the paper's own table values.
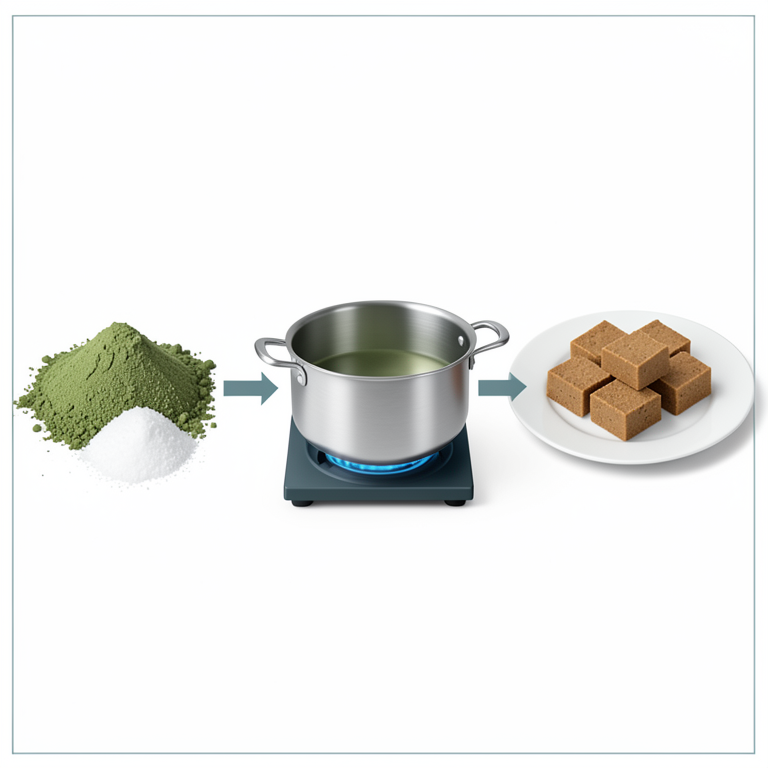
Optimization Process Flow
AI-generated conceptual illustration (Moringa pod powder and sugar used to make Burfi (an Indian milk-based sweet)). It explains the idea and does not show study data.
View source evidence ↗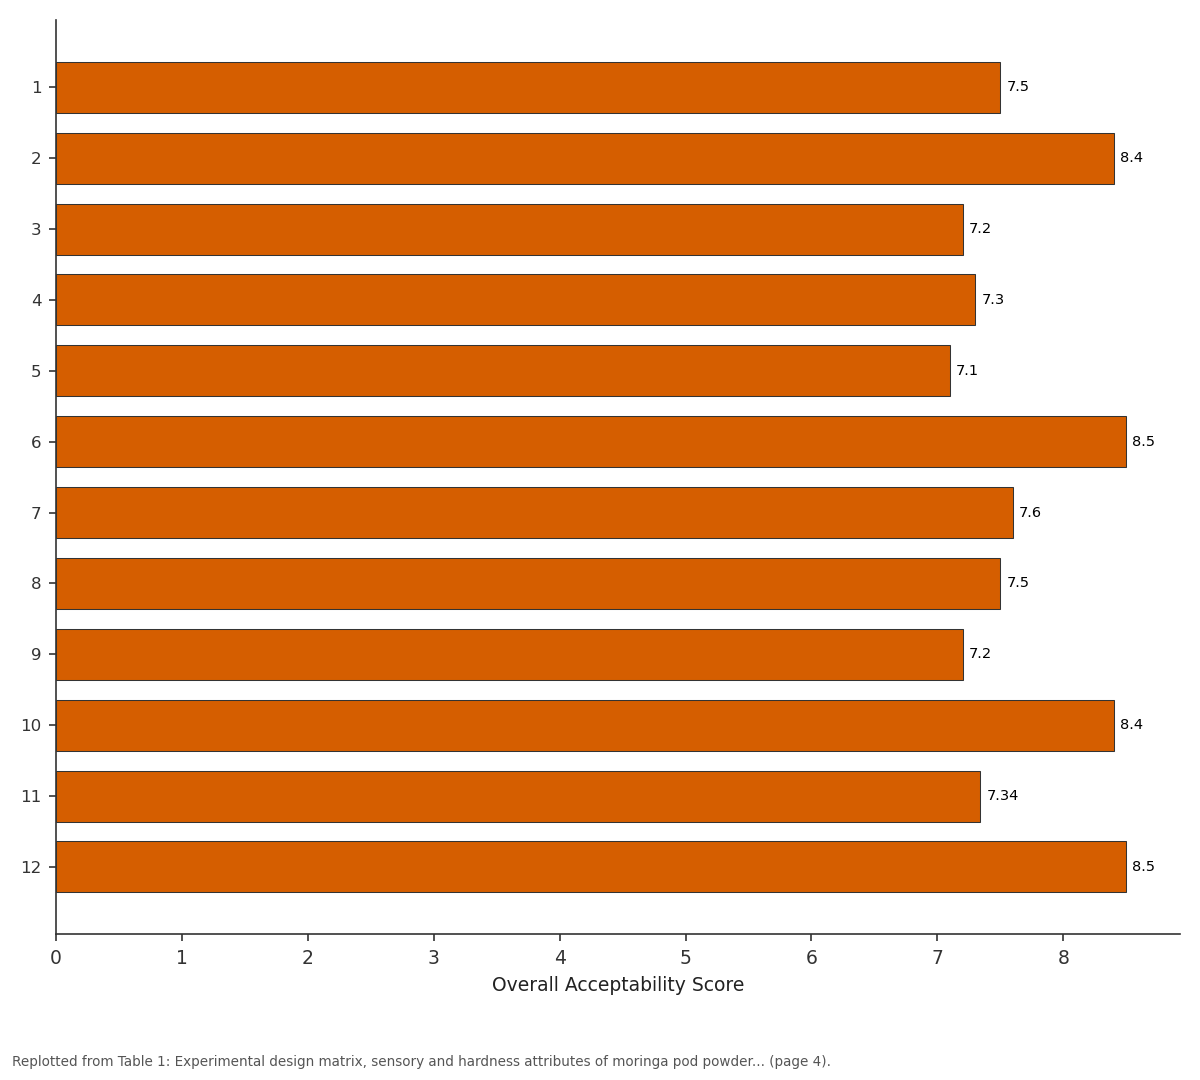
Overall Acceptability Score: 1 vs 2 vs 3 vs 4 vs 5
Replotted from Table 1 (page 4) of the original paper. Every bar is the paper's own table value.
View source evidence ↗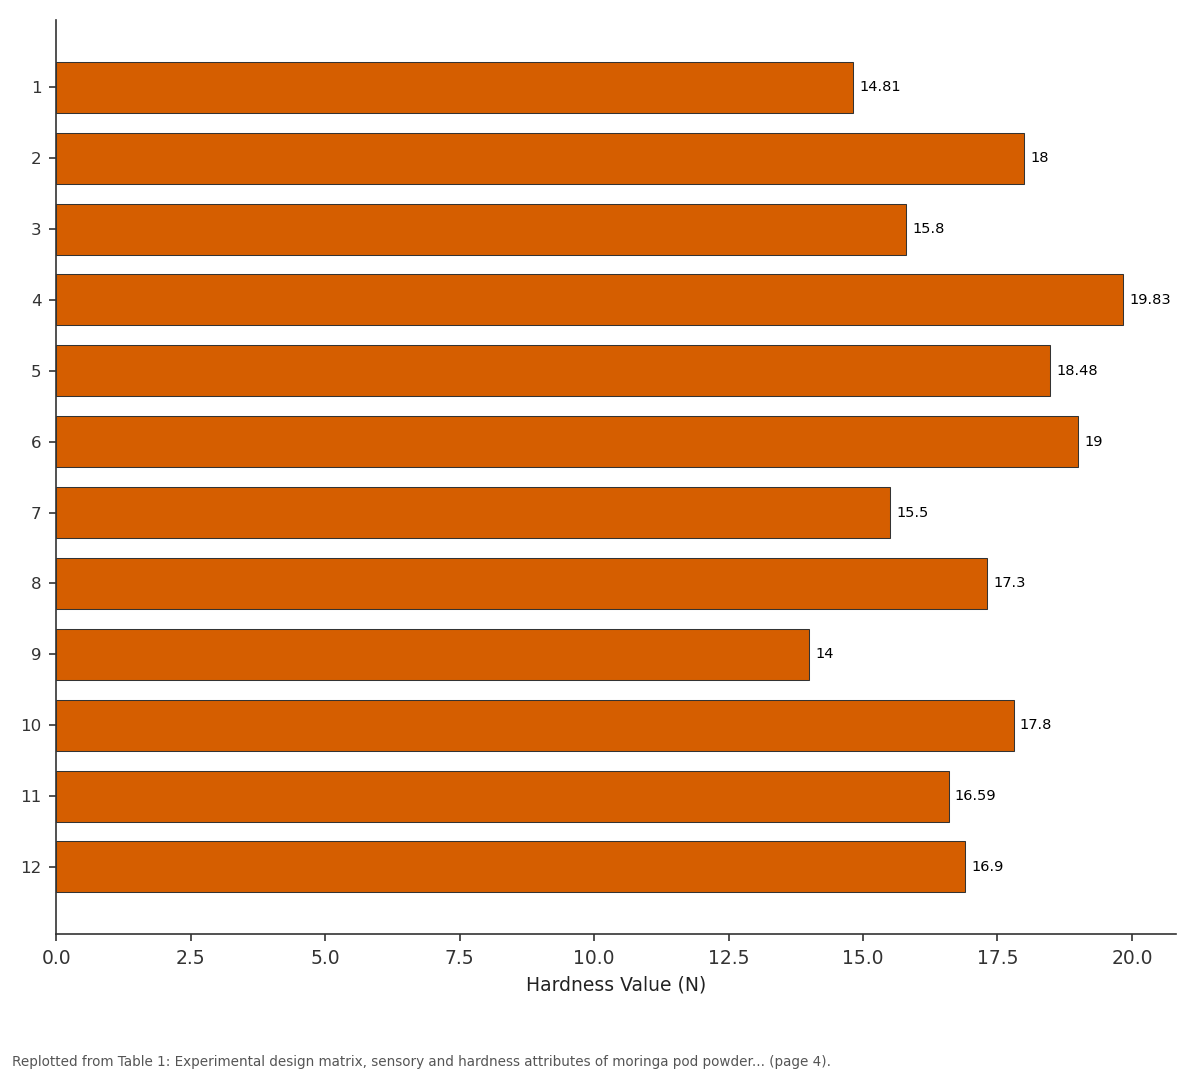
Hardness Value (N): 1 vs 2 vs 3 vs 4 vs 5
Replotted from Table 1 (page 4) of the original paper. Every bar is the paper's own table value.
View source evidence ↗Figures & tables
From the original paper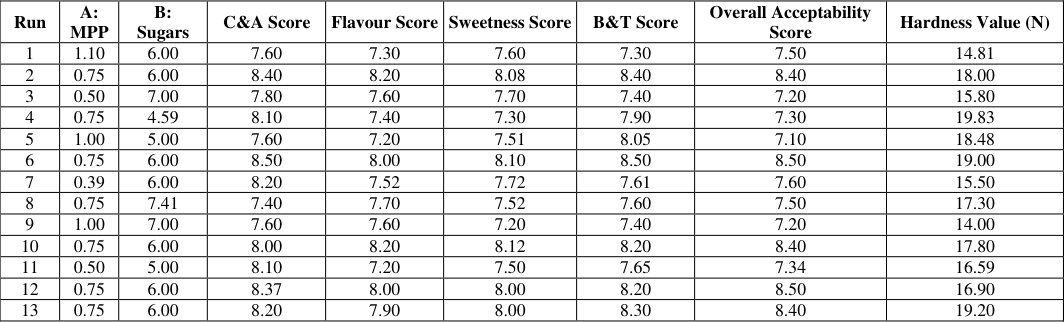 Table 1
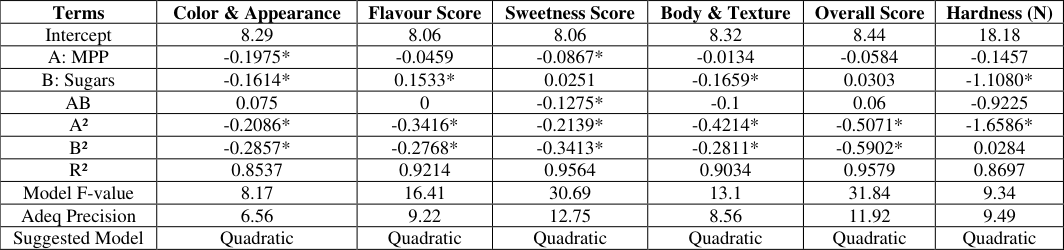 Table 2
 Table 3
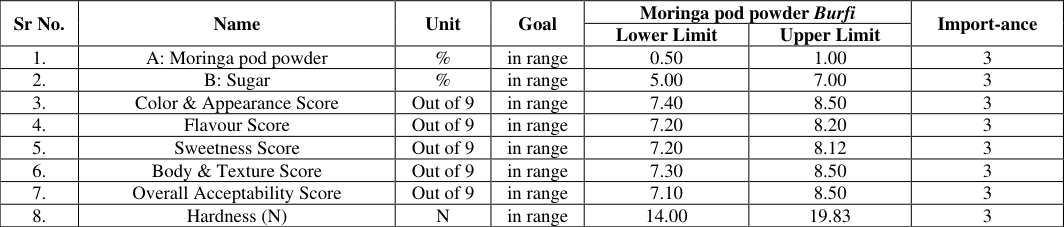 Table 4
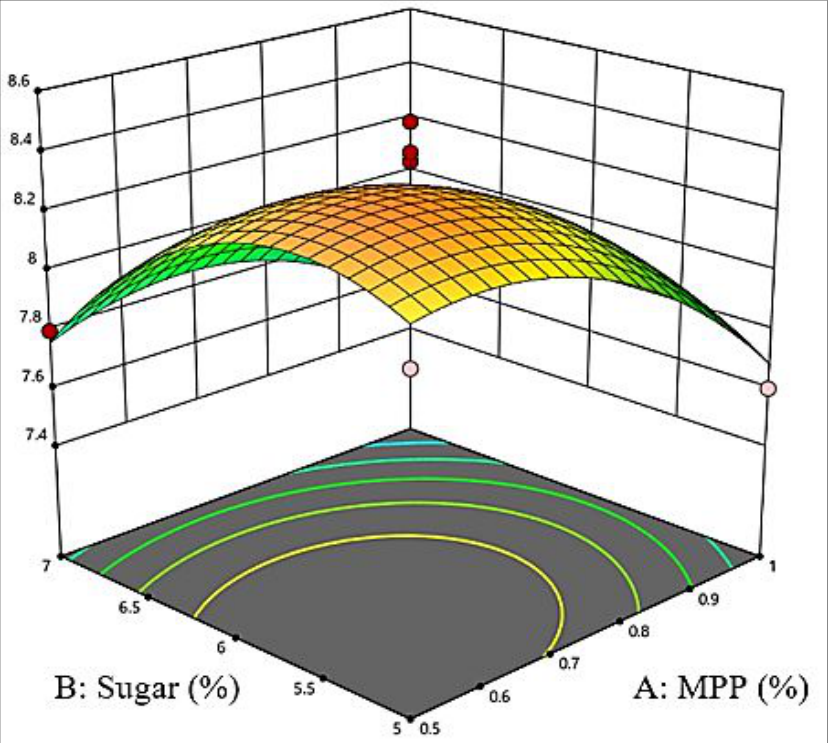 Figure 1
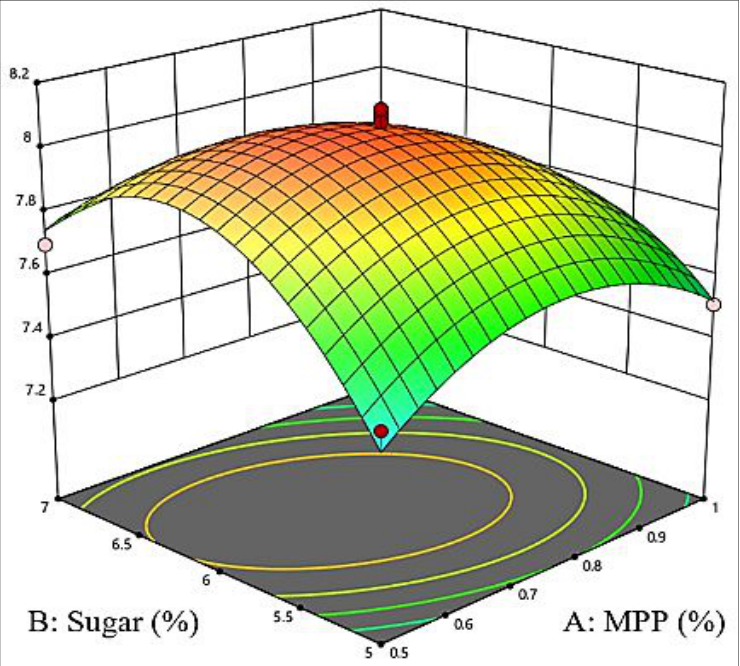 Figure 2
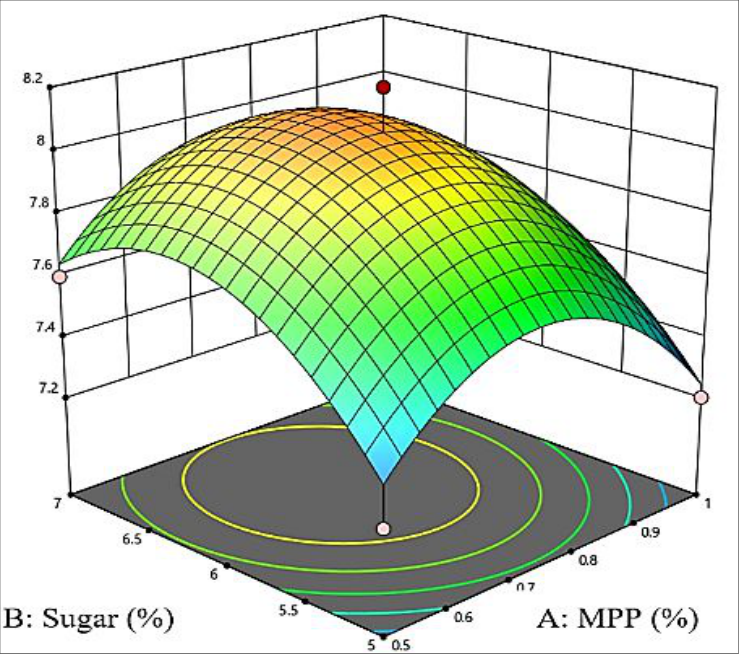 Figure 3
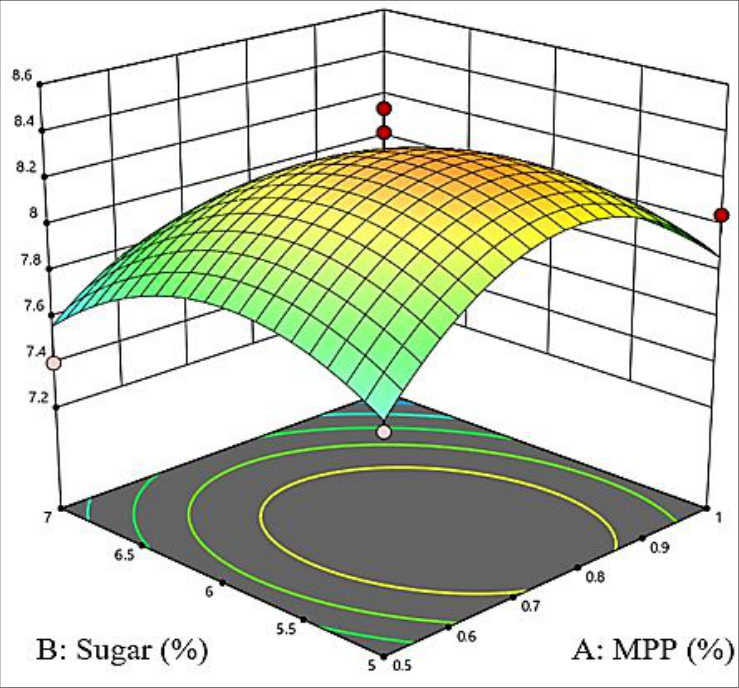 Figure 4
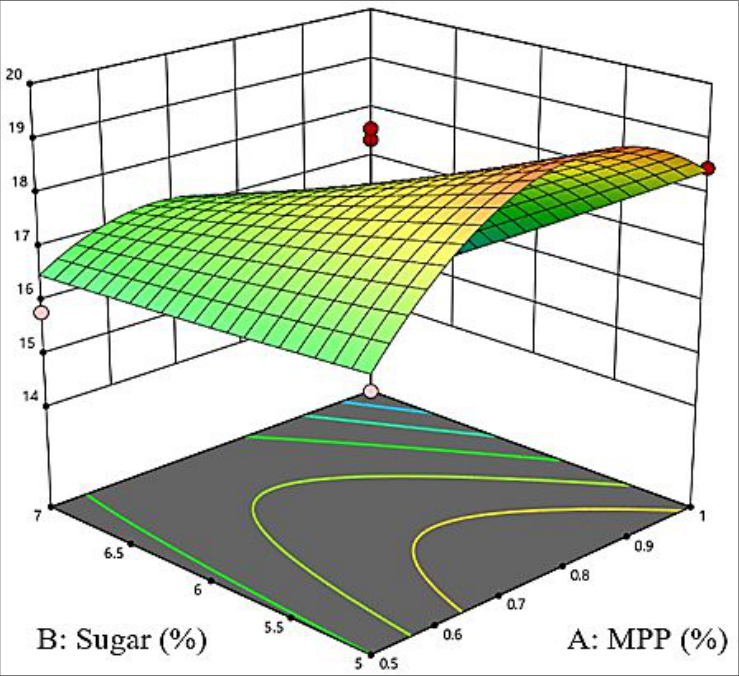 Figure 5
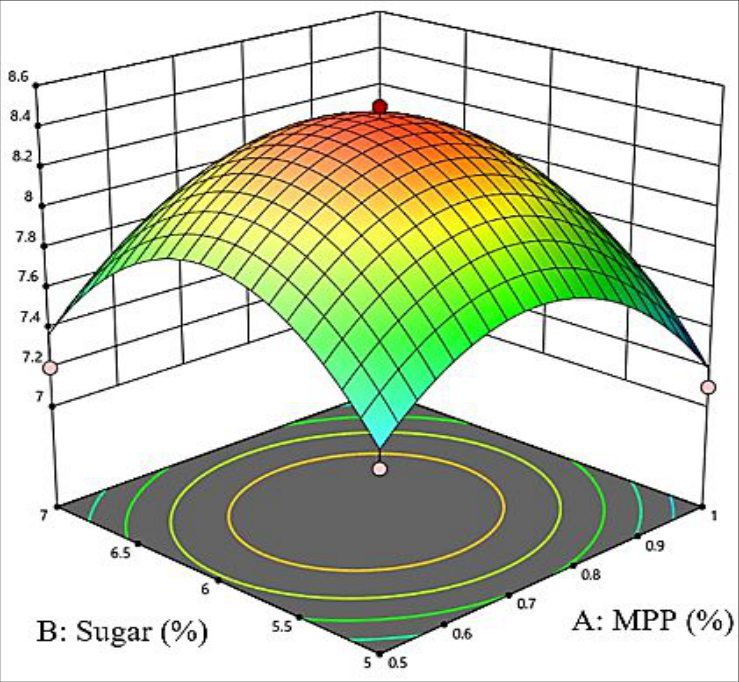 Figure 6
Introduction
Traditional milk products hold a prominent place in the Indian subcontinent, accounting for approximately 50-55% of the total milk utilization, with a market size exceeding ₹ 6,00,000 crores of which khoa and khoa based sweets is around 52,000 crores and experiencing an annual growth of around 8 to 10 per cent (Sanyal, 2020) [19] . Among these, khoa and khoabased sweets such as Burfi play a pivotal role in preserving surplus milk solids. Milk and milk products constitute an integral part of the human diet due to their unique nutritional composition, offering high-quality proteins, calcium, magnesium, vitamin B12, and various bioactive components that contribute to gut health and overall well-being (Rahman et al., 2024) [18] . Burfi, prepared by blending khoa with sugar and subjecting it to heat treatment, is characterized by its smooth texture with fine grains, and distinctive flavour (Londhe and Pal, 2007) [11] . It typically exhibits a shelf life of 7-10 days at ambient temperature (Shrivas et al., 2018) [20] . Growing consumer awareness regarding the health implications of synthetic additives has propelled a shift towards natural and functional foods. This trend is evident in the increasing demand for dairy products fortified with herbal and plant-based bioactive compounds. The World Health Organization reports that nearly 80% of the Asian and African populations rely on herbal extracts for managing chronic diseases such as diabetes, asthma, and cancer (Shyam and Divya, 2020) [21] . Moringa oleifera, commonly referred to as the "miracle tree" or "mother's best friend," stands out as a potent source of nutrition and medicinal benefits. Beyond their nutritional content, various parts of the moringa plant exhibit a wide range of medicinal properties including anti-inflammatory (Muangnoi et al., 2011) [14] , antidiabetic (Ndong et al., 2007) [15] , antioxidant (Chumark et al., 2008) [5] , hepatoprotective (Hamza, 2010) [10] , antihypertensive and cholesterol-lowering (Ara et al., 2008) [24] , and antitumor activities (Bharali et al., 2003) Present study was undertaken to develop a moringa pod powder-fortified Burfi, wherein level of moringa pod powder was optimized against sensory characteristics and hardness-a textural property. This approach aims to create a value-added, health-promoting dairy product that not only caters to evolving consumer preferences for functional foods but also addresses nutritional inadequacies prevalent in many populations.
Materials and Methods
The moringa pod powder Burfi was formulated using full cream milk (6% fat and 9% SNF) obtained from the Department of Dairy Processing and Operation, SMC College of Dairy Science, Anand. Sugar (M30 grade) of Madhur brand, manufactured by Shree Renuka Sugar Ltd., Mumbai, was procured from the local market of Anand and used as a sweetening agent. Moringa pod powder (MPP) of Pushpam Food was procured from Pushpam Food 23/24/25, Sheth Estate, Malek Vago, Opp. KDCC Bank, Kunjrao, Anand. Natural flavoring was imparted using green cardamom, which was purchased from the local market of Anand.
Preparation of Moringa Pod Powder Burfi
The full cream milk was taken in a heavy-bottomed karahi. Once the milk began boiling, moringa pod powder was added at a varying concentration of milk (Table 1). Sugar in varying concentration and cardamom powder (0.2%) were added at the pat formation stage. After desiccation, the moringa pod Burfi was transferred into a previously sterilized and sanitized stainless-steel tray and allowed to set and cool.
| Run | A: MPP | B: Sugars | C&A Score | Flavour Score | Sweetness Score | B&T Score | Overall Acceptability Score | Hardness Value (N) |
|---|---|---|---|---|---|---|---|---|
| 1 | 1.10 | 6.00 | 7.60 | 7.30 | 7.60 | 7.30 | 7.50 | 14.81 |
| 2 | 0.75 | 6.00 | 8.40 | 8.20 | 8.08 | 8.40 | 8.40 | 18.00 |
| 3 | 0.50 | 7.00 | 7.80 | 7.60 | 7.70 | 7.40 | 7.20 | 15.80 |
| 4 | 0.75 | 4.59 | 8.10 | 7.40 | 7.30 | 7.90 | 7.30 | 19.83 |
| 5 | 1.00 | 5.00 | 7.60 | 7.20 | 7.51 | 8.05 | 7.10 | 18.48 |
| 6 | 0.75 | 6.00 | 8.50 | 8.00 | 8.10 | 8.50 | 8.50 | 19.00 |
| 7 | 0.39 | 6.00 | 8.20 | 7.52 | 7.72 | 7.61 | 7.60 | 15.50 |
| 8 | 0.75 | 7.41 | 7.40 | 7.70 | 7.52 | 7.60 | 7.50 | 17.30 |
| 9 | 1.00 | 7.00 | 7.60 | 7.60 | 7.20 | 7.40 | 7.20 | 14.00 |
| 10 | 0.75 | 6.00 | 8.00 | 8.20 | 8.12 | 8.20 | 8.40 | 17.80 |
| 11 | 0.50 | 5.00 | 8.10 | 7.20 | 7.50 | 7.65 | 7.34 | 16.59 |
| 12 | 0.75 | 6.00 | 8.37 | 8.00 | 8.00 | 8.20 | 8.50 | 16.90 |
| 13 | 0.75 | 6.00 | 8.20 | 7.90 | 8.00 | 8.30 | 8.40 | 19.20 |
Table text extracted from the original PDF; superscript letters are shown inline. The original table image is below.
View original table image
Analysis
Moringa pod powder Burfi was analyzed for its proximate composition, physico-chemical properties, and microbial quality. Moisture, fat, protein, total ash, and titratable acidity were determined using standard procedures as per FSSAI (2022) [8] . Water activity was measured using Rotronic Hygrolab 3 with an AW-DIO probe. Physicochemical properties were analyzed using reference methods with minor modifications provided by various researchers, such as: Free Fatty Acids (FFA) -Uçar et al. (2024) [23] , Tyrosine Value and Hydroxy Methyl Furfural -Anurag et al. (2017) [1] , and Colour Value -Konica Minolta CR-400. Microbiological quality was assessed by determining the aerobic plate count, coliform count, and yeast and mold count (FSSAI, 2024) [8] .
Sensory Evaluation of Moringa Pod Powder Burfi
The sensory evaluation of moringa pod powder Burfi was conducted by a trained panel of judges using a 9-point hedonic scale (Meilgaard et al., 1999) [12] .
Statistical Analysis
The experimental data were analyzed using Design Expert® software (version 13.0.1.0, Stat-Ease, Inc., Minneapolis, USA). A central composite rotatable design (CCRD) under response surface methodology (RSM) was used.
Results and Discussion
The optimization of moringa pod powder incorporation into Burfi was carried out based on its sensory qualities, and its instrumental hardness.
Effect on Colour & Appearance Scores
The colour & appearance scores of moringa pod powder Burfi varied from 7.40 to 8.50 on a 9-point hedonic scale (Table 1). The best score (8.50) was obtained with 0.75% moringa pod powder and 6% sugar, suggesting an optimal balance where the characteristic green hue of moringa was present. Conversely, increasing moringa pod powder to 0.75% with a higher sugar level of 7.41% reduced the score to 7.40, indicating that excessive sugar in combination with moringa did not enhance the visual appeal, possibly due to intensified colour masking. Statistically, moringa pod powder (A) and sugar (B) showed significant negative linear effects (p<0.05) and at quadratic terms (A², B²) also had significant negative impacts, while their interaction was non-significant (Table 2). Similar declining trend was reported by Devisetti et al. (2016) [6] , who found that incorporation of moringa leaf powder in crackers resulted in a darker, less preferred colour, with scores decreased as moringa concentration increased from 2% to 6%. Patel (2016) [16] observed that adding moringa leaf powder above 0.52% in buttermilk significantly reduced its appearance score due to a pronounced green tint. In a study on moringa-fortified lassi, Mistry (2018) [13] reported that higher levels of moringa pod powder (up to 1.63%) imparted an intense colour that was less acceptable to the sensory panel. Moringa pod powder in products having lower total solids impacted colour and appearance score at a lower level of additions. These studies underline the need to carefully optimize moringa levels in dairy matrices to maintain appealing visual properties, consistent with our observations.
| Terms | Color & Appearance | Flavour Score | Sweetness Score | Body & Texture | Overall Score | Hardness (N) |
|---|---|---|---|---|---|---|
| Intercept | 8.29 | 8.06 | 8.06 | 8.32 | 8.44 | 18.18 |
| A: MPP | -0.1975* | -0.0459 | -0.0867* | -0.0134 | -0.0584 | -0.1457 |
| B: Sugars | -0.1614* | 0.1533* | 0.0251 | -0.1659* | 0.0303 | -1.1080* |
| AB | 0.075 | 0 | -0.1275* | -0.1 | 0.06 | -0.9225 |
| A² | -0.2086* | -0.3416* | -0.2139* | -0.4214* | -0.5071* | -1.6586* |
| B² | -0.2857* | -0.2768* | -0.3413* | -0.2811* | -0.5902* | 0.0284 |
| R² | 0.8537 | 0.9214 | 0.9564 | 0.9034 | 0.9579 | 0.8697 |
| Model F-value | 8.17 | 16.41 | 30.69 | 13.1 | 31.84 | 9.34 |
| Adeq Precision | 6.56 | 9.22 | 12.75 | 8.56 | 11.92 | 9.49 |
| Suggested Model | Quadratic | Quadratic | Quadratic | Quadratic | Quadratic | Quadratic |
Table text extracted from the original PDF; superscript letters are shown inline. The original table image is below.
View original table image
Effect on Flavour Scores
In the present investigation, the flavour scores of moringa pod powder Burfi ranged from 7.20 to 8.20 (Table 1). The highest flavour acceptability (8.20) was achieved with 0.75% moringa pod powder and 6% sugar, while the lowest score (7.20) was noted in samples with higher moringa concentrations or reduced sugar levels. This highlights that moderate incorporation of moringa pod powder, complemented by balanced sugar content, maintained the characteristic flavour profile of Burfi without introducing excessive herbal or astringent bitter notes. Among the effects studied, sugar (B) exerted a significant positive linear effect (p<0.05) on flavour, enhancing sweetness perception and masking any potential astringency of moringa, while moringa pod powder (A) had a nonsignificant negative linear effect. However, the quadratic terms of both A² and B² were significant and negative (p<0.05), indicating that excessively high levels of either ingredient could negatively influence flavour. A similar trend has been delineated by Patel (2016) [6] who observed that flavour scores in moringa-fortified buttermilk peaked at 0.52% moringa incorporation but declined at higher concentrations due to a dominant leafy aftertaste. Similarly, Dudhrejia (2017) reported that adding up to 2% moringa pod powder in frozen yogurt yielded favourable flavour scores, but beyond this, acceptability decreased due to increased bitterness. These findings collectively underscore the importance of optimising moringa levels to harness nutritional benefits without compromising the characteristic flavour of Burfi.
Effect on Sweetness Scores
The highest sweetness score (8.12) was achieved with 0.75% moringa pod powder and 6% sugar, indicating an ideal synergy between sugar content and the subtle earthy notes of moringa. In contrast, samples containing 1.00% moringa pod powder with 7.00% sugar received the lowest score (7.20), reflecting that increased levels of moringa can suppress perceived sweetness or introduce slight bitterness that counters the sugary taste. Analysis revealed that moringa pod powder (A) had a significant negative linear effect (p<0.05) on sweetness, suggesting that higher moringa levels slightly suppressed sweet perception. The quadratic effects of both moringa pod powder (A²) and sugar (B²) were also significant and negative (p<0.05), indicating diminishing sweetness beyond optimal levels. Additionally, the interaction term (AB) was found to be significant and negative, implying that combined higher concentrations of moringa and sugar could reduce sweetness scores. Supportive findings are documented in related literature. Apilado et al. (2013) [2] observed that adding moringa leaf powder beyond 0.5% in cream cheese adversely affected sweetness perception due to herbal notes. Likewise, Mistry (2018) [13] in moringafortified lassi found that moderate incorporation (up to 1.63% pod powder) maintained balanced sweetness, while higher levels led to slight bitterness that reduced sweet perception.
Effect on Body and Texture Scores
In the current study, the body & texture scores of moringa pod powder Burfi varied between 7.30 and 8.50 on the 9point hedonic scale (Table 1). The highest score (8.50) was observed for the formulation with 0.75% moringa pod powder and 6% sugar, indicating that this level provided a desirable balance, yielding a soft, cohesive texture that was well-received by the sensory panel. Conversely, samples with higher moringa levels, such as 1.00% moringa pod powder with reduced sugar level of 5% received lower scores (7.30), might be due to minor fibrousness and textural dryness imparted by increased moringa content. Statistically, sugar (B) exhibited a significant negative linear effect (p<0.05) on body & texture, suggesting that excessive sugar might slightly disrupt the cohesive matrix. The quadratic terms of both moringa pod powder (A²) and sugar (B²) were also negatively significant (p<0.05), indicating that body & texture deteriorated at higher levels of these ingredients. Similar impacts on texture have been reported in related studies. Dudhrejia (2017) found that adding moringa pod powder to frozen yogurt up to 2% maintained a smooth body & texture, while higher additions led to slight graininess. Mistry (2018) [13] also documented that in moringa-fortified lassi, increasing pod powder above 1.63% resulted in less favourable mouthfeel, likely due to the fibrous content of moringa. These findings collectively underscore the importance of optimising moringa levels in Burfi to preserve the characteristic body and texture that consumers expect.
Effect on Overall Acceptability Scores
Overall acceptability is a comprehensive parameter that integrates consumer perceptions of all sensory attributesincluding colour, flavour, sweetness, and texture-and ultimately determines the product's market potential. In the present study, the overall acceptability scores of moringa pod powder Burfi ranged from 7.40 to 8.45 on the 9-point hedonic scale (Table 1). The highest score (8.45) was obtained at 0.75% moringa pod powder and 6% sugar, highlighting that moderate levels of moringa, balanced by an optimal sugar concentration, resulted in a well-rounded product preferred by the sensory panel. The lowest score (7.40) was recorded for Burfi with 1.00% moringa pod powder and 5% sugar, suggesting that higher incorporation of moringa slightly reduced the overall liking, likely due to combined impacts on colour, flavour and texture. Analysis revealed that moringa pod powder (A) had a significant negative linear effect (p<0.05) on overall acceptability, while sugar (B) showed a non-significant positive linear influence. Both quadratic effects (A² and B²) were significant and negative (p<0.05), indicating declines in overall acceptability beyond certain optimal levels. Comparable findings have been reported by Mistry (2018) [13] who observed that overall acceptability of moringa-fortified lassi was highest at moderate pod powder levels and with further increases led to reduction in scores due to impacts on flavour and mouthfeel. Similarly, Patel (2016) [6] reported that in moringa buttermilk, overall acceptability decreased beyond 0.52% moringa leaf powder addition due to pronounced colour and flavour deviations. These findings underscore the necessity to carefully balance moringa pod powder and sugar levels to develop a nutritionally enhanced Burfi without compromising consumer appeal.
Effect on Hardnes
The hardness of moringa pod powder Burfi samples measured using a texture analyser, ranged from 22.83 N to 37.90 N (Table 1). The lowest hardness (22.83 N) was recorded for Burfi containing 0.75% moringa pod powder and 6% sugar, indicating a softer cohesive and more desirable texture. In contrast, the highest hardness (37.90 N) was observed at 1.00% moringa pod powder and 5% sugar, suggesting that decreased moringa levels, coupled with lower sugar, produced a firmer product likely due to reduced moisture-binding and increased structural rigidity imparted by reduced presence of moringa fibers. The regression analysis indicated that moringa pod powder (A) had a significant positive linear effect (p<0.05) on hardness, confirming that higher incorporation levels led to a firmer product. The quadratic effect of moringa pod powder (A²) was also significant and positive, while the sugar quadratic term (B²) was significant and negative, suggesting that although sugar slightly softened the matrix, at high concentrations of moringa, the texture became progressively harder. The interaction effect (AB) was nonsignificant.
Optimization of Product Formulation for Moringa Pod Powder Burfi
The independent variables, moringa pod powder and sugar, were optimized within specified constraints (Table 4) while maintaining all response variables such as sensory attributes and hardness within their desired ranges. The numerical optimization process suggested an optimal formulation containing 0.69% Moringa pod powder and 6.02% sugar, which achieved a desirability value of 1.00. Based on this optimized formulation, MPP Burfi was prepared and evaluated. The predicted values for colour & appearance, flavour, sweetness, body & texture, overall acceptability, and hardness were 8.30, 8.06, 8.06, 8.31, 8.44, and 18.15 N respectively. The corresponding actual values obtained from seven independent trials were 8.39, 8.11, 8.12, 8.41, 8.42, and 17.99 N. Statistical comparison using Student's t-test revealed that the differences between predicted and actual values were non-significant at the 5% level of significance, as all calculated t-values were below the tabulated value of 2.447 (Table 5).
| Sr No. | Name | Unit | Goal | Moringa pod powder Burfi | — | Import-ance |
|---|---|---|---|---|---|---|
| Lower Limit | Upper Limit | |||||
| 1. | A: Moringa pod powder | % | in range | 0.50 | 1.00 | 3 |
| 2. | B: Sugar | % | in range | 5.00 | 7.00 | 3 |
| 3. | Color & Appearance Score | Out of 9 | in range | 7.40 | 8.50 | 3 |
| 4. | Flavour Score | Out of 9 | in range | 7.20 | 8.20 | 3 |
| 5. | Sweetness Score | Out of 9 | in range | 7.20 | 8.12 | 3 |
| 6. | Body & Texture Score | Out of 9 | in range | 7.30 | 8.50 | 3 |
| 7. | Overall Acceptability Score | Out of 9 | in range | 7.10 | 8.50 | 3 |
| 8. | Hardness (N) | N | in range | 14.00 | 19.83 | 3 |
Table text extracted from the original PDF; superscript letters are shown inline. The original table image is below.
View original table image
The close agreement between predicted and experimental values underscores the reliability of the model in developing a sensorily acceptable and nutritionally enriched Moringabased Burfi.
Analysis of Moringa Pod Powder Burfi
The Moringa Pod Powder Burfi was analyzed for its proximate composition, physico-chemical characteristics, antioxidant activity, and hardness. The moisture content was 19.80±0.45%, reflecting adequate water retention, likely due to the presence of dietary fiber of moringa pods, which contributed to the soft and moist texture of the Burfi. The fat content was 17.46±0.25%, essential for imparting richness, smoothness, and palatability, as well as contributing to the energy value. The protein level was 15.40±0.30%, indicating a good nutritional profile enhanced by the incorporation of protein-rich moringa pods. The ash content was 3.16±0.04%, pointing to the presence of significant mineral content, a characteristic feature of moringa-based products. The total carbohydrates were 44.64±0.16%, providing bulk, sweetness, and energy to the product. In terms of physico-chemical properties, the acidity was 0.30±0.02% lactic acid. The free fatty acids (FFA) were 0.21±0.02% oleic acid, suggesting low lipolysis which might be attributed to the natural antioxidants present in moringa. The tyrosine value, indicative of protein degradation during storage, was 12.20±0.50 µg/5 ml filtrate. The water activity (aw) was 0.84±0.01, which is within the safe range to inhibit microbial growth while maintaining desired softness. The hardness of the Burfi was 16.10±0.70 N, indicating a firm yet acceptable texture, suitable for traditional Burfi consumption characteristics.
Conclusion
A value-added Burfi was successfully developed by incorporating it with moringa pod powder (MPP) and optimizing its formulation using Response Surface Methodology (RSM). The optimized product, containing 0.69% MPP and 6.02% sugar, achieved highly acceptable sensory properties with balanced textural attribute in terms of hardness. Incorporation of MPP may significantly enhance the nutritional profile by contributing to essential minerals like calcium and iron, vitamin C, dietary fibre, and antioxidant compounds inherent to moringa. The quadratic models for sensory attributes and hardness demonstrated robust statistical adequacy, validating the optimization approach.
Figures and tables from the paper
| Property | Equation |
|---|---|
| Colour & Appearance | 8.06 - 0.2101A + 0.0386B + 0.0575AB - 0.0391A² - 0.0141B² |
| Flavour | 8.05 - 0.2391A + 0.2326B + 0.1871AB - 0.2876A² - 0.0436B² |
| Body & texture | 8.12 - 0.0091A + 0.2457B + 0.1738AB - 0.0912A² - 0.3576B² |
| Sweetness | 8.24 - 0.0288A + 0.1382B - 0.2300AB - 0.2035A² - 0.0985B² |
| Overall acceptability | 8.16 - 0.1761A + 0.2051B + 0.1298AB - 0.2335A² - 0.1035B² |
| Hardness | 18.61 - 0.8208A - 2.3800B + 0.7350AB + 0.3954A² - 0.8710B² |
Table text extracted from the original PDF; superscript letters are shown inline. The original table image is below.
View original table image
References
24 in the original paper- Anurag CR, Khatkar SK, Bhaskar D. Effect of temperature on physics chemical and sensory attributes of bottle gourd Burfi. Indian J Dairy Sci 2017;70(4):391-397.
- Apilado OS, Oliveros MCR, Sarmago IG, Magpantay VA, Lapitan RM. Chemical composition, sensory quality and acceptability of cream cheese from pure buffalo's milk added with malunggay (Moringa oleifera L.) leaf powder. Philipp J Vet Anim Sci 2013;39(1):9198.
- Ara N, Rashid M, Amran MS. Comparison of Moringa oleifera leaves extract with atenolol on serum triglyceride, serum cholesterol, blood glucose, heart weight, body weight in adrenaline induced rats. Saudi J Biol Sci 2008; 15:253-258.
- Bharali R, Tabassum J, Azad M. Chemomodulatory effect of Moringa oleifera Lam on hepatic carcinogen metabolising enzymes, antioxidant parameters and skin papillomagenesis in mice. Asian Pac J Cancer Prev 2003; 4:131-139.
- Chumark P, Khunawat P, Sanvarinda Y, Phornchirasilp S, Morales NP, PhivthongNgam L, et al. The in vitro and ex vivo antioxidant properties, hypolipidaemic and antiatherosclerotic activities of water extract of Moringa oleifera Lam leaves. J Ethnopharmacol 2008; 116:439-446.
- Devisetti R, Sreerama YN, Bhattacharya S. Processing effects on bioactive components and functional properties of moringa leaves: Development of a snack and quality evaluation. J Food Sci Technol 2016;53(1):649-657.
- Food Safety and Standards Authority of India (FSSAI). Manual of methods of analysis of foods: Dairy and Dairy Products. New Delhi: FSSAI; 2022. p. 1-254.
- Food Safety and Standards Authority of India (FSSAI). Methods of analysis: Microbiological examination of food and water. New Delhi: FSSAI; 2024. p. 1-200.
- Gopalan C, Ramasastri BV, Balasubramanian SC. Nutritive value of Indian foods. Revised and updated edition. Hyderabad: National Institute of Nutrition, Indian Council of Medical Research; 2004. p. 1-161.
- Hamza AA. Ameliorative effects of Moringa oleifera Lam seed extract on liver fibrosis in rats. Food Chem Toxicol 2010; 48:345-355.
- Londhe G, Pal D. Developments in shelf life extension of khoa and khoa based sweets-an overview. Indian J Dairy Biosci 2007; 18:1-9.
- Meilgaard MC, Carr BT, Civille GV. Sensory evaluation techniques. 3rd ed. Boca Raton: CRC Press; 1999. p. 1-387.
- Mistry EM, Patel SM, Pinto S, Modha HM. Utilization of moringa pod powder as a valueadded ingredient in lassi. Res Rev J Dairy Sci Technol 2018; 7:6-17.
- Muangnoi C, Chingsuwanrote P, Praengamthanachoti P, Svasti S, Tuntipopipat S. Moringa oleifera pod inhibits inflammatory mediator production by lipopolysaccharide-stimulated RAW 264.7. Indian J Pharmacol 2011; 21:34-35.
- Ndong M, Uehara M, Katsumata S, Suzuki K. Effects of oral administration of Moringa oleifera Lam on glucose tolerance in Goto-Kakizaki and Wistar rats. J Clin Biochem Nutr 2007; 40:229-233.
- Patel BK, Patel SM, Modi ZS, Pinto SV, Pinto S. Standardization of technology for manufacture of buttermilk fortified with moringa (Moringa oleifera) [dissertation]. Anand: Anand Agricultural University; 2016. p. 1-98.
- Priyankkumar TD. Standardization of technology for frozen yoghurt fortified with moringa [dissertation]. Anand: Department of Dairy Technology, Sheth M C College of Dairy Science, Anand Agricultural University; 2017. p. 1-100.
- Rahman MA, Redoy MRA, Chowdhury R, Al Mamun M. Effect of dietary supplementation of plantain herb, lemongrass and their combination on milk yield, immunity, liver enzymes, serum, and milk mineral status in dairy cows. J Adv Vet Anim Res 2024;11(1):185-193.
- Sanyal MK. Technological Innovations in Processing of Traditional Indian Dairy Products. In: National Seminar on Traditional Indian Dairy Products-Prospects of Commercialization; 2020 Mar 13; Karnal, India. Karnal: ICAR-NDRI; 2020. p. 21-25.
- Shrivas AA, Pinto SV, Patel SM, Balakrishnan S. Effect of storage on composition, physico-chemical, rheology, sensory and microbiological quality of Indian cookie rava Burfi. J Appl Nat Sci 2018; 10:88-97. https://doi.org/10.31018/jans.v10i1.1585
- Shyam Suraj SR, Divya KB. Herbal dairy supplements: Research status and market opportunities in India. Res Rev J Environ Sci 2020;2(2):1-13.
- U.S. Department of Agriculture. USDA national nutrient database. Washington (DC): Agricultural Research Service; 2019. Available from: https://fdc.nal.usda.gov
- Uçar B, Gholami Z, Svobodová K, Hradecká I, Hönig V. A comprehensive study for determination of free fatty acids in selected biological materials: A review. Foods 2024;13(12):1891. https://doi.org/10.3390/foods13121891
- Ara R, Brazier J. Deriving an algorithm to convert the eight mean SF-36 dimension scores into a mean EQ-5D preference-based score from published studies (where patient level data are not available). Value in Health. 2008 Dec;11(7):1131-43.