
Research article · 2025 · Full text
International Journal of Agriculture and Food ScienceAssessment of nutritional status and dietary practices among adolescent girls in an agricultural university
Volume 7(8) · Pages 333–336 · DOI: 10.33545/2664844x.2025.v7.i8e.631 ↗
Research areasHealth and Lifestyle StudiesObesity, Physical Activity, Diet
Abstract
Author-writtenThis cross-sectional study evaluated the nutritional status and dietary practices of 30 adolescent girls (17–19 years) studying B.Sc. Community Science at SKRAU, Bikaner. Assessments included anthropometry, haemoglobin estimation, clinical examination and 24-hour dietary recall. Results showed 40% were underweight and 83.3% were anemic (Hb
Summary
Source-checkedPlain-language reading of the full paper, prepared with AI and checked against the text. Each point links to the authors' own words.
Why it matters
- Adolescence (ages 10-19) is a critical period of rapid physical, social, and psychological development. View evidence ↗
- The nutritional health of adolescent girls is vital for a nation's success due to their future impact on population health and growth. View evidence ↗
- Anemia is a widespread health issue affecting adolescent girls in India. View evidence ↗
The question
- The study aimed to assess the overall nutritional status and evaluate the dietary patterns of adolescent girls aged 17-19 years. View evidence ↗
What they did
- Nutritional status was evaluated using a combination of anthropometry, biochemical tests, clinical exams, and dietary intake analysis. View evidence ↗
- The 24-hour dietary recall method was employed to evaluate the participants' dietary intake. View evidence ↗
What they found
- Forty percent of the participants were classified as underweight (BMI <18.5), while 60% had a normal BMI. View evidence ↗
- Forty percent of the girls exhibited high waist-to-hip ratios (>0.8), indicating central adiposity despite the prevalence of low BMI. View evidence ↗
- Anemia was highly prevalent, with 83.3% of participants having hemoglobin levels below 12 g/dl. View evidence ↗
- Nutrient intake was below RDA for energy (71.86%), protein (67.93%), visible fat (70.14%), iron (39.12%), and calcium (54.28%). View evidence ↗
- Food group intake was deficient for cereals (56.6% fulfilled), pulses (54.1%), and fruits/vegetables (58.9%), while milk and milk products met 100% of the recommended intake. View evidence ↗
- Statistical analysis confirmed that energy and calcium intakes were significantly lower than recommended levels (p < 0.05). View evidence ↗
- While 90% of participants appeared clinically normal, 10% showed visible signs of nutritional deficiencies. View evidence ↗
What it means
- The authors conclude there is a concerning gap between the theoretical nutritional knowledge of these students and their actual dietary practices. View evidence ↗
- The authors recommend prioritizing iron supplementation programs and enhancing practical nutrition education to address severe anemia. View evidence ↗
- The authors state that future research is needed to explore barriers to applying nutritional knowledge and to evaluate the effectiveness of targeted interventions. View evidence ↗
Visual summary
1 visualsIllustrations explain the paper; charts are replotted from the paper's own table values.
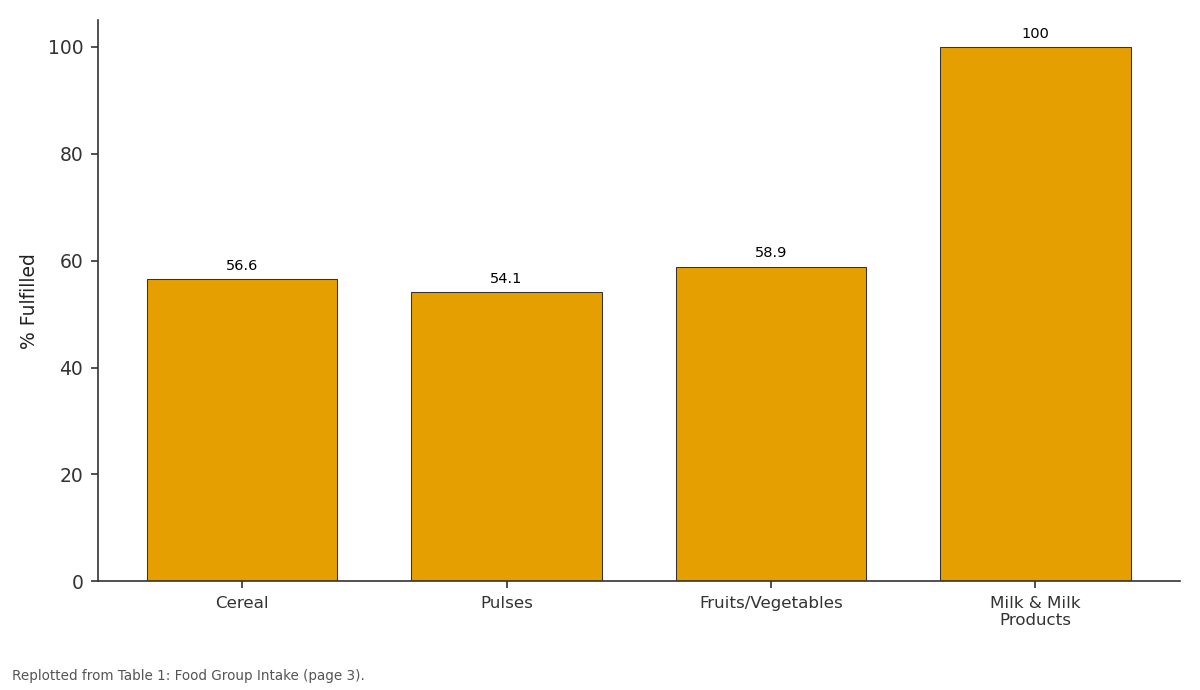
% Fulfilled: Cereal vs Pulses vs Fruits/Vegetables vs Milk & Milk Products
Replotted from Table 1 (page 3) of the original paper. Every bar is the paper's own table value.
View source evidence ↗Figures & tables
From the original paper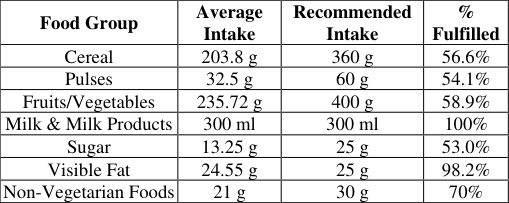 Table 1
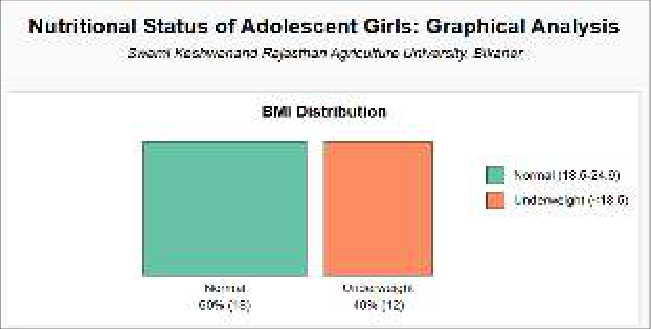 Figure 1
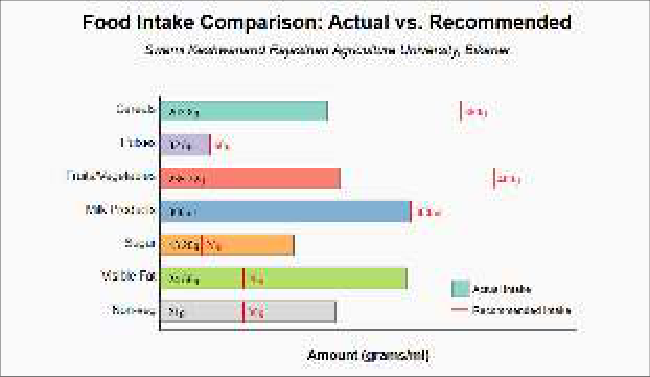 Figure 2
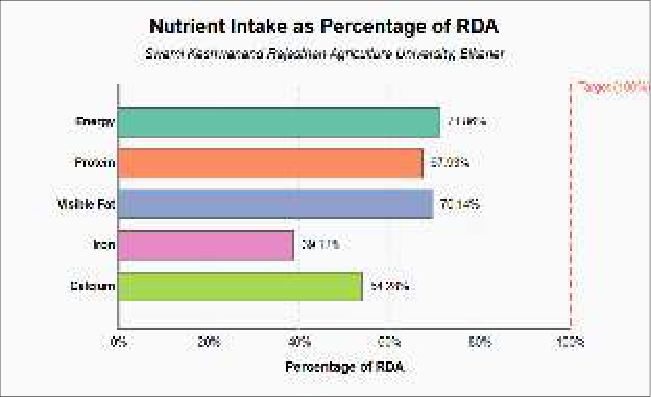 Figure 3
Introduction
Nutrition is fundamental to human life and plays a critical role in maintaining good health and contributing to societal well-being. According to the World Health Organization, adolescence spans ages 10 to 19 years and represents a crucial developmental period characterized by rapid physical growth, social, sexual and psychological development and the formation of adult identity. The nutritional status of adolescents significantly impacts their physical development and has far-reaching implications for their future reproductive health.
Adolescents constitute approximately 18% of the global population, with over 1.2 billion individuals in this age group worldwide. More than 90% of these adolescents reside in lowand middle-income countries (Mathur, 2008) [3] . In India specifically, there are over 253 million adolescents, representing about 20% of the country's total population (Sethi et al., 2019) [6] . The nutritional status of adolescent girls, in particular, is of paramount importance to a nation's development and success because of their future role in population growth and health. Anemia is a prevalent health concern among adolescent girls in India. Studies by UNICEF and the Indian Council of Medical Research (ICMR) have revealed low mean hemoglobin levels and inadequate nutritional intake of proteins, calories and both macro and micronutrients among adolescent girls (Sridhar et al., 2017) [8] . The availability of micronutrients significantly influences the nutritional status of adolescent girls, with micronutrient deficiency representing a critical nutritional challenge affecting both developing and developed nations. Nutritional status is a key indicator of individual health and is determined by a complex interplay of internal (Inherent) and external (environmental) factors. Internal factors include age, sex, dietary behavior, physical activity and diseases, while external factors encompass food security and socio-cultural and economic conditions. Optimal nutritional status occurs when nutrient supply meets nutritional requirements. Timely assessment of nutritional status is essential not only to identify existing problems but also to prevent potential issues. In recent years, there has been growing concern about the nutritional status of adolescent girls globally. Despite improvements in global health and nutrition, many adolescent girls continue to face significant nutritional challenges. These range from undernutrition and micronutrient deficiencies to overweight and obesity, often coexisting within the same communities or even households, creating a complex "double burden" of malnutrition. Concurrently, the lifestyle practices of adolescent girls have undergone considerable changes due to globalization, urbanization and technological advancements. Sedentary behaviors, altered sleep patterns, increased screen time and shifts in dietary habits have become increasingly prevalent. These changes have significant implications for nutritional status and overall health. Nutritional education can positively influence eating habits, improve dietary status and shift attitudes regarding unhealthy food consumption, all of which benefit individual health. Adolescents' nutritional status can be enhanced through education about their increasing dietary needs and through dietary supplementation with various nutrients.
This study aims to
Assess the overall nutritional status of adolescent girls (17-19 years). Evaluate dietary patterns and their correlation with nutritional status.
Materials and Methods
The present study titled "Nutritional Status and Lifestyle Practices of Adolescent Girls" was conducted at the College of Community Science, Swami Keshwan and Rajasthan Agricultural University (SKRAU), Bikaner. A total of thirty adolescent girls aged 17-19 years were selected using a random sampling technique from the student population of the college. A structured research tool was developed for data collection, encompassing various parameters. Background information was obtained from all participants, including age, food habits, social category, family type, income group and occupation of the family. Nutritional status was assessed through anthropometric measurements, biochemical estimations, clinical examinations and dietary intake evaluation. Anthropometric assessment was carried out using standard procedures. Body weight and height were measured using calibrated equipment and recorded to the nearest 0.1 kg and 0.1 cm, respectively. Body Mass Index (BMI) was calculated as weight in kilograms divided by height in meters squared (kg/m²), following Jelliffe (1966) [2] . Waist-to-hip ratio (WHR) was also determined to evaluate abdominal obesity and related non-communicable disease risk, with WHR > 0.8 considered high for females. Anthropometry plays a vital role in assessing nutritional status, as indicated by Raghuvanshi (2007) [5] and Shrilakshmi (2018) [7] , reflecting both acute and chronic dietary inadequacies. For biochemical estimation, hemoglobin levels were assessed using the cyanmethemoglobin method, which is widely recognized as the gold standard. Clinical examination was also conducted to identify any visible signs of nutritional deficiencies and general health conditions. Dietary intake was evaluated using the 24-hour dietary recall method. Respondents were asked to recall all foods and beverages consumed in the previous 24 hours. Standardized cups and spoons were used to estimate portion sizes, which were then converted into raw equivalents and analyzed using the Indian Food Composition Tables (IFCT, 2017) and "Diet Cal" software. Nutrient intake-including energy, protein, fat, fiber, calcium, iron, thiamine, riboflavin, vitamin A, folic acid, vitamin B6, vitamin C, vitamin E, vitamin B12and zinc-was calculated and compared with the Recommended Dietary Allowances (RDA) as per ICMR (2020). Percent adequacy of nutrient intake was derived using the formula: RDA% = (Nutrient Intake / RDA) × 100.
Data collection was carried out through direct personal interviews. Information on background characteristics, anthropometric indices, biochemical data, clinical signs and dietary intake was obtained systematically. The collected data were tabulated, classified and subjected to appropriate statistical analysis for interpretation and presentation.
Results
Results
Background Characteristics of Study Participants
The study included thirty adolescent female students aged between 17 and 19 years, all enrolled in the B.Sc. Community Science program at the College of Community Science, SKRAU, Bikaner. Among them, 76.6% adhered to a vegetarian diet, 16.6% were non-vegetarians and 6.6% were ova-vegetarians. With regard to social categories, 63.3% of participants belonged to the Other Backward Classes (OBC), followed by 23.3% from the General category, 6.6% from Scheduled Castes (SC)and 6.6% from Scheduled Tribes (ST). The family structure data revealed that 60% of the respondents were from nuclear families and 40% from joint families. Income-wise, the majority (86.6%) belonged to middle-income groups and the remaining 13.4% were from low-income households. Agriculture was the predominant family occupation (56.7%), followed by business (36.6%) and service sector employment (6.7%).
Nutritional Status Assessment Anthropometric Measurements
Body Mass Index (BMI) values were categorized according to World Health Organization (WHO) standards. Results showed that 40% of the participants were underweight (BMI <18.5), while the remaining 60% fell within the normal BMI range (18.5-24.9). None of the respondents were classified as overweight or obese. This underweight prevalence is lower than the 60.1% reported by Sridhar and Gauthami (2017) [8] , yet significantly higher than global findings such as those by Helena et al. (2018), who documented only 7.6% underweight prevalence among Brazilian adolescents. The high proportion of underweight participants reflects possible chronic energy deficiencies that could adversely affect present health and future reproductive outcomes. Waist-to-hip ratio (WHR) assessments revealed that 60% of the respondents had normal WHR values (<0.8), while 40% exhibited high WHR values (>0.8), indicating central adiposity. This combination of low BMI and elevated WHR in some participants is concerning, as it suggests the presence of "normal weight obesity," a condition linked to increased metabolic risks. These findings underscore the importance of using WHR alongside BMI to obtain a more comprehensive assessment of body composition and associated health risks.
Biochemical Assessment
Hemoglobin levels indicated widespread anemia among the participants. Only 16.7% had normal hemoglobin concentrations (12-16 g/dl), while a substantial 83.3% exhibited levels below 12 g/dl, confirming a high prevalence of anemia. This is significantly higher than the 44% prevalence reported by Sridhar and Gauthami (2017) [8] and surpasses national averages reported in recent health surveys. The dietary data showed extremely low iron intake (only 39.12% of RDA), which likely contributed to the elevated rates of anemia. It is particularly noteworthy that despite being students of nutrition, these adolescents demonstrated profound iron deficiency, suggesting gaps between theoretical knowledge and personal health practices.
Clinical Examination
Clinical assessments, which included evaluations of skin, hair, eyes, lips, nails, tongue, teethand general behavior, indicated that 90% of the participants appeared clinically normal, while 10% exhibited visible signs suggestive of nutritional deficiencies. These results suggest the presence of subclinical deficiencies that have not yet manifested as overt clinical symptoms but could progress if not addressed.
Dietary Assessment
An analysis of food group consumption revealed that the intake of cereals, pulses, fruitsand vegetables was significantly below recommended levels as per the Food Pyramid guidelines. Only milk and milk products met the recommended intake levels (Table1). This dietary imbalance translated directly into insufficient nutrient intake across several categories. Nutrient adequacy percentages were as follows: energy (71.86%), protein (67.93%), visible fat (70.14%), iron (39.12%) and calcium (54.28%). Among these, iron intake was the lowest, correlating with the high anemia prevalence observed in the biochemical assessments. To statistically evaluate nutrient inadequacies, a one-sample t-test was conducted, comparing the mean intake of key nutrients to the ICMR-recommended dietary allowances.
| Food Group | Average Intake | Recommended Intake | % Fulfilled |
|---|---|---|---|
| Cereal | 203.8 g | 360 g | 56.6% |
| Pulses | 32.5 g | 60 g | 54.1% |
| Fruits/Vegetables | 235.72 g | 400 g | 58.9% |
| Milk & Milk Products | 300 ml | 300 ml | 100% |
| Sugar | 13.25 g | 25 g | 53.0% |
| Visible Fat | 24.55 g | 25 g | 98.2% |
| Non-Vegetarian Foods | 21 g | 30 g | 70% |
Table text extracted from the original PDF; superscript letters are shown inline. The original table image is below.
View original table image
The results showed that energy (t = -5.61, p< 0.05) and calcium (t = -5.70, p< 0.05) intakes were significantly lower than the recommended levels, indicating serious dietary deficiencies in these nutrients. However, protein (t = 0.73, p > 0.05), visible fat (t = 1.85, p > 0.05) and iron (t = -1.36, p > 0.05) did not differ significantly from the RDA, although mean iron intake remained alarmingly low. These findings highlight the urgent need for targeted nutritional interventions, particularly to address energy and calcium deficiencies and reinforce the necessity of translating nutritional education into personal dietary improvements among adolescent girls.
Figures and tables from the paper
References
8 in the original paper- Indian Council of Medical Research (ICMR). Recommended dietary allowances and estimated average requirements for Indians. Hyderabad: National Institute of Nutrition; 2020.
- Jelliffe DB. The assessment of the nutritional status of the community. Geneva: World Health Organization; 1966. (WHO Monograph Series No. 53).
- Mathur JS. Preventive and social medicine: A comprehensive textbook. New Delhi: CBS Publishers and Distributors; 2008.
- National Institute of Nutrition (NIN). Dietary guidelines for Indians: A manual. Hyderabad: Indian Council of Medical Research; 2011.
- Raghuvanshi RS. Nutritional status and food related tradition of Rajasthanis. Bikaner: S.K. Rajasthan Agricultural University; 2007.
- Sethi V, Lahiri A, Bhatia V, Kumar A, Jena S, Khandelwal R, et al. Adolescents, diets and nutrition: Growing well in a changing world. Comprehensive National Nutrition Survey. New Delhi: Ministry of Health and Family Welfare, Government of India, UNICEF and Population Council; 2019.
- Shrilakshmi B. Dietetics. New Delhi: New Age International Publishers; 2018.
- Sridhar D, Gauthami N. Nutritional status of adolescent tribal girls: A community-based study. Med Pulse Int J Community Med. 2017;4(1):1-4.