
Research article · 2025 · Full text
International Journal of Agriculture and Food ScienceConsumer views on organised vs unorganised fruits &vegetables markets in Nagpur
Volume 7(8) · Pages 296–299 · DOI: 10.33545/2664844x.2025.v7.i8e.624 ↗
Research areasEconomic, financial, and policy analysisEconomic Growth and ProductivityGerman Economic Analysis & Policies
Abstract
Author-writtenThis research paper explores consumer perceptions of organised versus unorganised fruits and vegetables retail markets in Nagpur district, using both quantitative and qualitative data collected from 100 respondents. It examines socio-economic profiles, purchasing behaviours, and key decision-making factors such as quality, pricing, freshness, convenience, and service. Findings indicate that while organised markets appeal to younger, educated, and higher-income consumers due to superior quality and services like online payments and home delivery, unorganised markets remain popular for their affordability, flexibility, and personal relationships. Organised market consumers reported higher spending per visit, whereas unorganised markets saw more frequent purchases. The study concludes with strategic implications for improving retail experiences in both formats and suggests a hybrid model to support inclusive growth in the city’s retail sector.
Summary
Source-checkedPlain-language reading of the full paper, prepared with AI and checked against the text. Each point links to the authors' own words.
Why it matters
- India's retail sector is split between traditional unorganised markets (like hawkers and local shops) and growing organised retail, which offers more structure and hygiene. View evidence ↗
- The fruit and vegetable retail segment is particularly challenging because the products are perishable, seasonal, and sensitive to price changes. View evidence ↗
- In Nagpur, both organised and unorganised retail formats coexist and compete for the preference of consumers. View evidence ↗
The question
- The study aims to understand the socio-economic profiles, purchasing behaviors, and decision-making factors of consumers buying fruits and vegetables in Nagpur. View evidence ↗
What they did
- The research was conducted during the 2024-25 financial year. View evidence ↗
- Data was gathered using a pre-structured questionnaire administered to customers of both market types. View evidence ↗
- The researchers used simple tabular methods to analyze the collected data. View evidence ↗
What they found
- Younger consumers (up to 30) show a stronger preference for organised retail (38%) compared to unorganised markets (16%). View evidence ↗
- Payment methods differ sharply: 82% of organised market consumers use credit or digital methods, whereas 76% of unorganised market consumers use cash. View evidence ↗
What it means
- The authors conclude that organised retail attracts modern, high-income customers, while unorganised markets remain popular due to accessibility and freshness. View evidence ↗
Visual summary
2 visualsIllustrations explain the paper; charts are replotted from the paper's own table values.
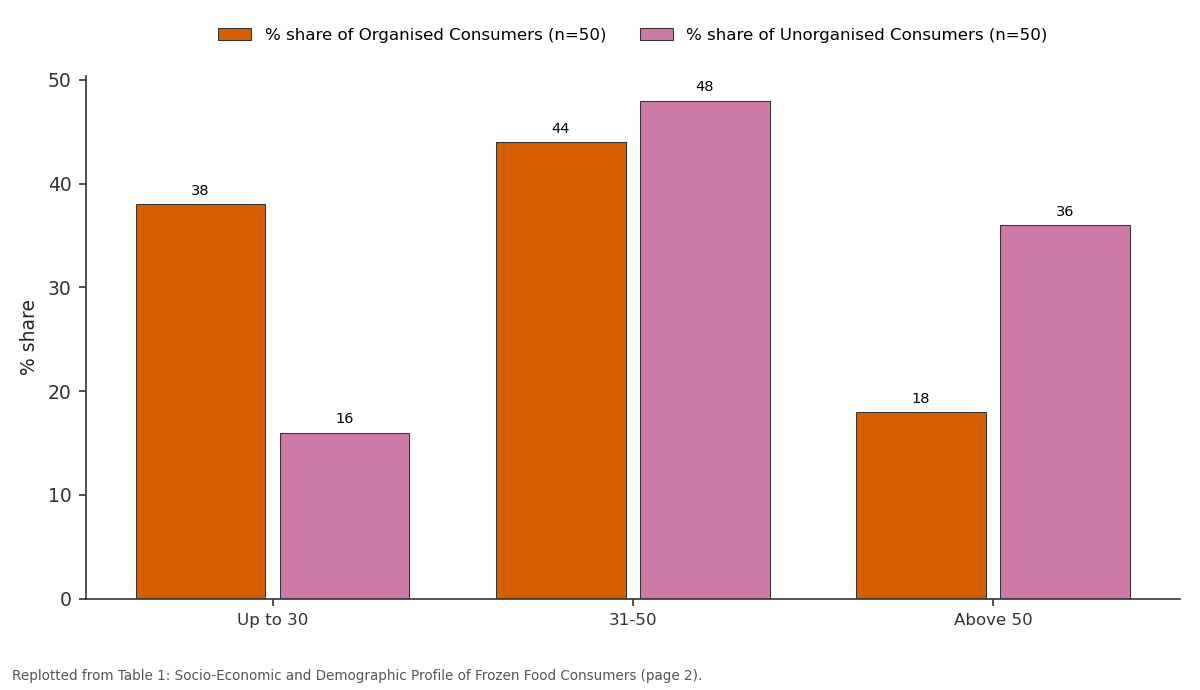
% share of Organised Consumers (n=50) and % share of Unorganised Consumers (n=50): Up to 30 vs 31-50 vs Above 50
Replotted from Table 1 (page 2) of the original paper. Every bar is the paper's own table value.
View source evidence ↗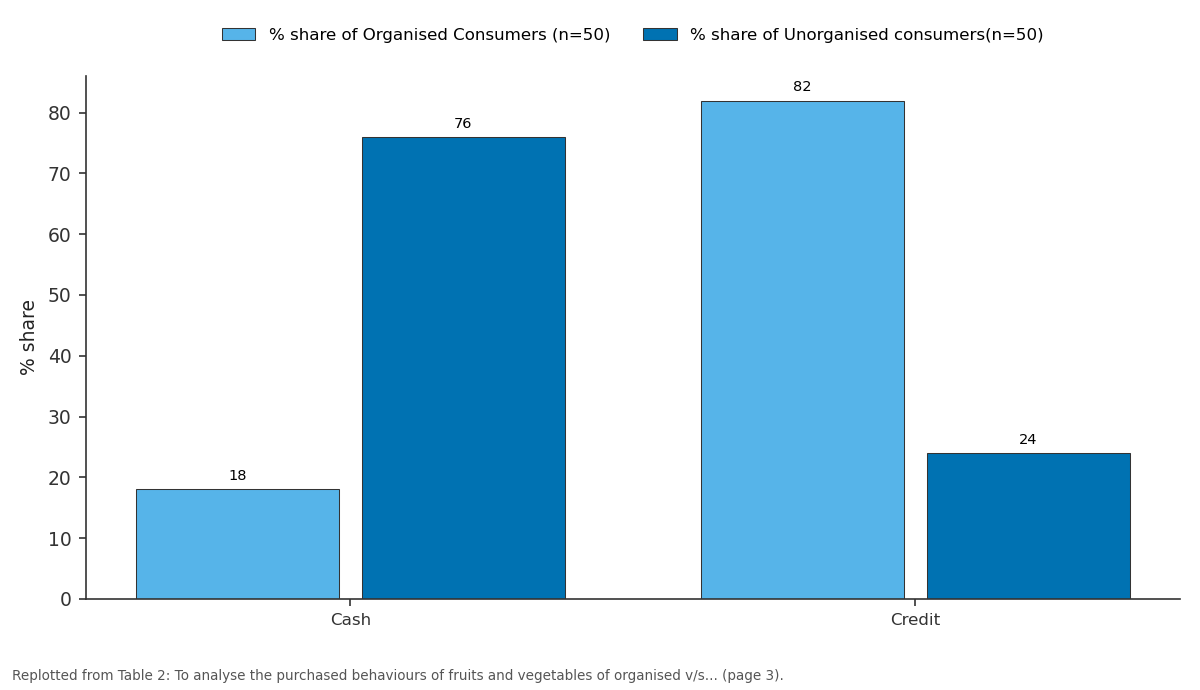
% share of Organised Consumers (n=50) and % share of Unorganised consumers(n=50): Cash vs Credit
Replotted from Table 2 (page 3) of the original paper. Every bar is the paper's own table value.
View source evidence ↗Figures & tables
From the original paper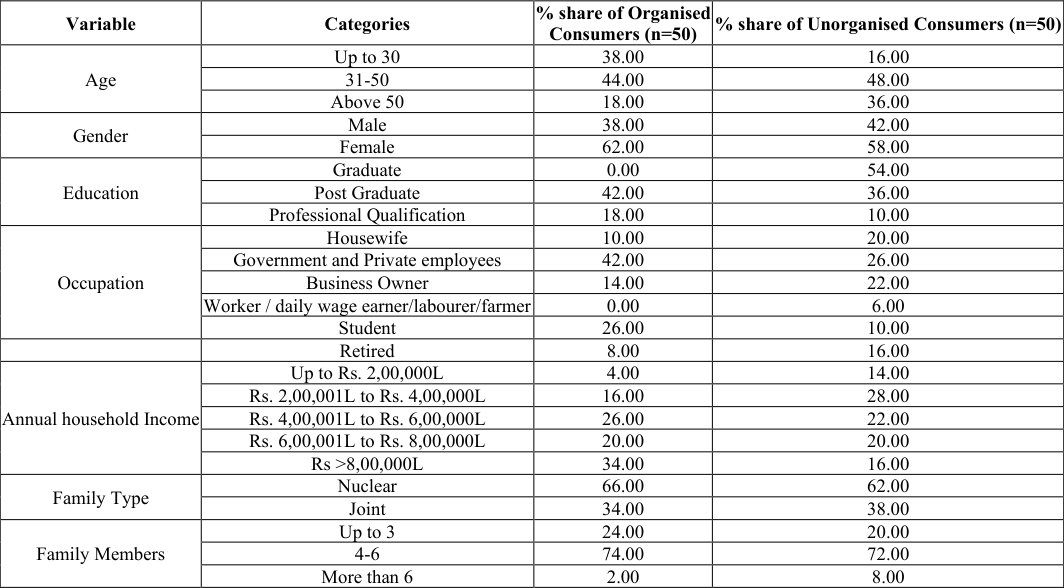 Table 1
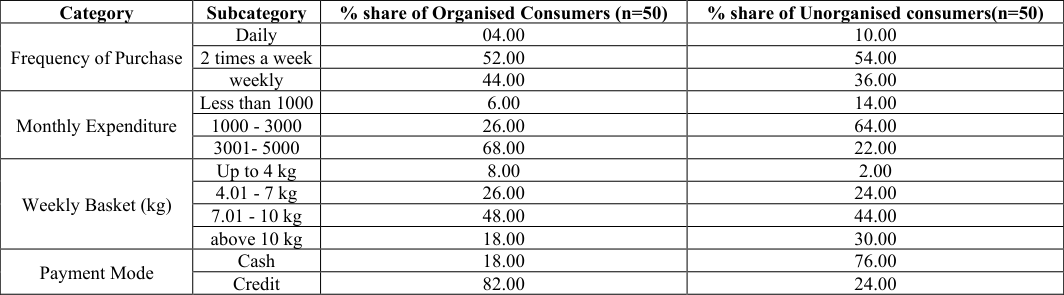 Table 2
 Table 3
 Table 4
Introduction
Retailing plays a pivotal role in connecting producers with consumers by facilitating the distribution of goods and services for final consumption. Over time, this sector has evolved from informal marketplaces and street vendors to modern, organised retail formats like supermarkets and online platforms. In India, the retail sector is broadly divided into organised and unorganised segments. While unorganised retail-comprising local kirana shops, hawkers, and weekly markets-remains deeply embedded in everyday consumer life, organised retail is gaining ground in urban centres by offering structured operations, enhanced hygiene, transparent pricing, and better customer service. The fruits and vegetables (F&V) segment presents unique challenges and opportunities within the retail landscape due to the perishable nature, seasonality, and price sensitivity of these products. Traditionally, unorganised sellers such as roadside vendors and local mandis have dominated this space by offering consumers fresh produce, familiarity, and price negotiation. However, with urbanisation and increasing awareness of health, hygiene, and convenience, organised retail is entering the F&V sector through supermarkets and digital platforms that promise better quality control, packaging, and consistent availability. This shift is particularly visible in cities like Nagpur, where both formats coexist and compete for consumer preference. Given these developments, it becomes essential to explore how consumers perceive and compare these two retail systems. This study focuses on understanding the socio-economic profiles of consumers, their purchasing behaviours, and the factors influencing their decisions when buying fruits and vegetables. By analysing consumer preferences in Nagpur district, the research seeks to generate insights that can help both retailers and policymakers improve service delivery, product offerings, and customer satisfaction in an evolving retail environment.
Methodology
The study was carried out in Nagpur city, Maharashtra, where the concept of organised fruit and vegetable retailing is still in its early stages. As the organised market continues to develop, understanding consumer perception becomes essential for both existing and new retailers to align their offerings with customer expectations and improve service delivery in this emerging retail format. The research was conducted for the financial year 2024-25. This period was selected to capture recent trends in consumer behaviour and purchasing patterns, reflecting the evolving preferences in the urban and semi-urban markets of Nagpur. This timeframe provides current and relevant insights into how consumers interact with different Retail Formats for their fruit and vegetable needs. Primary data was collected using a pre-structured questionnaire, targeting customers who purchase fruits and vegetables from both organised and unorganised markets. Respondents were chosen from various localities within Nagpur city to ensure diversity in demographics and shopping experiences. This helped in capturing a broad spectrum of consumer behaviour across different retail environments. A total of 100 respondents participated in the study, with an equal split-50 buyers each from organised and unorganised markets. This balanced sampling approach enabled a comparative analysis of consumer attitudes, experiences, and preferences between the two market types. The analysis was carried out using simple tabular methods. Socio-economic variables such as age, gender, income, occupation, education, and family size were examined. In addition, consumer buying behaviour was analysed through factors like frequency of purchase, payment mode, basket size (in rupees and kilograms), monthly expenditure, and reasons for market preference. Suggestions for improvement were also recorded to provide actionable insights for retailers in both segments.
Results and Discussion
The results of the present paper are presented as below. The results are arranged as per the objective taken. The analysis of purchasing behaviour between organised and unorganised fruit and vegetable markets reveals notable differences across several dimensions. In terms of purchase frequency, the majority of consumers in both markets shop two times a week (organised: 52%, unorganised: 54%), followed by weekly purchases (organised: 44%, unorganised: 36%). Daily purchases are more common in unorganised markets (10%) compared to organised ones (4%). When looking at monthly expenditure, a larger share of organised market consumers spend between ₹3001-5000 (68%), whereas in unorganised markets, most consumers spend ₹1000-3000 (64%). Regarding weekly quantity purchased, both market types show similar preferences for 7.01-10 kg baskets (organised: 48%, unorganised: 44%), although more consumers in unorganised markets purchase over 10 kg (30%) compared to organised ones (18%). Finally, payment preferences differ significantly-while only 18% of consumers in organised markets use cash (compared to 76% in unorganised), the vast majority prefer credit or digital methods in organised setups (82%), highlighting the modern infrastructure and convenience offered by organised retailers. The table presents consumer perceptions of various aspects of organised fruit and vegetable markets based on a rating scale from Excellent (5) to Bad (1). Freshness (94%) and quality (100%) received overwhelmingly positive feedback, with the majority rating them as Excellent, Good, or Satisfactory. Convenience in terms of location was also highly appreciated, with 96% of consumers expressing satisfaction. Hygiene was considered satisfactory or better by 90%, though only a small percentage rated it Excellent (4%). Pricing was viewed more moderately-only 8 rated it as Excellent, while most consumers considered it Good or Satisfactory. Notably, discounts and offers were the least satisfying factor, with a significant number rating this aspect as Average (25) or Bad (15), suggesting that organised markets may lack competitive promotional strategies. Customer service was generally well-received, with most ratings falling in the Excellent to Good range. Overall, consumers valued quality, freshness, and convenience most, while pricing and promotional offers appeared to be areas for improvement.
Conclusion
The study highlights clear demographic and behavioural differences between consumers of organised and unorganised fruit and vegetable markets in Nagpur.
Organised market consumers are generally younger, more educated, and from higher income groups, while unorganised markets cater to a broader spectrum including older individuals, housewives, and low-to middle-income earners. Both market types are primarily visited by nuclear families with 4-6 members, and females play a central role in household food purchases. Organised markets attract students and professionals, while unorganised markets serve a more traditional and diverse occupational base.
In terms of purchasing behaviour and influencing factors, organised market consumers prefer digital payments and tend to spend more monthly, while unorganised market buyers use cash and buy larger volumes more frequently. Consumers in both markets value freshness, quality, and location convenience. However, discounts and offers received lower satisfaction ratings, particularly in organised markets. While organised retail appeals to modern, higherincome customers with structured services, unorganised markets remain popular for their accessibility, freshness, and customer service, despite pricing inconsistencies and limited promotional benefits.
Figures and tables from the paper
| Variable | Categories | % share of Organised Consumers (n=50) | % share of Unorganised Consumers (n=50) |
|---|---|---|---|
| Age | Up to 30 | 38.00 | 16.00 |
| 31-50 | 44.00 | 48.00 | |
| Above 50 | 18.00 | 36.00 | |
| Gender | Male | 38.00 | 42.00 |
| Female | 62.00 | 58.00 | |
| Education | Graduate | 0.00 | 54.00 |
| Post Graduate | 42.00 | 36.00 | |
| Professional Qualification | 18.00 | 10.00 | |
| Occupation | Housewife | 10.00 | 20.00 |
| Government and Private employees | 42.00 | 26.00 | |
| Business Owner | 14.00 | 22.00 | |
| Worker / daily wage earner/labourer/farmer | 0.00 | 6.00 | |
| Student | 26.00 | 10.00 | |
| Retired | 8.00 | 16.00 | |
| Annual household Income | Up to Rs. 2,00,000L | 4.00 | 14.00 |
| Rs. 2,00,001L to Rs. 4,00,000L | 16.00 | 28.00 | |
| Rs. 4,00,001L to Rs. 6,00,000L | 26.00 | 22.00 | |
| Rs. 6,00,001L to Rs. 8,00,000L | 20.00 | 20.00 | |
| Rs >8,00,000L | 34.00 | 16.00 | |
| Family Type | Nuclear | 66.00 | 62.00 |
| Joint | 34.00 | 38.00 | |
| Family Members | Up to 3 | 24.00 | 20.00 |
| 4-6 | 74.00 | 72.00 | |
| More than 6 | 2.00 | 8.00 |
Table text extracted from the original PDF; superscript letters are shown inline. The original table image is below.
View original table image
| Category | Subcategory | % share of Organised Consumers (n=50) | % share of Unorganised consumers(n=50) |
|---|---|---|---|
| Frequency of Purchase | Daily | 04.00 | 10.00 |
| 2 times a week | 52.00 | 54.00 | |
| weekly | 44.00 | 36.00 | |
| Monthly Expenditure | Less than 1000 | 6.00 | 14.00 |
| 1000 - 3000 | 26.00 | 64.00 | |
| 3001- 5000 | 68.00 | 22.00 | |
| Weekly Basket (kg) | Up to 4 kg | 8.00 | 2.00 |
| 4.01 - 7 kg | 26.00 | 24.00 | |
| 7.01 - 10 kg | 48.00 | 44.00 | |
| above 10 kg | 18.00 | 30.00 | |
| Payment Mode | Cash | 18.00 | 76.00 |
| Credit | 82.00 | 24.00 |
Table text extracted from the original PDF; superscript letters are shown inline. The original table image is below.
View original table image
| Sr. No. | Particulars | Yes | Excellent (5) | Satisfactory (4) | Good (3) | Average (2) | Bad (1) |
|---|---|---|---|---|---|---|---|
| 1 | Prices | 35 | 8 | 19 | 22 | 1 | 0 |
| 2 | Freshness | 47 | 30 | 13 | 7 | 0 | 0 |
| 3 | Hygiene | 38 | 2 | 23 | 21 | 4 | 0 |
| 4 | Quality | 50 | 12 | 26 | 11 | 1 | 0 |
| 5 | convenience(closer Location) | 48 | 7 | 30 | 13 | 0 | 0 |
| 6 | Discounts and offers | 47 | 1 | 1 | 8 | 25 | 15 |
| 7 | Customer Services | 40 | 11 | 18 | 18 | 3 | 0 |
Table text extracted from the original PDF; superscript letters are shown inline. The original table image is below.
View original table image
| Sr. No. | Particulars | Yes | Excellent (5) | Satisfactory (4) | Good (3) | Average (2) | Bad (1) |
|---|---|---|---|---|---|---|---|
| 1 | Prices | 41 | 19 | 30 | 1 | 19 | 0 |
| 2 | Freshness | 48 | 2 | 29 | 19 | 0 | 0 |
| 3 | Hygiene | 45 | 44 | 5 | 1 | 0 | 0 |
| 4 | Quality | 40 | 50 | 24 | 16 | 2 | 1 |
| 5 | convenience(closer Location) | 42 | 23 | 26 | 1 | 0 | 0 |
| 6 | Discounts and offers | 36 | 9 | 28 | 10 | 3 | 0 |
| 7 | Customer Services | 44 | 5 | 32 | 13 | 0 | 0 |
Table text extracted from the original PDF; superscript letters are shown inline. The original table image is below.
View original table image
References
9 in the original paper- Abhishek S, Ram CS, Singh AM, Mathur. Factors influencing customer's online purchase decision of vegetables. Int J Stat Appl Math. 2023.
- Balaji MS. Factors Influencing Consumers' Choice of Vegetable Purchase Location: A Behavioral Perspective. 2015.
- Balasubramanian S, Konana P, Menon NM. Customer satisfaction in virtual environments: A study of online investing. Manage Sci. 2003.
- Banerjee S. A study of socio-economic conditions of vegetable street vendors in Ranchi. Jharkhand J Soc Dev. 2014;VII(1&2):1-9.
- Bharathi B, Nagaraja GN. Socio-economic profiles of bank customers among rural commodities: A study in Chikkaballapur district. Agric Update. 2014;9(2):161165.
- Boliya B, Jain M, KJ. Buying behavior in fruit and vegetable category. In: Seminar paper. Somaiya Institute of Management Studies and Research; 2010.
- Burke RR. Technology and the customer interface: What consumers want in the physical and virtual store. J Acad Mark Sci. 2002.
- Chaudhary S, Sharda S. Consumer Perception towards Organized Retail Store: A Factor Analytical Approach. Pac Bus Rev Int. 2017;9(7):14-23.
- Chikkamath M, Atteri BR, Srivastava SK, Roy S. Factors influencing consumers' behaviour for vegetable purchase. Veg Sci. 2012;39(1):35-39.