
Research article · 2025 · Full text
International Journal of Agriculture and Food ScienceComparative analysis of consumption patterns and purchase behaviour of loose and packed milk consumers in Latur district of Maharashtra
Volume 7(8) · Pages 300–304 · DOI: 10.33545/2664844x.2025.v7.i8e.625 ↗
Research areasAgricultural Economics and Practices
Abstract
Author-writtenThis study examines consumption patterns and purchase decisions of consumers towards organized (packed) and unorganized (loose) milk in Latur, Maharashtra. Based on a structured survey of 120 respondents, 60.83% prefer loose milk while 39.17% opt for packed milk. Packed milk is primarily consumed for beverages such as tea and coffee, driven by hygiene and safety concerns, whereas loose milk is preferred for traditional dairy products like curd and buttermilk due to affordability and cultural habits. A structural model of family consumption behaviour analyses reveal that socioeconomic factors including family size, monthly income, occupation, and brand preference significantly impact milk purchase behaviour. These findings provide insights for dairy marketers and policymakers to tailor strategies addressing consumer needs and improving sector growth.
Summary
Source-checkedPlain-language reading of the full paper, prepared with AI and checked against the text. Each point links to the authors' own words.
Why it matters
- Milk is a staple of the daily Indian diet and is used in many forms, including beverages and traditional dairy products. View evidence ↗
- The Indian dairy supply chain is split between an organized sector of branded companies and an unorganized sector of local vendors providing loose milk. View evidence ↗
- There is a lack of detailed knowledge regarding the specific drivers of milk consumption behavior at the micro-market level. View evidence ↗
The question
- The study aims to compare the consumption patterns and purchase decisions for loose versus packed milk in Latur City, Maharashtra. View evidence ↗
What they did
- The researchers used a descriptive and analytical design, collecting data from 120 consumers in and around Latur via convenience sampling. View evidence ↗
- Data was gathered using a structured questionnaire covering demographics, consumption patterns, and purchase behavior. View evidence ↗
- Analysis included descriptive statistics (means and weighted averages) and the development of two separate structural models for loose and packed milk consumption. View evidence ↗
What they found
- A majority of consumers (60.83%) prefer loose milk, while 39.16% prefer packed milk. View evidence ↗
- Hygiene and safety are the most important factors for consumers purchasing packed milk, with a weighted average of 4.70. View evidence ↗
- In the loose milk model, demographics significantly influence socioeconomic status (0.47), which in turn significantly shapes purchase behavior (0.47). View evidence ↗
- For packed milk, purchase dynamics have the strongest direct effect (0.85) on the daily quantity of milk consumed. View evidence ↗
- Monthly family income is a key mediator for packed milk, influenced equally by demographics and socioeconomic status (0.52 each) and strongly influencing purchase behavior (0.60). View evidence ↗
What it means
- The authors conclude that loose milk use is driven by tradition and necessity, while packed milk use is driven by income, modern lifestyles, and informed preferences. View evidence ↗
- The authors recommend educating vendors and consumers on hygiene for loose milk to reduce contamination risks. View evidence ↗
Visual summary
2 visualsIllustrations explain the paper; charts are replotted from the paper's own table values.
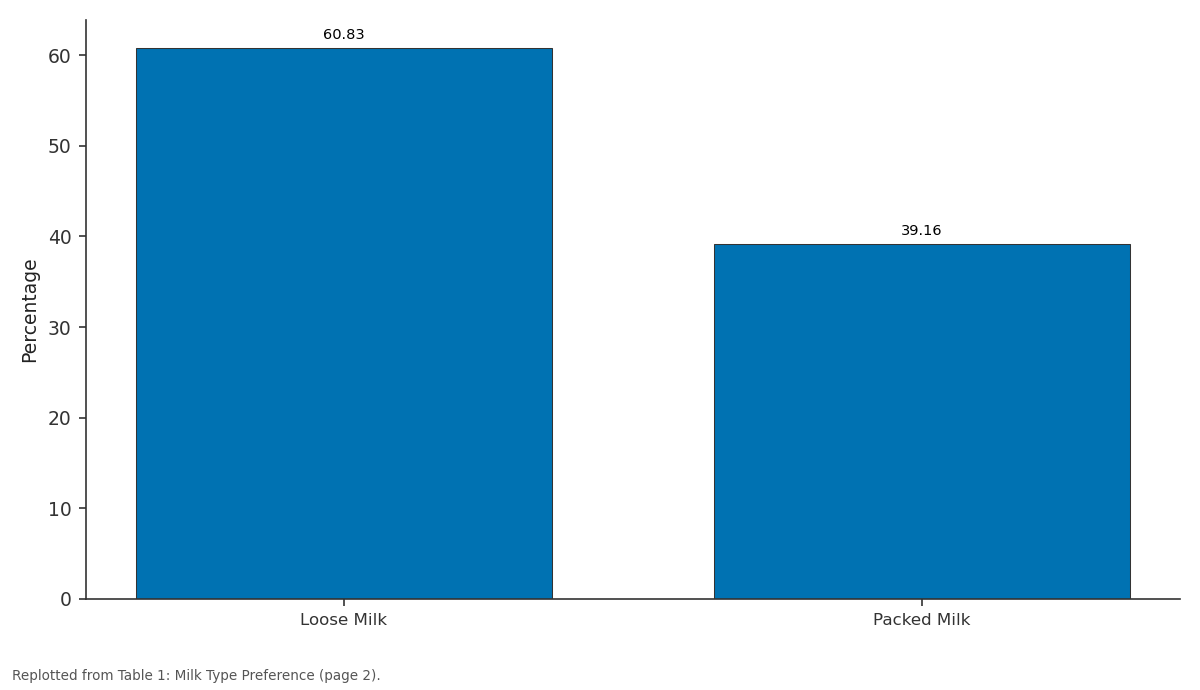
Percentage: Loose Milk vs Packed Milk
Replotted from Table 1 (page 2) of the original paper. Every bar is the paper's own table value.
View source evidence ↗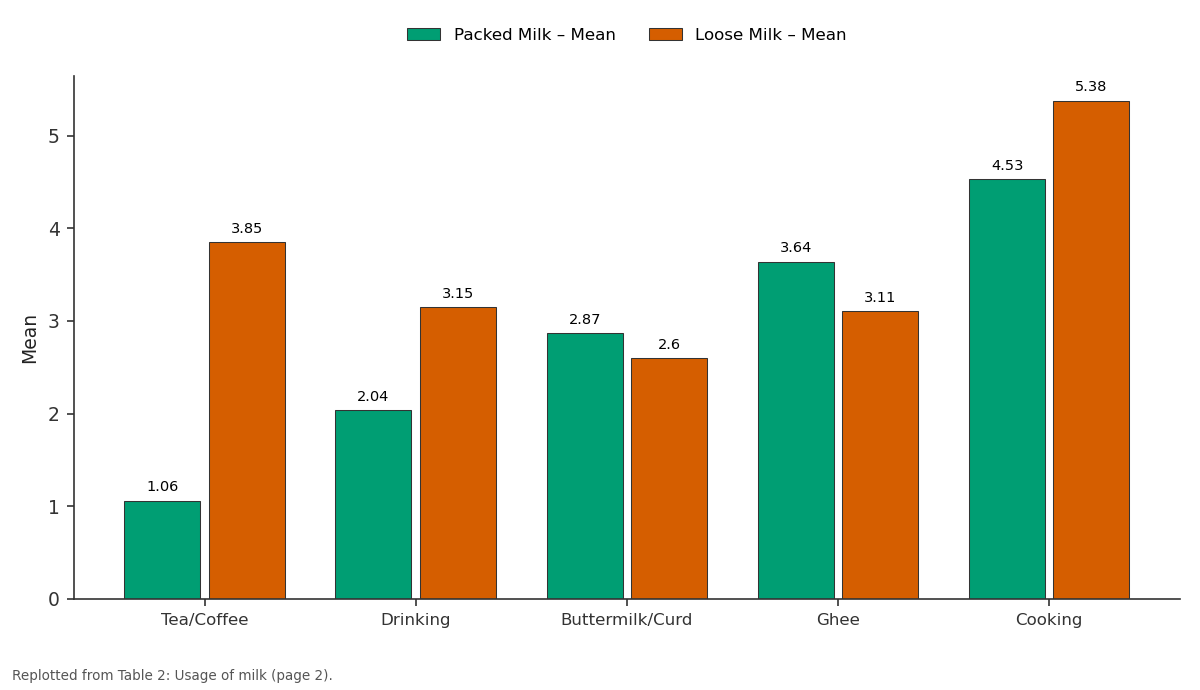
Packed Milk – Mean and Loose Milk – Mean: Tea/Coffee vs Drinking vs Buttermilk/Curd vs Ghee vs Cooking
Replotted from Table 2 (page 2) of the original paper. Every bar is the paper's own table value.
View source evidence ↗Figures & tables
From the original paper Table 1
 Table 2
 Table 3
 Table 4
 Table 5
 Table 6
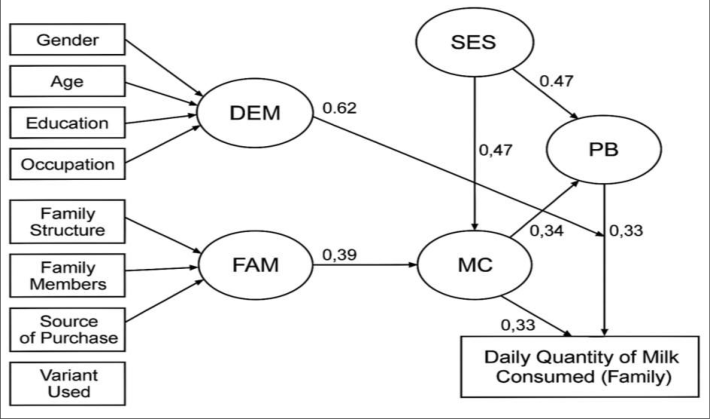 Figure 1
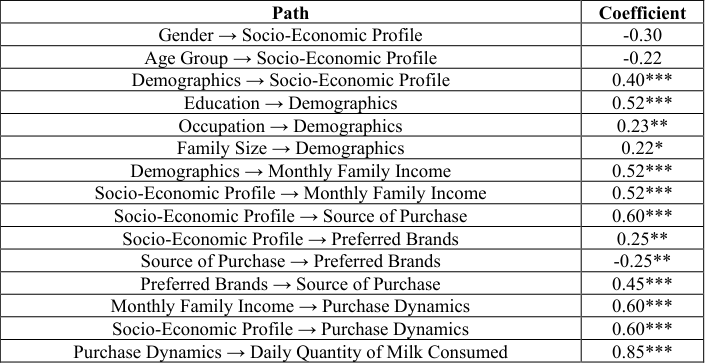 Table 7
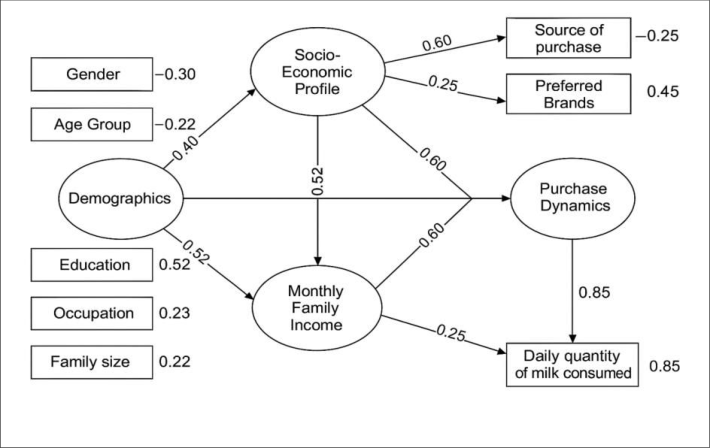 Figure 2
Introduction
Milk is a fundamental part of the daily diet in India, consumed in a wide variety of forms such as tea, coffee, curd, paneer, ghee, and various sweets. The country ranks as the world's largest producer and consumer of milk, with its dairy sector forming a vital pillar of both rural livelihood and national nutrition security. India's dairy supply chain features a unique dual structure: the organized sector, consisting of branded companies and cooperatives like Amul, Gokul, and Mother Dairy; and the unorganized or informal sector, comprising local milkmen and vendors, who deliver loose milk directly to households. The choice between packed (organized) and loose (unorganized) milk is influenced by a combination of factors-economic, cultural, demographic, and perceptual. Consumers often weigh the advantages of cost, freshness, and local trust in loose milk against the hygiene, safety, and convenience offered by packed milk. With rapid urbanization, increased literacy, and greater food safety awareness, Indian households are progressively re-evaluating their daily consumption patterns. In recent years, food scandals, rising incomes, and the proliferation of organized retail in semi-urban and urban areas have sped up the shift in buying behaviour. Consumers in cities like Latur are becoming more conscious of health and hygiene and are thus more receptive to branded milk offerings that assure quality and safety standards. Still, a significant section of the population continues to prefer loose milk due to traditional habits, perceived freshness, price sensitivity, and established relationships with local suppliers. Despite the presence of a growing organized dairy sector, there is a persistent knowledge gap regarding actual consumption behaviours and the drivers behind them at a micro-market level. Understanding these patterns is crucial for dairy marketers, policymakers, public health planners, and cooperative leaders to ensure greater food security, efficient retail strategies, rural livelihood support, and better nutritional outcomes. This study aims to address this gap by providing an in-depth comparative analysis of the consumption patterns of loose and packed milk and purchase decisions in Latur City, Maharashtra.
By analysing survey data through structured models, the research sheds light on the multifaceted motivations of urban and rural dairy consumers and offers actionable recommendations for the dairy sector's ongoing transformation in India.
Methodology Research Design and Sampling
A descriptive and analytical design was adopted for the study, with data collected from 120 consumers in Latur and nearby areas using convenience sampling. The respondents, who represented diverse demographic and socioeconomic backgrounds, included both packed milk users and loose milk users, allowing for analysis and comparison of consumption patterns, preferences, and purchase behaviours between these two groups.
Data Collection and Variables
A structured questionnaire was employed to systematically collect data on various aspects of milk consumption and purchase behaviour among households. The questionnaire gathered demographic information such as gender, age, education, occupation, family structure, income, and the number of earners in the family. It also assessed milk consumption patterns, including the type of milk consumed (loose or packed), quantity consumed, and the purposes of use-such as for tea, drinking, curd preparation, or cooking. Additionally, the questionnaire examined purchase behaviour by investigating brand preferences, sources of purchase, and key factors influencing consumer choices like hygiene and availability. This approach enabled a comprehensive analysis of how demographic variables influence milk consumption and buying decisions.
Analysis Techniques
Data analysis involved the use of descriptive statistics, including the calculation of weighted averages and means, and specifically, two structural models were developed: one for family consumption behaviour for loose milk, and another for family consumption behaviour for packed milk.
Results and Discussion
The following section presents the findings of the study based on consumer responses regarding milk consumption behavior in Latur city. The analysis focuses on three key aspects: the type of milk preferred by consumers (loose or packed), the pattern of milk usage for different household purposes, and the factors influencing the purchase decisions of packed milk. These insights are presented in tabular format to highlight comparative preferences, ranked usage purposes, and weighted importance of various influencing factors. The structural model highlights the interconnected influence of demographic, socioeconomic, and behavioral factors on milk consumption patterns. Demographic characteristicssuch as age, gender, education, and occupation-exert a strong positive influence on a household's socioeconomic status (path coefficient = 0.62). This suggests that individuals with higher educational attainment and stable occupations are more likely to have greater earning potential, which in turn elevates their socioeconomic standing. Socioeconomic status, in itself, significantly shapes purchase behavior (coefficient = 0.47), indicating that families with higher income levels and multiple earners tend to make more consistent and informed decisions when it comes to choosing between loose and packed milk. Purchase behavior plays a pivotal dual role in influencing both the mindset and the actual milk consumption in households. It directly impacts the milk consumption approach (PB → MC = 0.34), reflecting how attitudes and decision-making habits affect usage patterns. Additionally, purchase behavior directly correlates with the quantity of milk consumed (PB → Quantity = 0.33), showing that the way families choose their milk source has measurable consequences on daily consumption volumes. Furthermore, the behavior surrounding milk consumption-such as preferences and frequency-translates into actual usage (MC → Quantity = 0.33), highlighting that positive attitudes and regular consumption habits lead to greater intake. Lastly, the family context also plays a vital role in shaping overall milk consumption. The structure and size of the family (FAM) significantly influence purchase and consumption behaviors (coefficient = 0.39). Larger or joint families typically require more milk, although the model does not show a strong direct impact on the quantity consumed. Nevertheless, family dynamics remain an important factor in understanding consumption trends.
A structural model of family consumption behaviour for Packed milk
To understand the key factors influencing the consumption of packed milk at the household level, a Structural Equation Modeling (SEM) approach was used. The model defines several latent constructs derived from observed variables, which together help explain consumer decision-making and consumption behavior for packed milk. The structural model reveals a comprehensive interplay between demographic characteristics, socioeconomic factors, and consumer purchase behavior in determining milk consumption patterns. The overall demographic profile-including gender, age group, and family structurehas a significant positive influence on the socio-economic profile (path coefficient = 0.40), indicating that these basic attributes are foundational in shaping income levels, occupation types, and economic stability. Education emerges as the most influential factor in shaping demographic structure (0.52), followed by occupation (0.23), reinforcing the notion that individuals with higher educational attainment and more stable jobs tend to belong to more economically structured households. The socio-economic profile (SEP) plays a crucial role in influencing consumer decisions. It significantly affects the source of milk purchase (0.60), brand preferences (0.25), and overall purchase dynamics (0.60), suggesting that consumers from higher socioeconomic backgrounds are more likely to opt for organized sources and specific milk brands. A notable bidirectional relationship exists between the choice of source and brand preference. While source positively impacts brand preference (0.45), brand preference appears to negatively influence source choice (-0.25), indicating that consumers may shift between sources based on brand availability or trust. Monthly income acts as a key mediating factor in this model. Both demographics and socioeconomic status have an equal and strong effect (0.52 each) on monthly family income, which, in turn, significantly influences purchase behavior (0.60). This underscores the importance of disposable income in guiding consumer choices, especially when it comes to selecting between loose and packed milk. Finally, the most influential path in the entire model is the direct effect of purchase dynamics on the daily quantity of milk consumed (0.85), emphasizing that actual consumption is a direct outcome of household purchase decisions-such as source, brand alignment, and quantity preferences.
Conclusion
The study provides a comprehensive analysis of consumer behavior toward loose and packed milk consumption in Latur city, Maharashtra. The findings reveal significant insights into consumption patterns, usage behavior, influencing factors, and the underlying decision-making structures in households.
The initial analysis indicates that loose milk is still the preferred choice for a majority of consumers (60.83%), although packed milk also has a notable share (39.16%). Usage patterns show that packed milk is primarily used for tea/coffee and drinking, whereas loose milk is more commonly used for traditional purposes like curd/buttermilk and ghee preparation. This suggests that traditional habits and cultural preferences continue to influence milk usage in Indian households. Further, weighted factor analysis highlights that consumers of packed milk prioritize hygiene, availability, and shelf life as the most important considerations when making purchase decisions. Convenience and brand trust, while relevant, are secondary.
To better understand these behaviors, two Structural Equation Models (SEMs) were developed:
• The structural model for loose milk indicates that demographic factors and family context significantly shape socioeconomic status and purchase behavior, which in turn impact the quantity of milk consumed.
Here, purchase behavior and family size were direct predictors of daily milk consumption, showing that practical household dynamics heavily influence loose milk use. • The model for packed milk reveals a more complex decision-making structure, where education, occupation, income, and brand preference play significant roles. The path coefficients showed that socioeconomic status and purchase dynamics are the strongest drivers of packed milk consumption. The interaction between brand preference and source of purchase further reflects the evolving behavior of urban consumers who balance between quality, trust, and accessibility.
In summary, loose milk consumption is driven by tradition and necessity, whereas packed milk consumption is shaped by modern lifestyle factors, income levels, and informed preferences. Understanding these distinctions is crucial for marketers, dairy processors, and policymakers to design targeted interventions, improve milk supply chains, and promote quality milk consumption across different consumer segments.
Figures and tables from the paper
| Type of milk used | Frequency | Percentage |
|---|---|---|
| Loose Milk | 73 | 60.83% |
| Packed Milk | 47 | 39.16% |
Table text extracted from the original PDF; superscript letters are shown inline. The original table image is below.
View original table image
| Sr. No. | Usage Purpose | Packed Milk – Mean | Packed Rank | Packed Interpretation | Loose Milk – Mean | Loose Rank | Loose Interpretation |
|---|---|---|---|---|---|---|---|
| 1 | Tea/Coffee | 1.06 | I | Always | 3.85 | IV | Rarely |
| 2 | Drinking | 2.04 | II | Mostly | 3.15 | II | Mostly |
| 3 | Buttermilk/Curd | 2.87 | III | Sometimes | 2.60 | I | Always |
| 4 | Ghee | 3.64 | IV | Rarely | 3.11 | III | Sometimes |
| 5 | Cooking | 4.53 | V | Hardly | 5.38 | V | Hardly |
Table text extracted from the original PDF; superscript letters are shown inline. The original table image is below.
View original table image
| Factor | Weighted Average | Interpretation |
|---|---|---|
| Hygienic and Safe | 4.70 | Most important factor; consumers prioritize hygiene and safety |
| Easily Available | 4.21 | Highly important; accessibility matters |
| Longer Shelf Life | 4.09 | Important; consumers value extended usability |
| Trusted Brand | 3.87 | Moderately important; brand plays a role |
| Convenient Packaging | 3.49 | Least important among listed factors |
Table text extracted from the original PDF; superscript letters are shown inline. The original table image is below.
View original table image
| Latent Variable | Indicator Variables | Justification |
|---|---|---|
| Demographics (DEM) | Gender, Age, Education, Occupation | These shape overall behavioral tendencies and SES. |
| Family Context (FAM) | Family Structure, Family Members | Direct impact on consumption volume. |
| Socioeconomic Status (SES) | Monthly Income, Total Earners | Drives purchasing power and milk choices. |
| Purchase Behavior (PB) | Source of Purchase, Variant Used | Reflects consumer preferences and access patterns. |
| Milk Consumption (MC) | Daily Quantity of Milk Consumed (Family) | Outcome variable - core behavior to be explained. |
Table text extracted from the original PDF; superscript letters are shown inline. The original table image is below.
View original table image
| Path | Standardized Coefficient |
|---|---|
| Gender, Age, Education, Occupation → DEM | 0.62*** |
| Family Structure, Family Members, Source, Variant → FAM | 0.39** |
| DEM → SES | 0.47*** |
| SES → PB (Purchase Behavior) | 0.47*** |
| PB → MC (Milk Consumption Construct) | 0.34** |
| MC → Milk Quantity Consumed (Family) | 0.33** |
| PB → Milk Quantity Consumed (Family) | 0.33** |
Table text extracted from the original PDF; superscript letters are shown inline. The original table image is below.
View original table image
| Latent Construct | Observed Variables |
|---|---|
| Socio-Economic Profile (SEP) | Education, Occupation, Monthly Family Income, Family Size, Number of Earners |
| Purchase Dynamics (PD) | Source of Purchase, Preferred Brands, Daily Quantity of Milk Consumed |
| Demographics (DEM) | Gender, Age Group, Family Structure |
Table text extracted from the original PDF; superscript letters are shown inline. The original table image is below.
View original table image
| Path | Coefficient |
|---|---|
| Gender → Socio-Economic Profile | -0.30 |
| Age Group → Socio-Economic Profile | -0.22 |
| Demographics → Socio-Economic Profile | 0.40*** |
| Education → Demographics | 0.52*** |
| Occupation → Demographics | 0.23** |
| Family Size → Demographics | 0.22* |
| Demographics → Monthly Family Income | 0.52*** |
| Socio-Economic Profile → Monthly Family Income | 0.52*** |
| Socio-Economic Profile → Source of Purchase | 0.60*** |
| Socio-Economic Profile → Preferred Brands | 0.25** |
| Source of Purchase → Preferred Brands | -0.25** |
| Preferred Brands → Source of Purchase | 0.45*** |
| Monthly Family Income → Purchase Dynamics | 0.60*** |
| Socio-Economic Profile → Purchase Dynamics | 0.60*** |
| Purchase Dynamics → Daily Quantity of Milk Consumed | 0.85*** |
Table text extracted from the original PDF; superscript letters are shown inline. The original table image is below.
View original table image
References
10 in the original paper- Naresha N, Dixit AK. Utilization Pattern of Milk and Milk Products by Different Consuming Units in Andhra Pradesh, India: A Comparative Analysis. J Sci Res Reports. 2025;31(4):420-426.
- Khera R, et al. Evidence on Milk Consumption and Production Linkages from Rural Bihar, India. Front Nutr. 2024;11:e11043808.
- Deka P, Deka GJ, Chutia D. Consumption of Milk and Other Dairy Products as Influenced by Dietary Groups in Assam. Asian J Agric Ext Econ Sociol. 2024;42(11):21-28.
- Gandhi VP, et al. Study on Consumption Pattern of Milk and Milk Products Across Regions of India. Pharma Innov J. 2022;11(2S):S904-S909.
- Dave P, Desai S. Exploring Milk Consumption Trends and Cow Milk Health Benefits: A Study in Anand and Vidyanagar. Asian J Crop Soil Sci Plant Nutr. 2024;10(3):55-61.
- Sivasankaran S, Sivanesan R. A Study of Consumer Buying Behaviour of Pouch Milk in Indore. Neuro Quantology. 2013;11(2):2300-2310.
- Abdulai A. Patterns and Determinants of Organized Dairy Industry Growth: A Panel Study. Indian J Dairy Sci. 2018;71(5):451-459.
- Rao U, Rai S. A Comparative Analysis of Packed and Loose Milk in South Gujarat. Coop Perspect. 2021;57(3):91-103.
- Ramana DTV. Preferences of Consumers towards Milk Brands in Kurnool District of Andhra Pradesh. Int J Acad Res. 2019;6(12):110-119.
- Rani S, Bansal N. Level of Awareness and Willingness to Pay for Safe Milk: A Study of Urban Consumers in North India. Agric Res. 2024;13(1):81-90.