
Research article · 2025 · Full text
International Journal of Agriculture and Food ScienceDynamics of major millets in India
Volume 7(8) · Pages 401–405 · DOI: 10.33545/2664844x.2025.v7.i8f.637 ↗
Research areasAgricultural Economics and PracticesRice Cultivation and Yield Improvement
Abstract
Author-writtenThe study “Dynamics of Major Millets in India” examines 40 years of trends in sorghum, pearl millet, and finger millet using secondary data and statistical tools. It finds a consistent decline in cultivation area especially for sorghum and finger millet due to policy bias, urbanization, and dietary shifts. Despite this, productivity, particularly of pearl millet, has improved. Millet consumption has dropped but shows signs of revival driven by health awareness. Export growth was initially strong but has declined recently, with finger millet showing high instability. Regression analysis reveals that finger millet exports benefit from higher production and farm prices, while sorghum exports are limited by strong domestic demand and pricing. The study concludes that millets can regain prominence through focused policies, improved infrastructure, and better market integration.
Summary
Source-checkedPlain-language reading of the full paper, prepared with AI and checked against the text. Each point links to the authors' own words.
Why it matters
- Sorghum, pearl millet, and finger millet have historically been essential to India's diet and agriculture, especially in semi-arid and arid regions. View evidence ↗
- Millets are environmentally sustainable because they are climate-resilient, require very little water, and can grow without chemical fertilizers. View evidence ↗
- The cultivation of millets declined as the Green Revolution shifted agricultural focus toward wheat and rice. View evidence ↗
The question
- The study aims to analyze the export dynamics, instability, and growth trends of major Indian millets to identify factors affecting their trade, consumption, and production. View evidence ↗
What they did
- The researchers used statistical tools and secondary data to examine 40-year trends for finger millet, pearl millet, and sorghum. View evidence ↗
- Data was sourced from the Food and Agriculture Organization (FAO) and various government websites, including apeda.gov.in and milletstats.com. View evidence ↗
- Multiple regression analysis was used to evaluate exports based on variables including farm harvest prices (FHP), minimum support price (MSP), international price, domestic demand, and production. View evidence ↗
What they found
- Pearl millet showed resilience, with productivity and production increasing steadily by up to 3.26% despite a minimal decline in area. View evidence ↗
- Export instability for sorghum decreased over time, with value instability dropping from 214.96% in Period 1 to 51.97%. View evidence ↗
- Finger millet (ragi) exports remained highly unstable, with instability peaking at 277.97% in Period 2 and staying at 191.03% in Period 3. View evidence ↗
- Regression analysis indicates that finger millet exports are significantly increased by favorable farm harvest prices and higher production. View evidence ↗
- For pearl millet, domestic consumption was the only variable with a significant positive impact on exports, with a coefficient of 0.24. View evidence ↗
- None of the key variables, including MSP, FHP, production, consumption, or international price, had a statistically significant effect on sorghum exports. View evidence ↗
What it means
- The authors conclude that millets can be revitalized to improve export potential, nutritional value, and food security through market integration, infrastructure development, and focused policy support. View evidence ↗
Visual summary
3 visualsIllustrations explain the paper; charts are replotted from the paper's own table values.
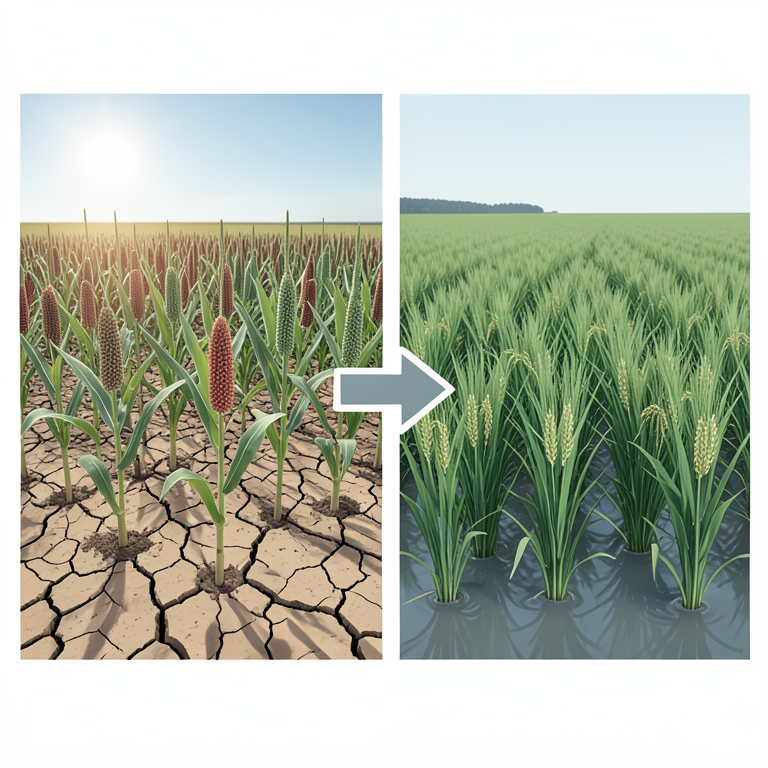
The Millet Shift
AI-generated conceptual illustration (Sorghum, pearl millet, and finger millet crops compared to rice and wheat crops in an Indian agricultural landscape). It explains the idea and does not show study data.
View source evidence ↗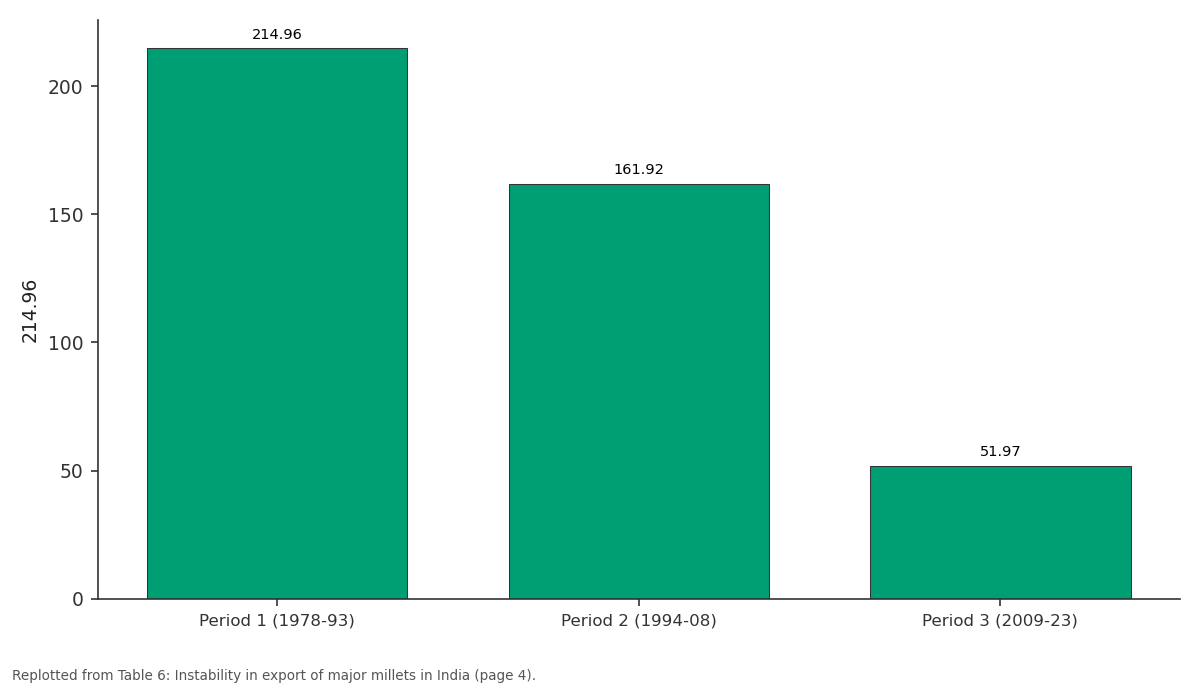
214.96: Period 1 (1978-93) vs Period 2 (1994-08) vs Period 3 (2009-23)
Replotted from Table 6 (page 4) of the original paper. Every bar is the paper's own table value.
View source evidence ↗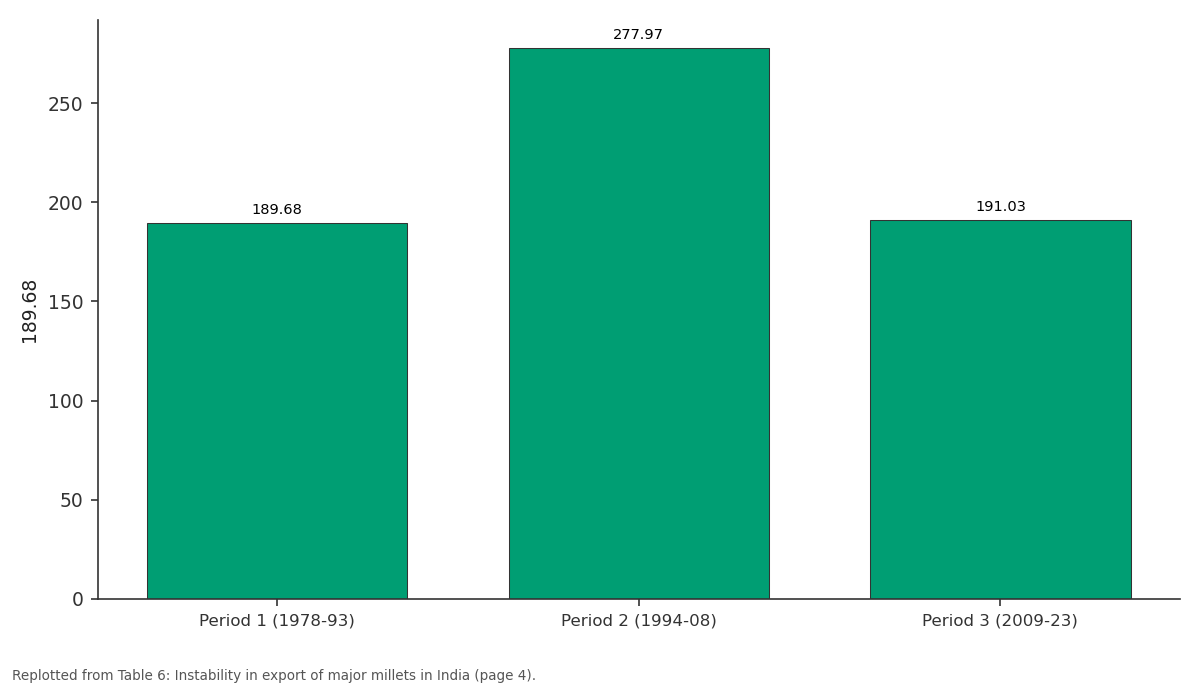
189.68: Period 1 (1978-93) vs Period 2 (1994-08) vs Period 3 (2009-23)
Replotted from Table 6 (page 4) of the original paper. Every bar is the paper's own table value.
View source evidence ↗Figures & tables
From the original paper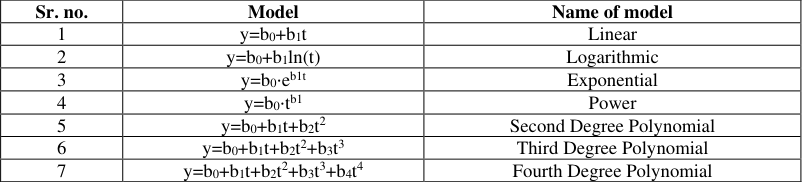 Table 1
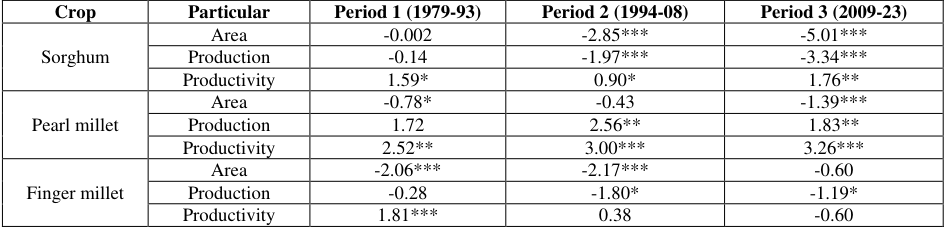 Table 2
 Table 3
 Table 4
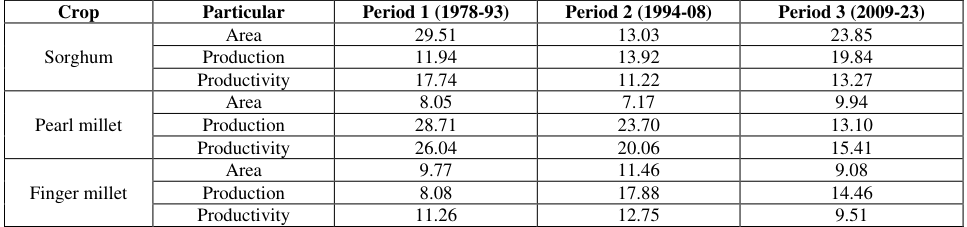 Table 5
 Table 6
 Table 7
 Table 8
 Table 9
 Table 10
 Table 11
 Table 12
 Table 13
Introduction
Millets, including sorghum (Jowar), pearl millet (Bajra), and finger millet (Ragi), have historically been vital to India's agricultural and dietary landscape, particularly in arid and semi-arid regions. These climate-resilient crops require minimal water and grow well without chemical fertilizers, making them environmentally sustainable. However, the Green Revolution shifted focus toward rice and wheat, leading to a decline in millet cultivation. In recent years, rising health awareness and their adaptability to water-stressed conditions have renewed interest in millets. Nutritionally superior to rice and wheat, millets are rich in fiber, calcium, and micronutrients, offering a natural remedy to malnutrition. India, producing about 20% of global millets, harvested nearly 18 million metric tons in 2022-23, with Rajasthan, Maharashtra, and Karnataka as leading producers. Exports also increased, reaching 250,000 metric tons valued at USD 100 million. Despite this growth, instability in production and trade persists due to erratic rainfall, poor infrastructure, limited processing, price volatility, and weak market linkages. Export performance is further constrained by certification barriers, packaging issues, and lack of farmer awareness. Still, government initiatives such as the Millet Mission, PDS inclusion, and international promotion under "India Millets" are helping revive domestic and global interest. This study focuses on analyzing the growth trends, instability, and export dynamics of major millets in India, and aims to identify key factors influencing their production, consumption, and trade
Methodology
The study was based on secondary data. The data collected from the government websites of www apeda. gov.in www. agriculture statistic at glance.in www milletstats.com and Food and Agriculture Organization (FAO). The choice of the statistical and econometric tools of analysis was decided with reference to the objectives of the study and the nature of data collected. The analytical techniques used in the study for sorghum, pearl millet and finger millet was presented below.
Compound annual growth rate
The following exponential equation was used
Multiple Factor Regression Coefficients
The multiple regression equation is given
Results and discussion
Table 1 the compound growth analysis reveals a consistent decline in the cultivation area of all major millets, particularly sorghum and finger millet. Sorghum showed sharp reductions in both area -5.01 per cent and production -3.34 per cent in recent years, though slight productivity gains suggest improved efficiency. Pearl millet demonstrated resilience with minimal area decline and steady increases in both production and productivity up to 3.26 per cent. Finger millet experienced early declines in area and production, with productivity improvements limited to the initial period. Overall, rising productivity, especially in pearl millet, has helped cushion the impact of reduced cultivation. Table 2 the compound growth analysis of millet exports shows strong initial growth followed by a clear decline in recent years. Sorghum exports surged by 83.94 per cent in Period 1 but fell to -9.10 per cent in Period 3. Bajra saw steady growth early on, with a 158.77 per cent rise in export value in Period 1, but declined slightly later. Ragi experienced early gains but dropped sharply by -28.14 per cent in exports and -24.66 per cent in value in the final period. These trends reflect early export potential followed by setbacks likely due to market saturation, policy changes, or reduced global demand, indicating a need for revised export strategies. Table 3 From 1991 to 2011, millet consumption in India declined sharply across regions. Sorghum intake dropped steadily in both rural -5.98 per cent and urban -6.93 per cent areas. Pearl millet showed rural growth in the 1990s 11.32 per cent but declined thereafter -3.07 per cent, with urban consumption consistently falling. Finger millet data 2001-2011 also indicated a decline, with rural areas seeing -6.79 per cent and urban -1.55 per cent. These shifts reflect changing food preferences, increased availability of rice and wheat, urbanization, and declining policy support for millets 8 trend analysis of pearl millet in India shows a fluctuating but overall declining cultivation area R² = 0.63, while production remains stable R² = 0.58, likely due to improved productivity. Consumption trends are highly irregular R² = 0.06, reflecting inconsistent dietary preferences. Exports display a strong trend R² = 0.87, with initial growth followed by a decline, possibly due to global competition or supply issues. Overall, pearl millet maintains stable production and strong export performance despite area loss and unpredictable domestic demand. Table 9 trend analysis of finger millet shows a declining cultivation area with weak clarity R² = 0.29, but production remains strong and steady R² = 0.97, likely due to yield improvements. Consumption trends are moderately stable R² = 0.48, reflecting fluctuating food habits. Exports display a highly predictable trend R² = 0.97, with initial decline followed by recovery, indicating recent growth in trade (Kumar P et al, 2023) [10] . Overall, finger millet demonstrates strong performance in production and exports, despite instability in area and consumption.
| Sr. no | Particular | Model | R square | Coefficient | — | — | — |
|---|---|---|---|---|---|---|---|
| b1 | b2 | b3 | b4 | ||||
| 1 | Area | Fourth degree of polynomial | 0.63 | -0.70 | 0.20 | -0.01 | 0.00007 |
| 2 | Production | Fourth degree of polynomial | 0.58 | 0.03 | -0.002 | 0.0001 | 0.00002 |
| 3 | Consumption | Fourth degree of polynomial | 0.06 | -0.31 | 0.14 | -0.02 | 0.0011 |
| 4 | Export | Fourth degree of polynomial | 0.87 | 0.42 | -0.17 | 0.02 | -0.001 |
Table text extracted from the original PDF; superscript letters are shown inline. The original table image is below.
View original table image
| Crop | Particular | Period 1 (1979-93) | Period 2 (1994-08) | Period 3 (2009-23) |
|---|---|---|---|---|
| Sorghum | Export | 83.94*** | 16.81 | -9.10** |
| Value | -37.26*** | 83.83*** | -4.86** | |
| Bajra | Export | 21.6 | 18.68*** | -3.07** |
| Value | 158.77*** | 21.82*** | -1.06 | |
| Ragi | Export | 51.11** | 36.98* | -28.14*** |
| Value | -75.88*** | 81.34*** | -24.66*** |
Table text extracted from the original PDF; superscript letters are shown inline. The original table image is below.
View original table image
| Crop | Particular | Period 1 (1979-93) | Period 2 (1994-08) | Period 3 (2009-23) |
|---|---|---|---|---|
| Sorghum | Area | -0.002 | -2.85*** | -5.01*** |
| Production | -0.14 | -1.97*** | -3.34*** | |
| Productivity | 1.59* | 0.90* | 1.76** | |
| Pearl millet | Area | -0.78* | -0.43 | -1.39*** |
| Production | 1.72 | 2.56** | 1.83** | |
| Productivity | 2.52** | 3.00*** | 3.26*** | |
| Finger millet | Area | -2.06*** | -2.17*** | -0.60 |
| Production | -0.28 | -1.80* | -1.19* | |
| Productivity | 1.81*** | 0.38 | -0.60 |
Table text extracted from the original PDF; superscript letters are shown inline. The original table image is below.
View original table image
| Sr. no. | Model | Name of model |
|---|---|---|
| 1 | y=b0+b1t | Linear |
| 2 | y=b0+b1ln(t) | Logarithmic |
| 3 | y=b0⋅eb1t | Exponential |
| 4 | y=b0⋅tb1 | Power |
| 5 | y=b0+b1t+b2t2 | Second Degree Polynomial |
| 6 | y=b0+b1t+b2t2+b3t3 | Third Degree Polynomial |
| 7 | y=b0+b1t+b2t2+b3t3+b4t4 | Fourth Degree Polynomial |
Table text extracted from the original PDF; superscript letters are shown inline. The original table image is below.
View original table image
Table 10 the regression analysis for sorghum exports shows that none of the key variables production, international price, MSP, FHP, or consumption have statistically significant effects, as indicated by large standard errors relative to the coefficients. All coefficients are negative, suggesting that higher domestic production, support prices, farm harvest prices, and consumption may suppress exports, possibly due to increased domestic demand or reducedprice competitiveness. The intercept is positive, indicating some baseline level of export independent of these factors. Overall, sorghum exports appear to be largely constrained by internal market dynamics rather than external price incentives. Table 11 the regression results for pearl millet exports indicate that among all variables, only domestic consumption has a significant positive impact coefficient 0.24, suggesting that higher consumption is associated with increased exports, possibly due to overall market expansion. Other variables production, international price, MSP, and FHP have minimal and statistically insignificant effects, reflecting limited influence on export levels. The positive but small coefficients and high standard errors for these variables suggest that factors beyond price and supply, such as demanddriven dynamics and market linkages, play a more critical role in determining pearl millet export performance. Table 12 the regression analysis for finger millet exports shows that higher production and favorable Farm Harvest Prices (FHP) significantly boost exports, highlighting their positive influence. In contrast, rising international prices and higher MSP negatively affect export performance, likely due to reduced price competitiveness and lower export incentives. Overall, finger millet exports are strongly influenced by domestic output and supportive farm-level pricing, with FHP playing a key role in promoting export-oriented surplus.
| Particular | Coefficients | Standard Error |
|---|---|---|
| Intercept | 0.77 | 0.67 |
| Production | 0.006 | 0.07 |
| International price | -0.007 | 0.03 |
| MSP | -0.0004 | 0.0003 |
| FHP | 0.0005 | 0.0006 |
| Consumption | 0.24** | 0.10 |
| R2 = 0.40 |
Table text extracted from the original PDF; superscript letters are shown inline. The original table image is below.
View original table image
| Particular | Coefficients | Standard Error |
|---|---|---|
| Intercept | 0.49 | 0.23 |
| Production | -0.019 | 0.02 |
| International price | -2.85 | 2.67 |
| MSP | -5.85 | 6.58 |
| FHP | -9.45 | 0.0001 |
| Consumption | -0.27 | 0.24 |
| R2=0.25 |
Table text extracted from the original PDF; superscript letters are shown inline. The original table image is below.
View original table image
| Sr. no | Particular | Model | R square | Coefficient | — | — | — |
|---|---|---|---|---|---|---|---|
| b1 | b2 | b3 | b4 | ||||
| 1 | Area | Fourth degree of polynomial | 0.29 | -0.79 | 0.18 | -0.016 | 0.0005 |
| 2 | Production | Fourth degree of polynomial | 0.97 | -0.03 | 0.02 | -0.002 | 0.0009 |
| 3 | Consumption | Fourth degree of polynomial | 0.48 | 0.04 | -0.05 | 0.01 | -0.0005 |
| 4 | Export | Fourth degree of polynomial | 0.97 | -0.92 | 0.24 | -0.02 | 0.01 |
Table text extracted from the original PDF; superscript letters are shown inline. The original table image is below.
View original table image
Figures and tables from the paper
| Particular | Geography | Period 1 (1991-00) | Period 2 (2001-11) |
|---|---|---|---|
| Sorghum | Rural | -5.26*** | -5.98*** |
| Urban | -5.46*** | -6.93*** | |
| Pearl millet | Rural | 11.32 | -3.07* |
| Urban | -3.07 | -3.91*** | |
| Finger millet | Rural | -6.79*** | |
| Urban | -1.55 |
Table text extracted from the original PDF; superscript letters are shown inline. The original table image is below.
View original table image
| Crop | Particular | Period 1 (1978-93) | Period 2 (1994-08) | Period 3 (2009-23) |
|---|---|---|---|---|
| Sorghum | Area | 29.51 | 13.03 | 23.85 |
| Production | 11.94 | 13.92 | 19.84 | |
| Productivity | 17.74 | 11.22 | 13.27 | |
| Pearl millet | Area | 8.05 | 7.17 | 9.94 |
| Production | 28.71 | 23.70 | 13.10 | |
| Productivity | 26.04 | 20.06 | 15.41 | |
| Finger millet | Area | 9.77 | 11.46 | 9.08 |
| Production | 8.08 | 17.88 | 14.46 | |
| Productivity | 11.26 | 12.75 | 9.51 |
Table text extracted from the original PDF; superscript letters are shown inline. The original table image is below.
View original table image
| Crop | Particular | Period 1 (1978-93) | Period 2 (1994-08) | Period 3 (2009-23) |
|---|---|---|---|---|
| Sorghum | Export | 286.53 | 185.53 | 161.74 |
| Value | 214.96 | 161.92 | 51.97 | |
| Bajra | Export | 215.0 | 104.63 | 26.92 |
| Value | 124.52 | 124.24 | 24.99 | |
| Ragi | Export | 189.68 | 277.97 | 191.03 |
| Value | 189.11 | 275.90 | 190.29 |
Table text extracted from the original PDF; superscript letters are shown inline. The original table image is below.
View original table image
| Particular | Geography | Period 1 (1991-00) | Period 2 (2001-11) |
|---|---|---|---|
| Sorghum | Rural | 16.61 | 22.06 |
| Urban | 21.03 | 22.52 | |
| Pearl millet | Rural | 89.72 | 17.89 |
| Urban | 29.99 | 14.85 | |
| Finger millet | Rural | 21.01 | |
| Urban | 17.31 |
Table text extracted from the original PDF; superscript letters are shown inline. The original table image is below.
View original table image
| Sr. no | Particular | Model | R square | Coefficient | — | — | — |
|---|---|---|---|---|---|---|---|
| b1 | b2 | b3 | b4 | ||||
| 1 | Area | Fourth degree of polynomial | 0.89 | -0.35 | -0.009 | -0.0005 | 0.0002 |
| 2 | Production | Fourth degree of polynomial | 0.39 | -2.98 | 0.93 | -0.11 | 0.0052 |
| 3 | Consumption | Fourth degree of polynomial | 0.84 | 0.15 | -0.04 | 0.006 | -0.0003 |
| 4 | Export | Fourth degree of polynomial | 0.69 | 0.10 | -0.04 | 0.007 | -0.0003 |
Table text extracted from the original PDF; superscript letters are shown inline. The original table image is below.
View original table image
| Particular | Coefficients | Standard Error |
|---|---|---|
| Intercept | -0.18 | 0.28 |
| Production | 0.23** | 0.12 |
| International price | -0.001** | 0.0004 |
| MSP | -0.0001* | 9.22 |
| FHP | 0.0002** | 0.0001 |
| R2 =0.42 |
Table text extracted from the original PDF; superscript letters are shown inline. The original table image is below.
View original table image
References
10 in the original paper- Behara MK. Assessment of the state of millets farming in India. MOJ Ecol Environ Sci 2017;2(1):1-5. DOI:10.15406/mojes.2017.02.00013.
- Chaudhary J, Shelar R, Thakur K, Singh R, Rimpika. Millets in India: production, consumption and impact on food security. Asian J Agric Ext Econ Sociol 2023;41(10):144-150. DOI:10.9734/ajaees/2023/v41i102178.
- Kumar P, Sonnad JS, Yousafzai I, Jamanar H. Export performance and direction trade of millets from India. Int J Agric Ext Soc Dev 2023;6(1):91-95.
- Rani P, Charu S, Kumar K. Growth trend of pearl millet and its impact on Indian economy: performance analysis. Int J Adv Multidiscip Res Stud 2023;3(3):162166.
- Sendhil R, Joseph J, Akhilraj M, Sivasakthi Devi T, Swaminathan N, Pouchepparadjou A. Status of millets in India: trends and prospects. In: Sensitizing the Millet Farming, Consumption and Nutritional Security - Challenges and Opportunities. New Delhi: ICAR; 2023. p. 10-21.
- Gaike AR, Baisane V. A geographical study of changing trends of agriculture efficiency of Parbhani District, Maharashtra. Int J Geogr Geol Environ 2024;6(2):151-155.
- Singh OP, Singh PK. Trends in millets production, consumption and export from India. J Orissa Agric Res Univ 2023;52(1):112-118. DOI:10.58537/jorangrau.2024.52.1.14.
- Singh P, Arora K, Kumar S, Gohain N, Sharma RK. Indian millets trade potential-cum-performance: economic perspective. Indian J Agric Sci 2023;93(2):200-204.
- Kumar P, Sonnad JS, Yousafzai I, Jamanal H. Export performance and direction of trade of millets from India. International Journal of Agriculture Extension and Social Development. 2023;6(1):91-95. DOI: 10.33545/26180723.2023.v6.i1b.180
- Sukumaran SAD, Anbukkani P, Singh A, Rao DB, Jha GK. Millet production and consumption in India. Natl Acad Sci Lett 2023;46(1):65-70.