
Research article · 2025 · Full text
International Journal of Agriculture and Food ScienceStatistical analysis of crop diversification in Ahilyanagar district of Maharashtra
Volume 7(8) · Pages 428–435 · DOI: 10.33545/2664844x.2025.v7.i8f.642 ↗
Research areasAgricultural Economics and PracticesAgricultural risk and resilience
Abstract
Author-writtenThe present study examined the spatio-temporal crop diversity of the Ahilyanagar district. The investigation relies on data gathered from the District Statistical Abstract of Ahmednagar and utilizes Gibbs and Martin's Index to assess the intensity of variation in crop diversity across tahsils. The result reveals that the northern tahsils such as Akole, Sangamner, Kopargaon, Rahata, Shrirampur, Newasa, Shevgaon, Pathardi, and Rahuri experienced high diversification, while in the southern semi-arid tahsil like Nagar, Parner, Shrigonda, Karjat, and Jamkhed indicates moderate diversification, where jowar cultivation dominated in 2013-14. However, in 2023-24, the picture has completely changed. Nagar, Parner, Shrigonda, Karjat, and Jamkhed tahsils have also jumped in high diversification. The tahsils, which have a heavy reliance on a single crop, are shifting to growing a variety of crops.
Summary
Source-checkedPlain-language reading of the full paper, prepared with AI and checked against the text. Each point links to the authors' own words.
Why it matters
- Crop diversification is a key strategy for achieving sustainable economic returns in the face of climate change and price volatility. View evidence ↗
- Agriculture is the primary economic driver in the Ahilyanagar district of Maharashtra, supporting approximately 75.42% of the workforce. View evidence ↗
The question
- The study aims to investigate the spatial and temporal patterns of crop diversity in the Ahilyanagar district to address economic and environmental challenges. View evidence ↗
What they did
- The researchers analyzed crop diversification using data from the District Statistical Abstract of Ahmednagar for the years 2013-14 and 2023-24. View evidence ↗
- The diversification index ranges from zero, representing monoculture, to one, representing maximum diversification. View evidence ↗
What they found
- The net sown area in the district increased from 1,303,590 hectares in 2013-14 to 1,572,298 hectares in 2023-24. View evidence ↗
- The overall district crop diversification index increased from 0.80 in 2013-14 to 0.90 in 2023-24. View evidence ↗
- In 2023-24, high diversity was recorded in several tahsils, including Rahata (0.85), Kopargaon (0.83), and Rahuri (0.83). View evidence ↗
- By 2023-24, southern tahsils like Karjat (0.87), Shrigonda (0.87), and Nagar (0.86) also exhibited high diversification. View evidence ↗
- The shift toward diversification was marked by a sharp decline in jowar, which fell to 17% of the total cultivated area. View evidence ↗
- The increase in diversification index values in tahsils like Karjat and Shrigonda was driven by the rise of high-value crops such as sugarcane and cotton. View evidence ↗
- Changes in cropping patterns were attributed to improved irrigation, drip irrigation adoption, high-yielding seeds, mechanization, fertilizers, market prices, and government policies. View evidence ↗
What it means
- The authors conclude that improved irrigation has enabled tahsils previously reliant on single crops to shift toward a variety of high-value cash crops. View evidence ↗
- The authors state that farmers are moving away from jowar toward high-value crops to ensure better economic returns. View evidence ↗
Visual summary
3 visualsIllustrations explain the paper; charts are replotted from the paper's own table values.
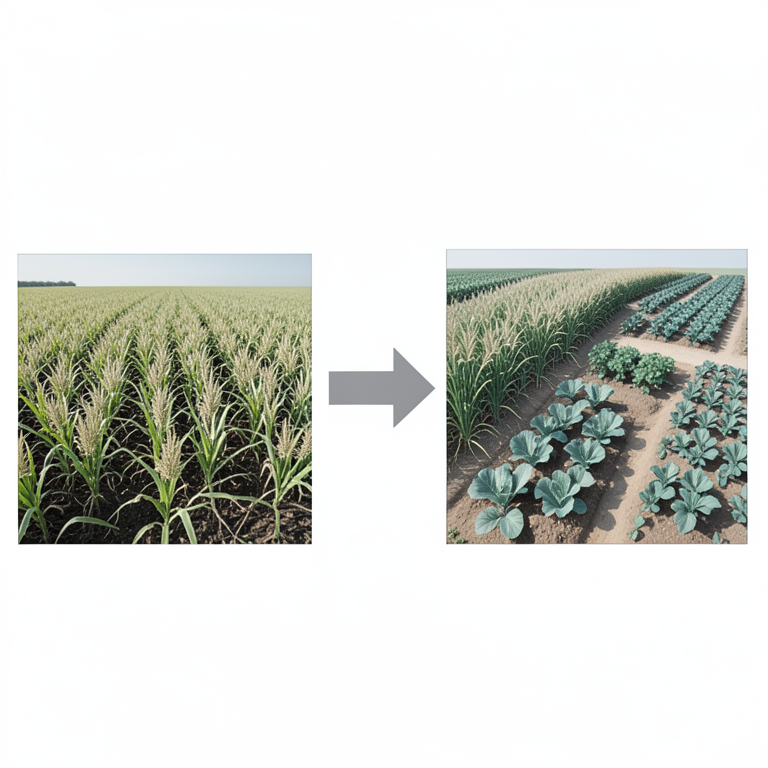
Shift from Monoculture to Diversification
AI-generated conceptual illustration (Agricultural fields in Maharashtra, India). It explains the idea and does not show study data.
View source evidence ↗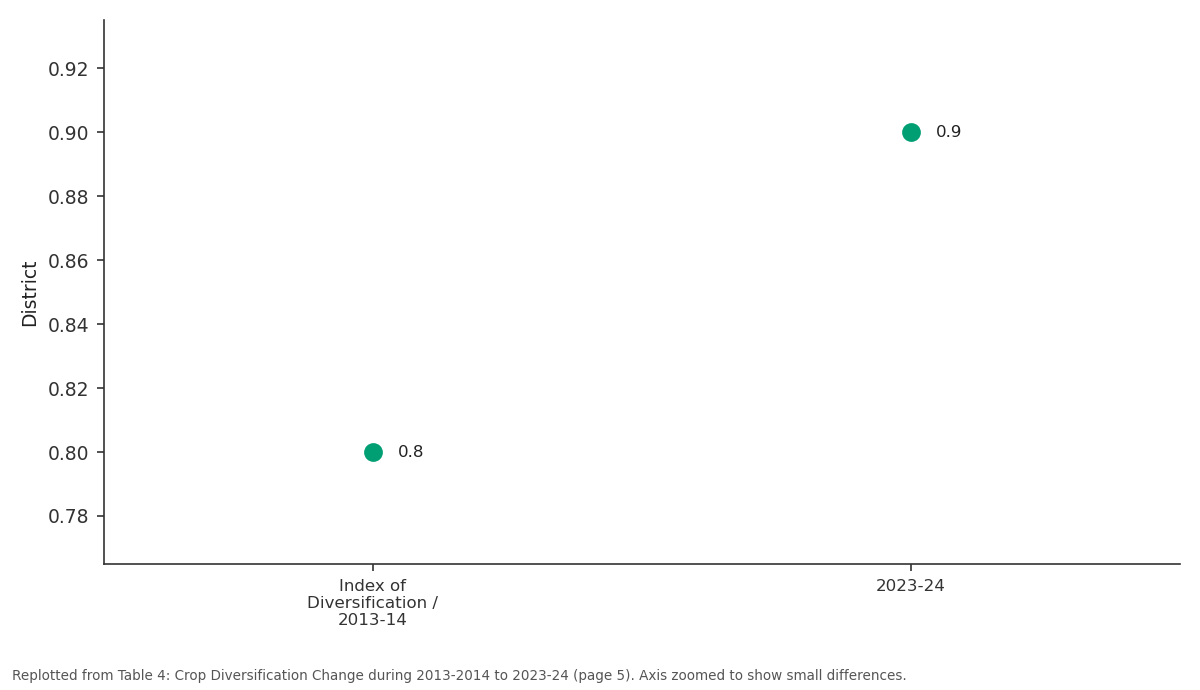
District: Index of... vs 2023-24
Replotted from Table 4 (page 5) of the original paper. Every bar is the paper's own table value.
View source evidence ↗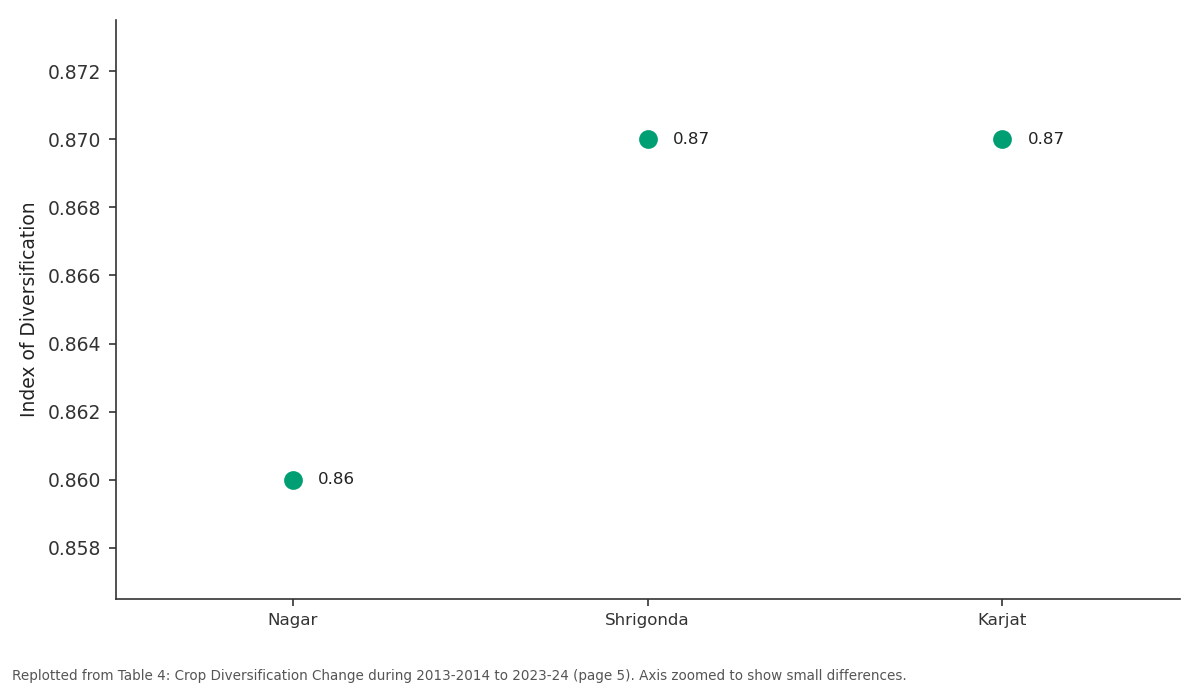
2023-24: Nagar vs Shrigonda vs Karjat
Replotted from Table 4 (page 5) of the original paper. Every bar is the paper's own table value.
View source evidence ↗Figures & tables
From the original paper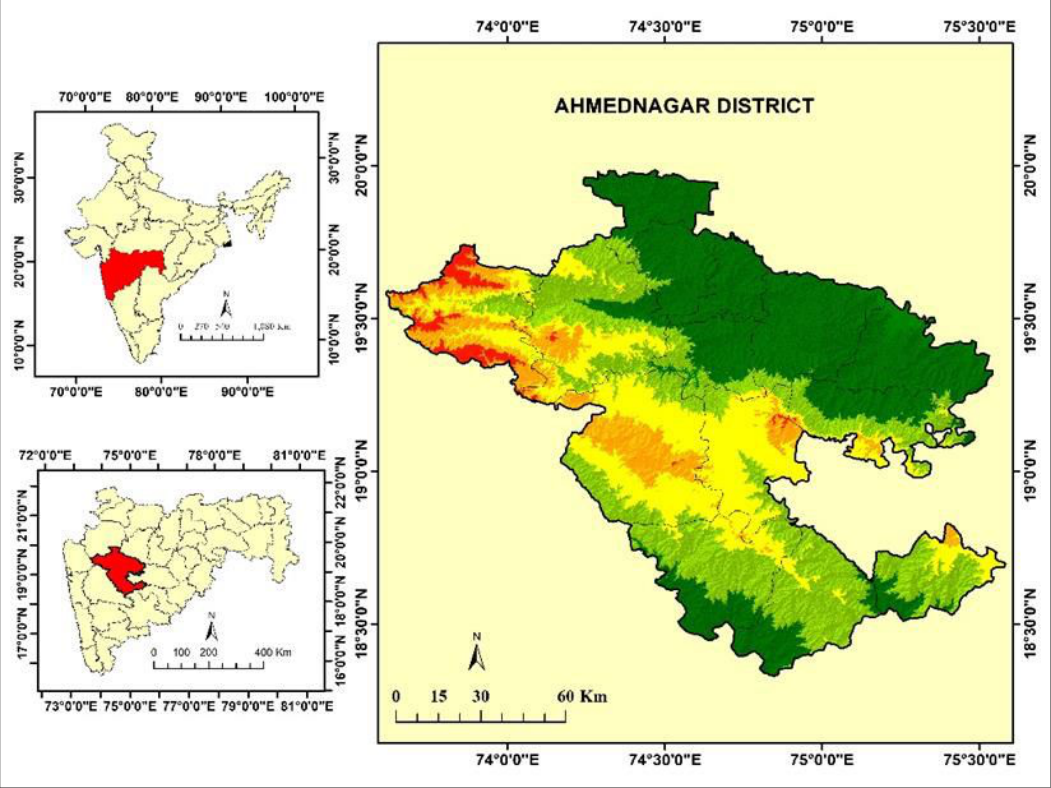 Figure 1
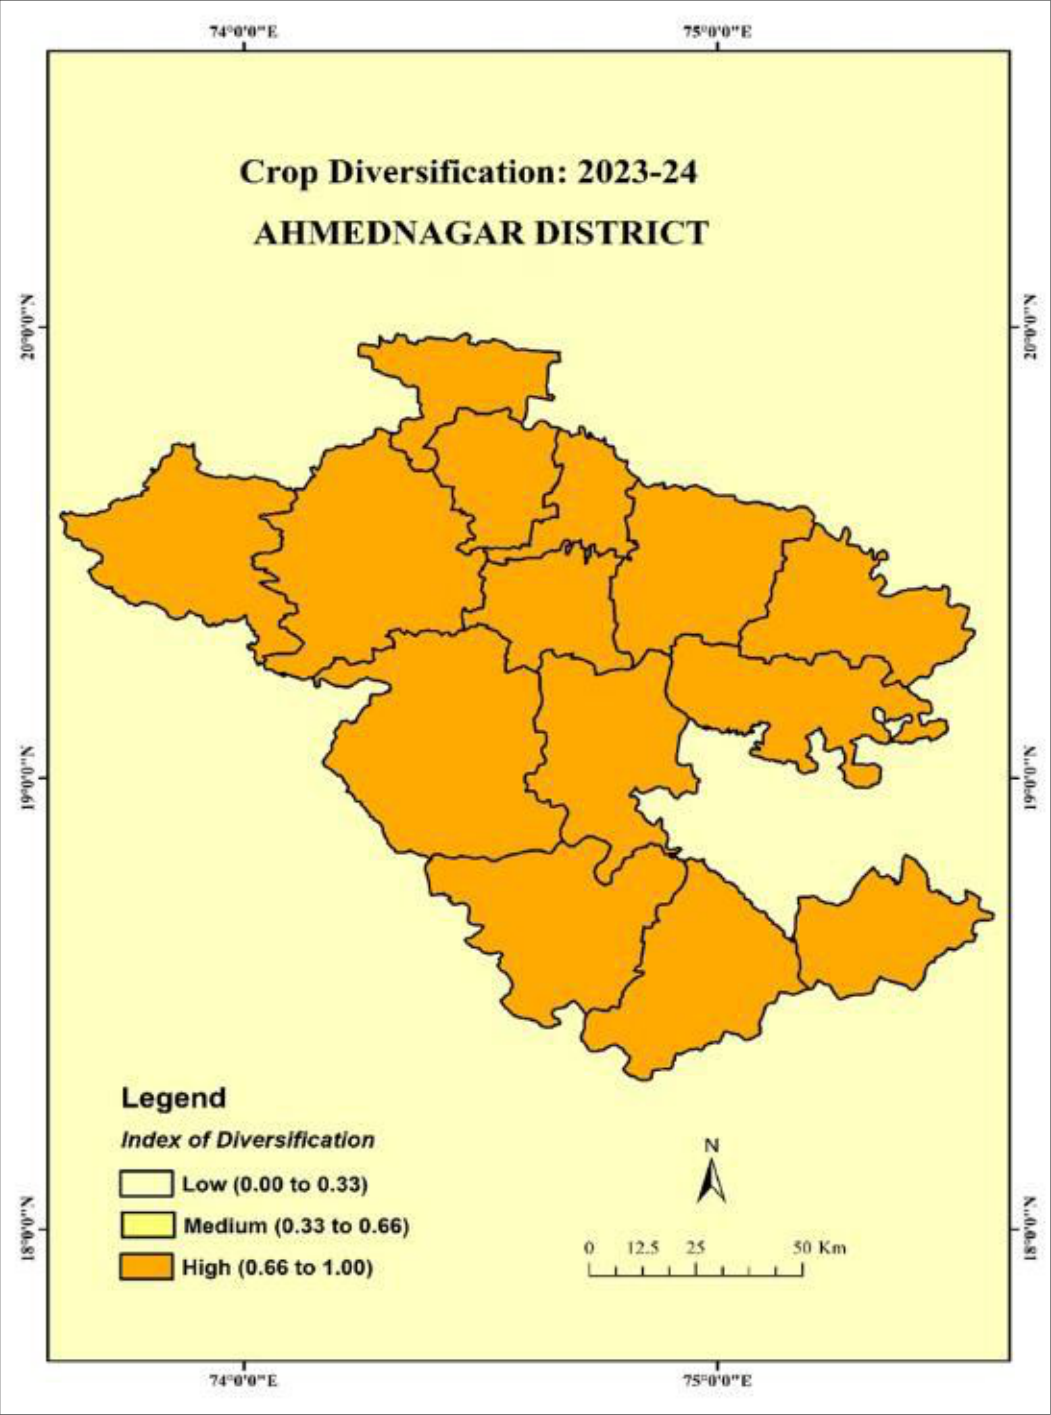 Figure 2
 Table 3
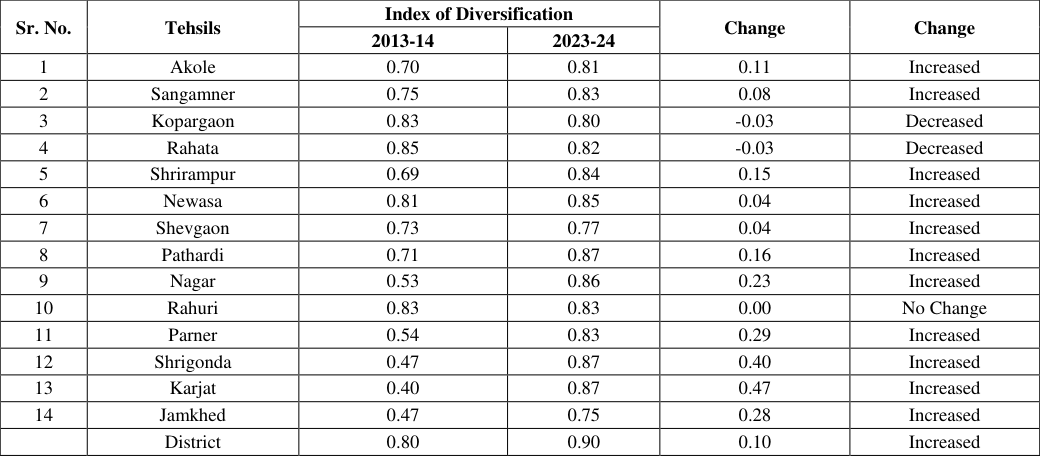 Table 4
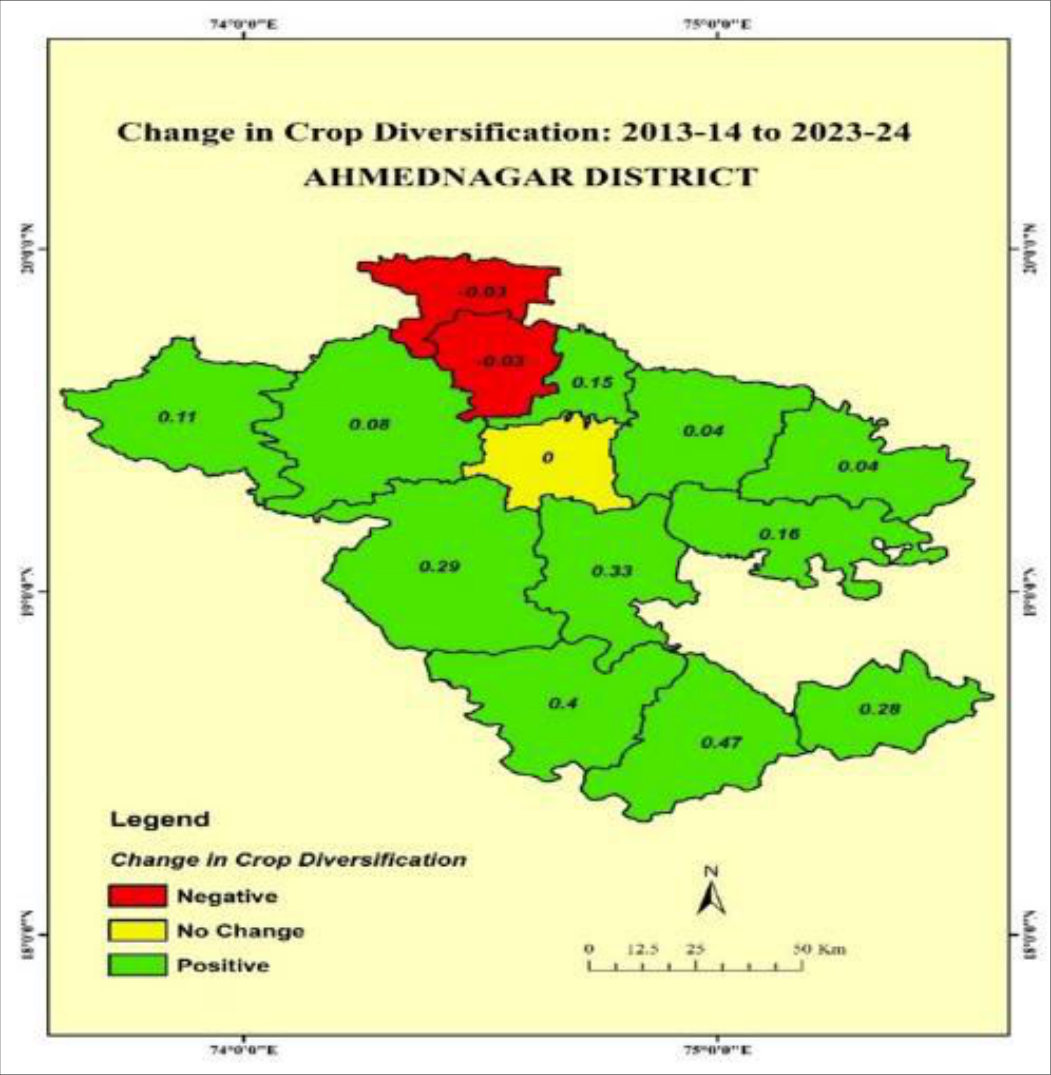 Figure 3
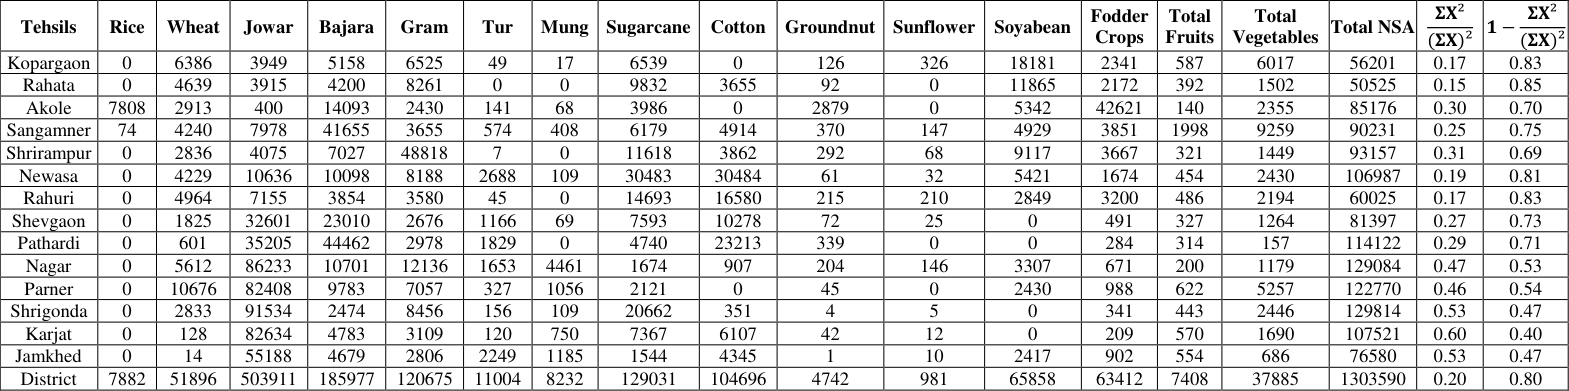 Table 1
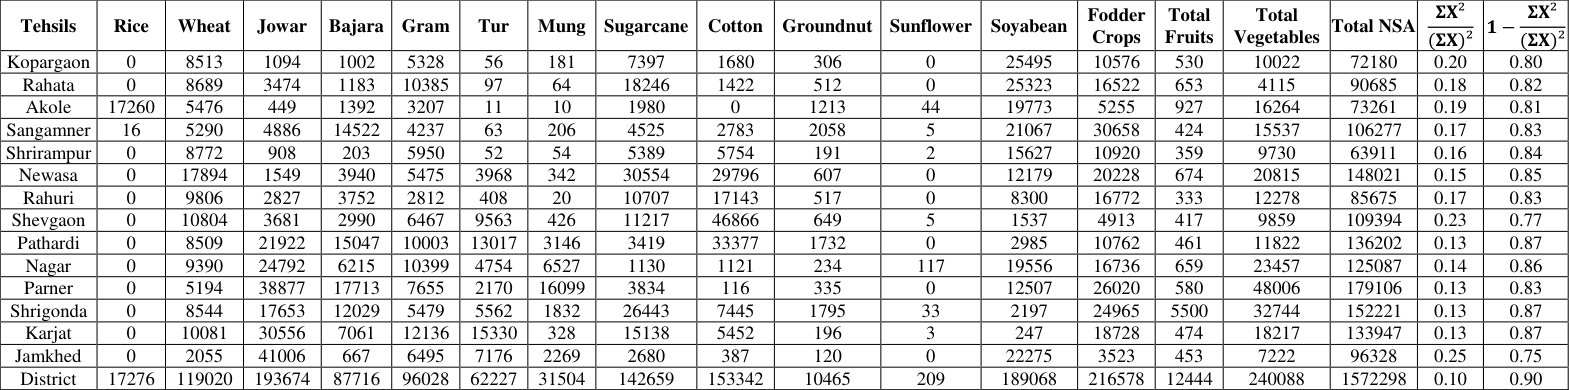 Table 2
Introduction
Crop diversity refers to the cultivation of various crops within a particular area (Gibbs & Martin, 1962) [10] . A higher degree of diversification is observed when numerous crops are grown in a given area. In contrast, crop specialization refers to the practice of growing a limited number of crops. Crop diversification, much like crop concentration, is a significant tool in the study of agriculture and land use. It indicates the variation in crops cultivated within a particular region. A higher degree of diversification is observed when numerous crops are grown in a given area, each occupying an approximately equal share of the total cultivated land. In contrast, crop specialization refers to the practice of growing a limited number of crops. Essentially, while diversification involves utilizing the land for multiple crop types, specialization focuses on just one or two primary crops (Jasbir Singh, 1976). According to the principle, "Greater competition leads to more diversification, whereas reduced competition results in specialization or monoculture practices. Several techniques, including the Herfindahl Index (HI), Ogive Index (OI), Composite Entropy Index (CEI), and Gibbs-Martin Index (GMI), are employed to analyze crop diversification. However, Gibbs & Martin's method is a widely used tool for studying crop diversification. Many scholars have utilized Gibbs & Martin's method to calculate crop diversification, such as Bhatia, S. S. [2,3,10,11,13,15,16,17,19,20,21] . As agriculture continues to face challenges from price volatility and climate change, crop diversification, as measured by the GMI, provides vital insights for achieving sustainable economic returns. The Ahilyanagar district is well known for agriculture in the Maharashtra state, where agriculture serves as the primary engine of growth. Approximately 75.42% of the total workforce's livelihood is derived from agriculture. Therefore, an attempt has been made to investigate spatial-temporal crop diversity in Ahilyanagar district to tackle the challenges of price volatility and climate change.
Study Area
Ahmednagar is one of the agricultural development districts in Maharashtra, covering approximately 12,56,500 hectares of agricultural land, and it has a geographical area of 17,418 sq. km, which supports a population of about 45,43,083 (Census, 2011) [22] . The study area extends between 18°2' to 19°9' N latitude and 73°9' to 75°5' E longitude. The district comprises fourteen tahsils, encompassing 1,581 villages. Agriculture is a growth engine for the district's economy. Approximately 75.42% of the total workforce's livelihood is derived from agriculture. The district is situated in the semiarid climatic zone, where rainfall is scanty, and the amount of rainfall rapidly declines towards the east. In the last two decades, the net sown area (NSA) changed dramatically, increasing from 13,03,590 hectares to 15,72,298 hectares between 2013-14 and 2023-24, respectively. The land use pattern, as well as the cropping pattern, was changed; the area under jowar was sharply decreased and replaced by sugarcane, fodder crops, fruits, and vegetables.
Fig 1: Location of Study Area
Fig 1: Location of Study Area
Database and Methodology
The present study used data from published reports on the District Statistical Abstract of Ahmednagar for the years 2013-14 and 2023-24 to examine crop diversification [9] . To measure the extent of diversification in cropping patterns, the "Gibbs and Martin Index of Diversification (1962) [10] " has been employed. The formula used to compute this index is:
This formula, 'X,' denotes the percentage share of each crop in the total cultivated area. When a region grows only one crop exclusively, indicating monoculture, the index value is zero. In contrast, if the area is equally distributed among many crops, signifying maximum diversification, the index nears one.
Spatio-Temporal Trends in Crop Diversification
In 2023-24, the crop diversification index shows that Rahata (0.85), Kopargaon (0.83), Rahuri (0.83), Newasa (0.81), and Sangamner (0.75) have high diversity, while Karjat (0.40), Jamkhed (0.47), Shrigonda (0.47), Nagar (0.53), and Partner (0.54) recorded low diversity. It is mainly because jowar accounts for more than 45% of TCA; this means that other crops cover the remaining 55% of TCA. It indicates that crop specialization (jowar). The southern part of the study area experienced very low rainfall and limited irrigation facilities, which led to the support of jowar cultivation. According to the 2023-24 results, Karjat (0.87), Shrigonda (0.87), Nagar (0.86), Jamkhed (0.75), and Partner (0.83) exhibit high diversity. It reveals a sharp decline in jowar (17% of TCA) and an increase in sugarcane, cotton, fodder crops, and fruits and vegetables. This is due to the rise in the prices of sugarcane, fruit, and vegetables. On the other hand, Newasa (0.85), Shrirampur (0.84), Sangamner (0.83), Rahuri (0.83), and Kopargaon (0.80) recorded high crop diversity. The high spatio-temporal crop diversity has been observed at the tahsil level compared to the district, with crop diversification index values of 0.80 and 0.90, respectively, in 2013-14 and 2023-24. It reveals that overall diversity has changed significantly, but tahsil-level diversity has noted a drastic change, especially in the southern part (Table 3). The results indicate that Karjat (0.47), Shrigonda (0.40), Partner (0.29), Jamkhed (0.28), and Nagar (0.23) show an increase in index value, which is due to the rapid rise in the highvalue crops like sugarcane, cotton, fruits, and vegetables. The cropping pattern changed due to improved irrigation facilities, the adoption of drip irrigation, the use of highyielding variety seeds, mechanization, the application of chemical fertilizers, a high market price, and government policies.
| Index of Diversification | Level of Diversification | 2013-14 | 2023-24 |
|---|---|---|---|
| 0.66 to 1.00 | High | Akole, Sangamner, Kopargaon, Rahata, Shrirampur, Newasa, Shevgaon, Pathardi, Rahuri | Kopargaon, Rahata, Akole, Sangamner, Shrirampur, Newasa, Rahuri, Shevgaon, Pathardi, Nagar, Parner, Shrigonda, Karjat, Jamkhed |
| 0.33 to 0.66 | Medium | Nagar, Parner, Shrigonda, Karjat, Jamkhed | - |
| 0.00 to 0.33 | Low | - | - |
Table text extracted from the original PDF; superscript letters are shown inline. The original table image is below.
View original table image
Conclusion
The results reveal the spatial-temporal distribution of crop diversification; the northern tahsils, such as Akole, Sangamner, Kopargaon, Rahata, Shrirampur, Newasa, Shevgaon, Pathardi, and Rahuri, contained high diversification. On the other hand, the southern semi-arid tahsils, such as Nagar, Parner, Shrigonda, Karjat, and Jamkhed, showed moderate diversification in 2013-14. However, within decades, the picture has completely changed. Nagar, Parner, Shrigonda, Karjat, and Jamkhed tahsils also show high diversification in 2023-24. The increase in the irrigation facilities helps grow diverse, highvalue crops. The tahsils, which have a heavy reliance on a single crop, are shifting to produce a variety of cash crops. It also reveals a periodic shift in cropping patterns, particularly in southern tahsils. The southern tahsils were primarily dependent on single crop jowar, and the consistent fall rainfall increased the risk of crop failure, adversely affecting farmers' incomes. Therefore, farmers are shifting from jowar to various high-value crops, which ensure economic returns.
Figures and tables from the paper
| Sr. No. | Tehsils | Index of Diversification | — | Change | Change |
|---|---|---|---|---|---|
| 2013-14 | 2023-24 | ||||
| 1 | Akole | 0.70 | 0.81 | 0.11 | Increased |
| 2 | Sangamner | 0.75 | 0.83 | 0.08 | Increased |
| 3 | Kopargaon | 0.83 | 0.80 | -0.03 | Decreased |
| 4 | Rahata | 0.85 | 0.82 | -0.03 | Decreased |
| 5 | Shrirampur | 0.69 | 0.84 | 0.15 | Increased |
| 6 | Newasa | 0.81 | 0.85 | 0.04 | Increased |
| 7 | Shevgaon | 0.73 | 0.77 | 0.04 | Increased |
| 8 | Pathardi | 0.71 | 0.87 | 0.16 | Increased |
| 9 | Nagar | 0.53 | 0.86 | 0.23 | Increased |
| 10 | Rahuri | 0.83 | 0.83 | 0.00 | No Change |
| 11 | Parner | 0.54 | 0.83 | 0.29 | Increased |
| 12 | Shrigonda | 0.47 | 0.87 | 0.40 | Increased |
| 13 | Karjat | 0.40 | 0.87 | 0.47 | Increased |
| 14 | Jamkhed | 0.47 | 0.75 | 0.28 | Increased |
| District | 0.80 | 0.90 | 0.10 | Increased |
Table text extracted from the original PDF; superscript letters are shown inline. The original table image is below.
View original table image
| Tehsils | Rice | Wheat | Jowar | Bajara | Gram | Tur | Mung | Sugarcane | Cotton | Groundnut | Sunflower | Soyabean | Fodder Crops | Total Fruits | Total Vegetables | Total NSA | 𝚺𝐗² (𝚺𝐗)² | 𝚺𝐗² 𝟏− (𝚺𝐗)² |
|---|---|---|---|---|---|---|---|---|---|---|---|---|---|---|---|---|---|---|
| Kopargaon | 0 | 6386 | 3949 | 5158 | 6525 | 49 | 17 | 6539 | 0 | 126 | 326 | 18181 | 2341 | 587 | 6017 | 56201 | 0.17 | 0.83 |
| Rahata | 0 | 4639 | 3915 | 4200 | 8261 | 0 | 0 | 9832 | 3655 | 92 | 0 | 11865 | 2172 | 392 | 1502 | 50525 | 0.15 | 0.85 |
| Akole | 7808 | 2913 | 400 | 14093 | 2430 | 141 | 68 | 3986 | 0 | 2879 | 0 | 5342 | 42621 | 140 | 2355 | 85176 | 0.30 | 0.70 |
| Sangamner | 74 | 4240 | 7978 | 41655 | 3655 | 574 | 408 | 6179 | 4914 | 370 | 147 | 4929 | 3851 | 1998 | 9259 | 90231 | 0.25 | 0.75 |
| Shrirampur | 0 | 2836 | 4075 | 7027 | 48818 | 7 | 0 | 11618 | 3862 | 292 | 68 | 9117 | 3667 | 321 | 1449 | 93157 | 0.31 | 0.69 |
| Newasa | 0 | 4229 | 10636 | 10098 | 8188 | 2688 | 109 | 30483 | 30484 | 61 | 32 | 5421 | 1674 | 454 | 2430 | 106987 | 0.19 | 0.81 |
| Rahuri | 0 | 4964 | 7155 | 3854 | 3580 | 45 | 0 | 14693 | 16580 | 215 | 210 | 2849 | 3200 | 486 | 2194 | 60025 | 0.17 | 0.83 |
| Shevgaon | 0 | 1825 | 32601 | 23010 | 2676 | 1166 | 69 | 7593 | 10278 | 72 | 25 | 0 | 491 | 327 | 1264 | 81397 | 0.27 | 0.73 |
| Pathardi | 0 | 601 | 35205 | 44462 | 2978 | 1829 | 0 | 4740 | 23213 | 339 | 0 | 0 | 284 | 314 | 157 | 114122 | 0.29 | 0.71 |
| Nagar | 0 | 5612 | 86233 | 10701 | 12136 | 1653 | 4461 | 1674 | 907 | 204 | 146 | 3307 | 671 | 200 | 1179 | 129084 | 0.47 | 0.53 |
| Parner | 0 | 10676 | 82408 | 9783 | 7057 | 327 | 1056 | 2121 | 0 | 45 | 0 | 2430 | 988 | 622 | 5257 | 122770 | 0.46 | 0.54 |
| Shrigonda | 0 | 2833 | 91534 | 2474 | 8456 | 156 | 109 | 20662 | 351 | 4 | 5 | 0 | 341 | 443 | 2446 | 129814 | 0.53 | 0.47 |
| Karjat | 0 | 128 | 82634 | 4783 | 3109 | 120 | 750 | 7367 | 6107 | 42 | 12 | 0 | 209 | 570 | 1690 | 107521 | 0.60 | 0.40 |
| Jamkhed | 0 | 14 | 55188 | 4679 | 2806 | 2249 | 1185 | 1544 | 4345 | 1 | 10 | 2417 | 902 | 554 | 686 | 76580 | 0.53 | 0.47 |
| District | 7882 | 51896 | 503911 | 185977 | 120675 | 11004 | 8232 | 129031 | 104696 | 4742 | 981 | 65858 | 63412 | 7408 | 37885 | 1303590 | 0.20 | 0.80 |
Table text extracted from the original PDF; superscript letters are shown inline. The original table image is below.
View original table image
| Tehsils | Rice | Wheat | Jowar | Bajara | Gram | Tur | Mung | Sugarcane | Cotton | Groundnut | Sunflower | Soyabean | Fodder Crops | Total Fruits | Total Vegetables | Total NSA | 𝚺𝐗² (𝚺𝐗)² | 𝚺𝐗² 𝟏− (𝚺𝐗)² |
|---|---|---|---|---|---|---|---|---|---|---|---|---|---|---|---|---|---|---|
| Kopargaon | 0 | 8513 | 1094 | 1002 | 5328 | 56 | 181 | 7397 | 1680 | 306 | 0 | 25495 | 10576 | 530 | 10022 | 72180 | 0.20 | 0.80 |
| Rahata | 0 | 8689 | 3474 | 1183 | 10385 | 97 | 64 | 18246 | 1422 | 512 | 0 | 25323 | 16522 | 653 | 4115 | 90685 | 0.18 | 0.82 |
| Akole | 17260 | 5476 | 449 | 1392 | 3207 | 11 | 10 | 1980 | 0 | 1213 | 44 | 19773 | 5255 | 927 | 16264 | 73261 | 0.19 | 0.81 |
| Sangamner | 16 | 5290 | 4886 | 14522 | 4237 | 63 | 206 | 4525 | 2783 | 2058 | 5 | 21067 | 30658 | 424 | 15537 | 106277 | 0.17 | 0.83 |
| Shrirampur | 0 | 8772 | 908 | 203 | 5950 | 52 | 54 | 5389 | 5754 | 191 | 2 | 15627 | 10920 | 359 | 9730 | 63911 | 0.16 | 0.84 |
| Newasa | 0 | 17894 | 1549 | 3940 | 5475 | 3968 | 342 | 30554 | 29796 | 607 | 0 | 12179 | 20228 | 674 | 20815 | 148021 | 0.15 | 0.85 |
| Rahuri | 0 | 9806 | 2827 | 3752 | 2812 | 408 | 20 | 10707 | 17143 | 517 | 0 | 8300 | 16772 | 333 | 12278 | 85675 | 0.17 | 0.83 |
| Shevgaon | 0 | 10804 | 3681 | 2990 | 6467 | 9563 | 426 | 11217 | 46866 | 649 | 5 | 1537 | 4913 | 417 | 9859 | 109394 | 0.23 | 0.77 |
| Pathardi | 0 | 8509 | 21922 | 15047 | 10003 | 13017 | 3146 | 3419 | 33377 | 1732 | 0 | 2985 | 10762 | 461 | 11822 | 136202 | 0.13 | 0.87 |
| Nagar | 0 | 9390 | 24792 | 6215 | 10399 | 4754 | 6527 | 1130 | 1121 | 234 | 117 | 19556 | 16736 | 659 | 23457 | 125087 | 0.14 | 0.86 |
| Parner | 0 | 5194 | 38877 | 17713 | 7655 | 2170 | 16099 | 3834 | 116 | 335 | 0 | 12507 | 26020 | 580 | 48006 | 179106 | 0.13 | 0.83 |
| Shrigonda | 0 | 8544 | 17653 | 12029 | 5479 | 5562 | 1832 | 26443 | 7445 | 1795 | 33 | 2197 | 24965 | 5500 | 32744 | 152221 | 0.13 | 0.87 |
| Karjat | 0 | 10081 | 30556 | 7061 | 12136 | 15330 | 328 | 15138 | 5452 | 196 | 3 | 247 | 18728 | 474 | 18217 | 133947 | 0.13 | 0.87 |
| Jamkhed | 0 | 2055 | 41006 | 667 | 6495 | 7176 | 2269 | 2680 | 387 | 120 | 0 | 22275 | 3523 | 453 | 7222 | 96328 | 0.25 | 0.75 |
| District | 17276 | 119020 | 193674 | 87716 | 96028 | 62227 | 31504 | 142659 | 153342 | 10465 | 209 | 189068 | 216578 | 12444 | 240088 | 1572298 | 0.10 | 0.90 |
Table text extracted from the original PDF; superscript letters are shown inline. The original table image is below.
View original table image
References
21 in the original paper- Adnaik N. Changes in general land use pattern in the drought prone region of Maharashtra. In: Raymane AS, editor. Population and Resources. Vol. 2. 2012. p. 267275.
- Bhatia SS. A new measure of crop concentration. Econ Geogr. 1967;43(2):132-138.
- Chand R, Chauhan S. Diversification in agriculture: implications for growth and stability. Indian J Agric Econ. 2002;57(4):637-648.
- Chavhan GK. Analysis of work done on temporal changes in agricultural land use patterns in India from 1985 to 2010. Agric For Curr Trends Perspect. 2020;1. International Journal of Agriculture and Food Science https://www.agriculturaljournals.com
- Chavhan GK, Pagare SR, Najan RE, Rashinkar BG. Analysis of sustainable agricultural development in Ahmednagar District of Maharashtra (India). Waffen Kostumkunde J. 2020;11(2):250-258.
- Deshpande CD. India: a regional interpretation. New Delhi; 1992.
- Enyedi GY. Geographical types of agriculture. Budapest: Applied Geography in Hungary; 1964.
- Datta S. A spatio-temporal analysis of crop diversification in Hugli district, West Bengal. Geo Analyst. 2012;2(1):71-81.
- Gibbs J, Martin W. Index of diversification. In: Hammond R, McCullagh PS, editors. Quantitative Techniques in Geography: An Introduction. Oxford: Clarendon Press; 1962. p. 21.
- Gibbs J, Martin W. Urbanization, technology and the division of labour: international pattern. Am Sociol Rev. 1962;27(5).
- Hussain M. Agricultural geography. Delhi: Intra-India Publication; 1979.
- Joshi PK, Gulati A, Birthal PS, Tewari L. Agriculture diversification in South Asia: patterns, determinants, and policy implications. Econ Polit Wkly. 2004;39(24):2457-2467.
- Kothari CR. Research methodology: methods and techniques. 2nd ed. New Delhi: Wiley Eastern; 1990.
- Kumar P, Jain R. Crop diversification in Madhya Pradesh: an empirical analysis. Agric Econ Res Rev. 2012;25(2):245-252.
- Mehta R. Crop diversification in Gujarat: an empirical analysis. Agric Econ Res Rev. 2009;22(1):83-88.
- Pingali P, Rosegrant MW. Agricultural commercialization and diversification: processes and policies. Food Policy. 1995;20(3):171-185.
- Najan RE, Chavhan GK. Agricultural cropping pattern and diversification in part of Ahmednagar district -a geographical analysis. J e-Sci Lett. 2022;22-28. doi:http://dx.doi.org/10.46890/SL.2022.v03i03.004
- Raju VT, Reddy AA. Cropping pattern and crop diversification in Andhra Pradesh. Indian J Agric Econ. 1990;45(4):561-567.
- Singh J, Dhillon SS. Agricultural geography. 2nd ed. New Delhi: Tata McGraw-Hill; 2005.
- Singh RP, Singh KM, Jha AK. Crop diversification in eastern India: trends and determinants. Agric Situ India. 2006;62(6):407-414.
- Office of the Registrar General & Census Commissioner, India. Census of India 2011 [Internet].