
Research article · 2025 · Full text
International Journal of Agriculture and Food ScienceBusiness analysis of dal mill (Krishi Sahyog farmers producer company Ltd.)
Volume 7(8) · Pages 191–196 · DOI: 10.33545/2664844x.2025.v7.i8c.611 ↗
Research areasAgricultural Economics and Practices
Abstract
Author-writtenThe present study undertakes a comprehensive economic analysis of pigeon pea (Cajanus cajan) cultivation and its subsequent processing under a Farmer Producer Company (FPC) framework, specifically examining the Krishi Sahyog Farmers Producer Company Ltd., situated in Amravati district of Maharashtra. With pigeon pea being a drought-tolerant, protein-rich pulse crop critical to Indian food security, this study aims to evaluate both farm-level production economics and post-harvest value addition processes to assess financial viability and operational efficiency within an organized producer structure. Primary and secondary data were collected from 60 member farmers and processing unit stakeholders. The input utilization pattern per hectare included 20.9 person-days of hired labour, 11.16 days of family labour, 5.98 bullock-pair days, and 4.91 hours of machine use. Inputs such as 12.74 qt of seed, 3.9 tonnes of manure, and macro-nutrients (N, P, K) were documented, with total cultivation cost (Cost C) computed at ₹78,322.21/ha and a benefit-cost ratio (B:C) of 1.54 indicating a 54% return on investment, thus confirmin g the economic sustainability of pigeon pea farming. For the processing unit, a detailed cost analysis revealed total fixed costs of ₹4,48,800 and variable costs of ₹1,30,75,242, with the latter dominated by raw material procurement (91.78%). The processing cost per quintal stood at ₹6,762.02, with a total cost incurred per quintal (including marketing and raw material) reaching ₹13,892.02. With a recovery rate of 62.5%, the mill produced 1,250 qt of Tur dal from 2,000 qt of raw pigeon pea, achieving a gross return of ₹1.62 crore and net returns of ₹27.26 lakh, yielding a processing B:C ratio of 1.20. Constraints identified include pest infestation, price fluctuation, inadequate cleaning and drying, and lack of skilled labour, which impact both efficiency and profitability. These findings underscore the critical role of FPCs in enhancing value-chain integration, reducing transaction costs, and improving rural livelihoods. The study concludes that strategic support for FPC-led infrastructure, training, and market linkages can significantly elevate the socio-economic outcomes for smallholder pulse producers in India.
Summary
Source-checkedPlain-language reading of the full paper, prepared with AI and checked against the text. Each point links to the authors' own words.
Why it matters
- Pigeon pea is a protein-rich, drought-tolerant pulse crop that is essential for food security in India. View evidence ↗
- Farmer Producer Companies (FPCs) are legal entities that allow farmers to collectively manage input procurement, processing, value addition, and marketing. View evidence ↗
- FPCs aim to improve farmer welfare by reducing transaction costs and improving market access through shared services and infrastructure. View evidence ↗
The question
- The study aims to assess the operational efficiency and financial viability of pigeon pea production and post-harvest processing within an FPC framework. View evidence ↗
What they did
- The research analyzed the economics of pigeon pea cultivation and processing at the Krishi Sahyog FPC in Amravati, Maharashtra, during the 2024-25 financial year. View evidence ↗
- The study sampled 60 FPC-member farmers, with 20 farmers selected from each of the three tehsils: Partawada, Chandur Bazar, and Achalpur. View evidence ↗
- Primary data was gathered through personal interviews with member farmers, FPC supervisors, and officials using pre-tested schedules. View evidence ↗
What they found
- The total cost of cultivation (Cost C) for pigeon pea was calculated at ₹78,322.21 per hectare. View evidence ↗
- The processing unit's annual fixed costs totaled ₹4,48,800, primarily driven by construction and machinery depreciation. View evidence ↗
- From 2,000 quintals of raw pigeon pea, the mill produced 1,250 quintals of Tur dal, representing a recovery rate of 62.5%. View evidence ↗
- The most critical constraints facing the dal mill were pest infestation and price volatility. View evidence ↗
What it means
- The authors conclude that FPCs have strategic potential to improve smallholder farmer livelihoods through market integration and economies of scale. View evidence ↗
- The authors recommend policy interventions focused on affordable credit, digital market access, skill development, and improved drying and cold storage infrastructure. View evidence ↗
- The study identifies structural and logistical limitations such as labor shortages, inadequate post-harvest practices, and limited access to formal capital and markets. View evidence ↗
Visual summary
1 visualsIllustrations explain the paper; they do not show study data.
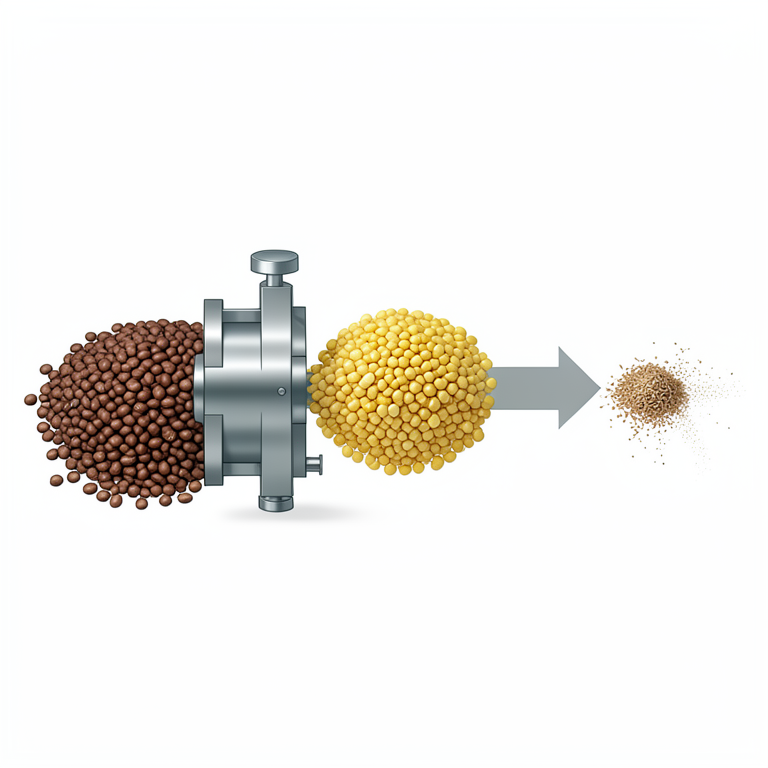
Pigeon Pea Processing Flow
AI-generated conceptual illustration (pigeon pea seeds and a dal milling machine). It explains the idea and does not show study data.
View source evidence ↗Figures & tables
From the original paper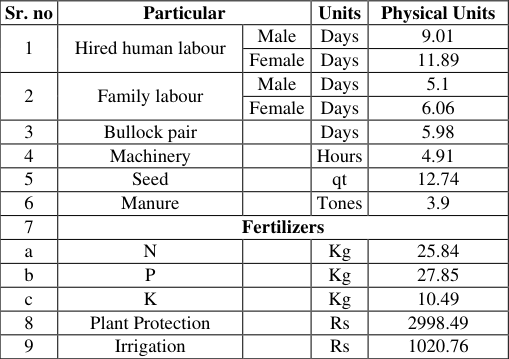 Table 1
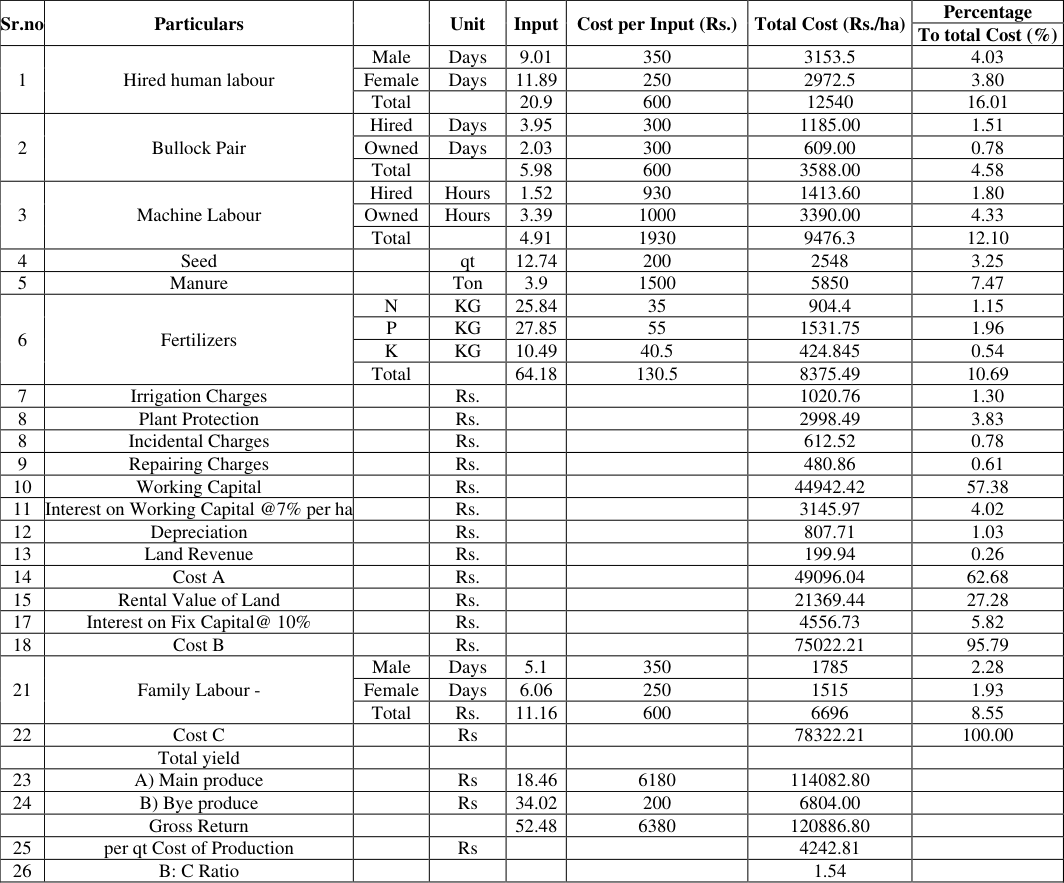 Table 2
 Table 3
 Table 5
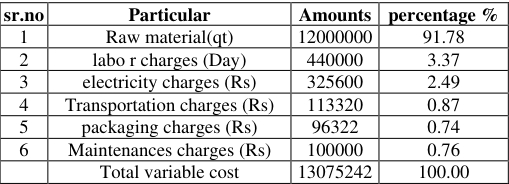 Table 4
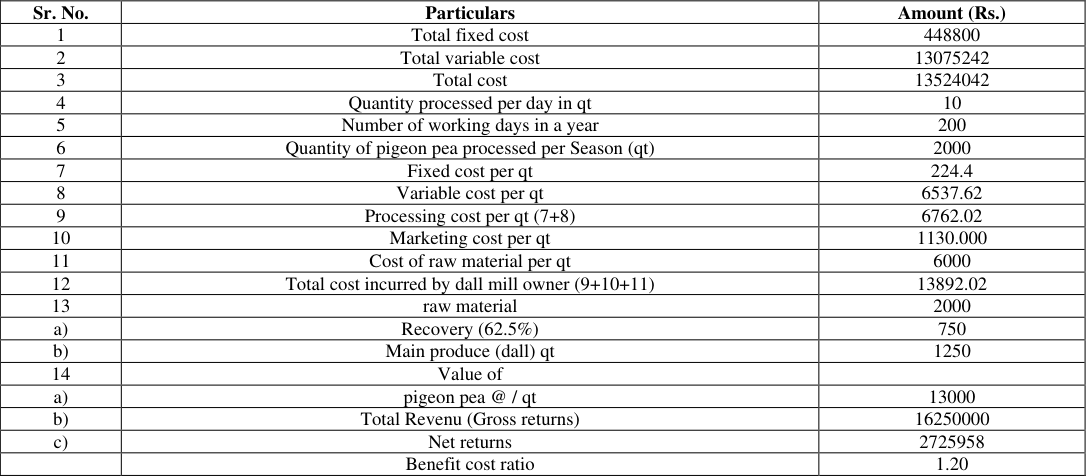 Table 6
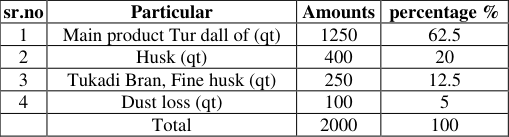 Table 7
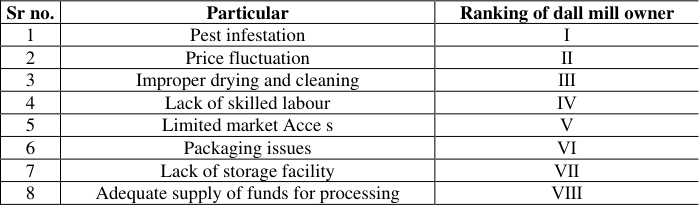 Table 8
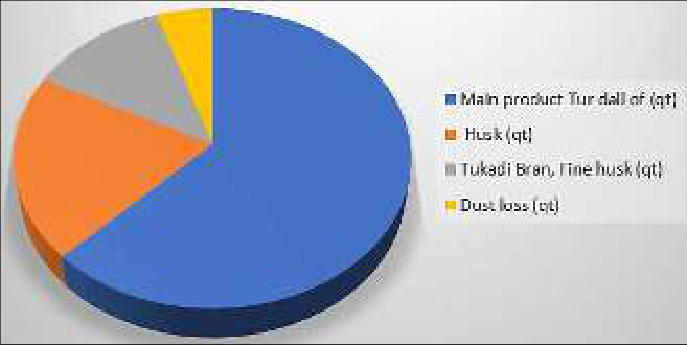 Figure 1
Introduction
India's agriculture sector, largely dominated by small and marginal farmers, has been witnessing structural changes. To empower farmers and improve their incomes, the concept of Farmer Producer Companies (FPCs) has been introduced. FPCs are legally recognized entities formed by farmers to collectively undertake activities related to input procurement, value addition, processing, and marketing. These organizations help in improving market access, reducing transaction costs, and enhancing farmer welfare through shared infrastructure and services. Among agricultural products, pulses play a vital role due to their high protein content and nitrogen-fixing ability, which improves soil fertility. Tur (pigeon pea) is a major pulse crop cultivated extensively in India, particularly in Maharashtra, which is the leading state in tur production. Pigeon pea is drought-tolerant, rich in protein, and commonly processed into "dal," a staple food in Indian households. Krishi Sahyog Farmers Producer Company Ltd., established in 2019 in Asegaon Purna, Amravati, Maharashtra, exemplifies the role of FPCs in enhancing value through processing. The company operates a dal mill and seed processing unit, supporting over 600 farmer-members. It provides services like procurement, processing, marketing, and value addition of tur dal, ensuring better prices and market access. This study focuses on understanding the economics and operational effectiveness of such FPCs, specifically in the pigeon pea sector. It aims to analyze the cost of cultivation and processing, break-even points, and challenges faced by the owner. The findings will contribute to policy recommendations for strengthening FPCs and improving sustainability and profitability in pulse production.
Objectives
• To work out cost of cultivation of pigeon pea of selected of farmer member.
• To work out cost of processing of pigeon pea.
• To identify constraints faced of processed product of pigeon pea.
Material and Methods
This study was conducted to analyze the economic aspects of pigeon pea (tur dal) cultivation, and processing by Krishi Sahog Farmers Producer Company Ltd. in Asegaon Purna, Tq. Chandur Bazar, Dist. Amravati (Maharashtra), during the financial year 2024 25. The aim was to assess cost structures, returns, processing cost and constraints in pigeon pea processing under an FPC framework.
Area of Study
The research was undertaken at the Krishi Sahyog FPC, which specializes in pigeon pea processing (dal milling). The unit is situated along Amravati Partawada Road near Purna Nagar in Asegaon Purna.
Period of Study
The study focused on data from the financial year 2024-25.
Source of Data
Both primary and secondary data sources were utilized:
• Primary Data: Collected via personal interviews using pre-tested schedules with FPC officials, supervisors, and member farmers regarding production, costs, marketing, and constraints.
• Secondary Data: Gathered from company reports, published documents, websites, and government records.
Sample Size
The study selected three tehsils in Amravati district Partawada, Chandur Bazar, and Achalpur. From each tehsil, 20 FPC-member farmers were chosen, totalling 60 farmers. Additionally, a representative APMC, vendors, and processors were selected based on availability.
Analytical Tools
Standard cost concepts were applied:
• Cost A: Hired labour (human, bullock, machine), seed, manure, fertilizers, plant protection, repairs, incidental charges, working capital, and interest on working capital (6% annually).
1) Fixed cost
The fixed cost includes the data regarding the cost of machinery, building, land, furniture, wages of payment employed abour, salary of staff, electricity charges, taxes, etc. collected from selected unit.
2) Variable Cost:
The variable cost consists of expenditure on purchase of raw material, wages of casual labour, electricity, stationery, repair and maintenance of machinery, etc.
3) Total Cost
Total cost of processing comprised of the total fixed cost; total variable cost was calculated by adding these costs together Total cost = Fixed cost + Variable cost constraints Faced
The constraints encountered during the processing of pigeon pea were identified through personal interviews with the FPC owner and staff. These included price fluctuations, infrastructural limitations, and climatic uncertainties affecting quality and quantity of processed dal. Table 4. presents the total variable cost involved in the processing of pigeon pea. The majority of the variable cost (91.78%) is attributed to the procurement of raw material, highlighting its critical role in overall expenditure. Labour charges contribute 3.37%, while electricity costs account for 2.49% of the total. Additional expenses such as transportation (0.87%), packaging (0.74%), and maintenance (0.76%) make up the remaining share. The total variable cost amounts to ₹1,30,75,242, reflecting the operational expenses directly linked to the volume of production. The gross return from the sale of processed dal at ₹13,000 per quintal amounts to ₹1,62,50,000. After deducting total costs, the net return stands at ₹27,25,958, resulting in a benefit-cost ratio of 1.20. This indicates that the pigeon pea processing unit is economically viable, generating a reasonable profit over operational expenses. Table 7. Presents the recovery and returns from the processing of 2,000 quintals of pigeon pea. The primary output is Tur dal, which constitutes 62.5% (1,250 qt) of the total processed quantity, reflecting the efficiency of the milling process. By-products include husk (20%), tukadi bran and fine husk (12.5%), and dust loss (5%). This recovery pattern highlights the proportion of usable produce and by-products, which can be further utilized or sold, contributing to the overall profitability and resource optimization of the processing unit.
| sr.no | Particular | Amounts | percentage % |
|---|---|---|---|
| 1 | Main product Tur dall of (qt) | 1250 | 62.5 |
| 2 | Husk (qt) | 400 | 20 |
| 3 | Tukadi Bran, Fine husk (qt) | 250 | 12.5 |
| 4 | Dust loss (qt) | 100 | 5 |
| Total | 2000 | 100 |
Table text extracted from the original PDF; superscript letters are shown inline. The original table image is below.
View original table image
| sr.no | Particular | Amounts | percentage % |
|---|---|---|---|
| 1 | Raw material(qt) | 12000000 | 91.78 |
| 2 | labo r charges (Day) | 440000 | 3.37 |
| 3 | electricity charges (Rs) | 325600 | 2.49 |
| 4 | Transportation charges (Rs) | 113320 | 0.87 |
| 5 | packaging charges (Rs) | 96322 | 0.74 |
| 6 | Maintenances charges (Rs) | 100000 | 0.76 |
| Total variable cost | 13075242 | 100.00 |
Table text extracted from the original PDF; superscript letters are shown inline. The original table image is below.
View original table image
Figures and tables from the paper
| Sr. no | Particular | — | Units | Physical Units |
|---|---|---|---|---|
| 1 | Hired human labour | Male | Days | 9.01 |
| Female | Days | 11.89 | ||
| 2 | Family labour | Male | Days | 5.1 |
| Female | Days | 6.06 | ||
| 3 | Bullock pair | Days | 5.98 | |
| 4 | Machinery | Hours | 4.91 | |
| 5 | Seed | qt | 12.74 | |
| 6 | Manure | Tones | 3.9 | |
| 7 | Fertilizers | |||
| a | N | Kg | 25.84 | |
| b | P | Kg | 27.85 | |
| c | K | Kg | 10.49 | |
| 8 | Plant Protection | Rs | 2998.49 | |
| 9 | Irrigation | Rs | 1020.76 |
Table text extracted from the original PDF; superscript letters are shown inline. The original table image is below.
View original table image
| Sr.no | Particulars | — | Unit | Input | Cost per Input (Rs.) | Total Cost (Rs./ha) | Percentage |
|---|---|---|---|---|---|---|---|
| To total Cost (%) | |||||||
| 1 | Hired human labour | Male | Days | 9.01 | 350 | 3153.5 | 4.03 |
| Female | Days | 11.89 | 250 | 2972.5 | 3.80 | ||
| Total | 20.9 | 600 | 12540 | 16.01 | |||
| 2 | Bullock Pair | Hired | Days | 3.95 | 300 | 1185.00 | 1.51 |
| Owned | Days | 2.03 | 300 | 609.00 | 0.78 | ||
| Total | 5.98 | 600 | 3588.00 | 4.58 | |||
| 3 | Machine Labour | Hired | Hours | 1.52 | 930 | 1413.60 | 1.80 |
| Owned | Hours | 3.39 | 1000 | 3390.00 | 4.33 | ||
| Total | 4.91 | 1930 | 9476.3 | 12.10 | |||
| 4 | Seed | qt | 12.74 | 200 | 2548 | 3.25 | |
| 5 | Manure | Ton | 3.9 | 1500 | 5850 | 7.47 | |
| 6 | Fertilizers | N | KG | 25.84 | 35 | 904.4 | 1.15 |
| P | KG | 27.85 | 55 | 1531.75 | 1.96 | ||
| K | KG | 10.49 | 40.5 | 424.845 | 0.54 | ||
| Total | 64.18 | 130.5 | 8375.49 | 10.69 | |||
| 7 | Irrigation Charges | Rs. | 1020.76 | 1.30 | |||
| 8 | Plant Protection | Rs. | 2998.49 | 3.83 | |||
| 8 | Incidental Charges | Rs. | 612.52 | 0.78 | |||
| 9 | Repairing Charges | Rs. | 480.86 | 0.61 | |||
| 10 | Working Capital | Rs. | 44942.42 | 57.38 | |||
| 11 | Interest on Working Capital @7% per ha | Rs. | 3145.97 | 4.02 | |||
| 12 | Depreciation | Rs. | 807.71 | 1.03 | |||
| 13 | Land Revenue | Rs. | 199.94 | 0.26 | |||
| 14 | Cost A | Rs. | 49096.04 | 62.68 | |||
| 15 | Rental Value of Land | Rs. | 21369.44 | 27.28 | |||
| 17 | Interest on Fix Capital@ 10% | Rs. | 4556.73 | 5.82 | |||
| 18 | Cost B | Rs. | 75022.21 | 95.79 | |||
| 21 | Family Labour - | Male | Days | 5.1 | 350 | 1785 | 2.28 |
| Female | Days | 6.06 | 250 | 1515 | 1.93 | ||
| Total | Rs. | 11.16 | 600 | 6696 | 8.55 | ||
| 22 | Cost C | Rs | 78322.21 | 100.00 | |||
| Total yield | |||||||
| 23 | A) Main produce | Rs | 18.46 | 6180 | 114082.80 | ||
| 24 | B) Bye produce | Rs | 34.02 | 200 | 6804.00 | ||
| Gross Return | 52.48 | 6380 | 120886.80 | ||||
| 25 | per qt Cost of Production | Rs | 4242.81 | ||||
| 26 | B: C Ratio | 1.54 |
Table text extracted from the original PDF; superscript letters are shown inline. The original table image is below.
View original table image
| Sr.no | Particular | Amounts | Percentage % |
|---|---|---|---|
| 1 | Depreciation of construction @5 % | 200000 | 44.56 |
| 2 | Depreciation of Machinery @10 % | 150000 | 33.42 |
| 3 | Depreciation of furniture @10 % | 9000 | 2.01 |
| 4 | Depreciation of Appliances and fixture @10% | 35800 | 7.98 |
| 5 | Depreciation of Vehicles @10% | 54000 | 12.03 |
| Total Fixed cost | 448800 | 100.00 |
Table text extracted from the original PDF; superscript letters are shown inline. The original table image is below.
View original table image
| sr no | particular | Amounts | Percentage (%) |
|---|---|---|---|
| 1 | Fixed cost | 448800 | 3.32 |
| 2 | Variable cost | 13075242 | 96.68 |
| Total cost | 13524042 | 100 |
Table text extracted from the original PDF; superscript letters are shown inline. The original table image is below.
View original table image
| Sr. No. | Particulars | Amount (Rs.) |
|---|---|---|
| 1 | Total fixed cost | 448800 |
| 2 | Total variable cost | 13075242 |
| 3 | Total cost | 13524042 |
| 4 | Quantity processed per day in qt | 10 |
| 5 | Number of working days in a year | 200 |
| 6 | Quantity of pigeon pea processed per Season (qt) | 2000 |
| 7 | Fixed cost per qt | 224.4 |
| 8 | Variable cost per qt | 6537.62 |
| 9 | Processing cost per qt (7+8) | 6762.02 |
| 10 | Marketing cost per qt | 1130.000 |
| 11 | Cost of raw material per qt | 6000 |
| 12 | Total cost incurred by dall mill owner (9+10+11) | 13892.02 |
| 13 | raw material | 2000 |
| a) | Recovery (62.5%) | 750 |
| b) | Main produce (dall) qt | 1250 |
| 14 | Value of | |
| a) | pigeon pea @ / qt | 13000 |
| b) | Total Revenu (Gross returns) | 16250000 |
| c) | Net returns | 2725958 |
| Benefit cost ratio | 1.20 |
Table text extracted from the original PDF; superscript letters are shown inline. The original table image is below.
View original table image
| Sr no. | Particular | Ranking of dall mill owner |
|---|---|---|
| 1 | Pest infestation | Ⅰ |
| 2 | Price fluctuation | Ⅱ |
| 3 | Improper drying and cleaning | Ⅲ |
| 4 | Lack of skilled labour | Ⅳ |
| 5 | Limited market Acce s | Ⅴ |
| 6 | Packaging issues | Ⅵ |
| 7 | Lack of storage facility | Ⅶ |
| 8 | Adequate supply of funds for processing | Ⅷ |
Table text extracted from the original PDF; superscript letters are shown inline. The original table image is below.
View original table image
References
8 in the original paper- Chavan R. Cost and returns of pigeon pea cultivation in Maharashtra. Indian Journal of Economics and Development. 2012;8(2):112-116.
- Chole RR, Patil SJ. Cost structure in pigeon pea farming under different holding. Maharashtra Journal of Agricultural Economics. 2011;28(1):18-23.
- Deshmukh VP. Cost of production and profitability in pigeon pea cultivation. Research Journal of Agricultural Sciences. 2021;35(1):102-107.
- Gaur PM. Comparative analysis of cost of cultivation of pulses. ICAR Research Bulletin. 2015;20(3):21-29.
- Nimbalkar S, Khobragade P. Constraints in value chain of pigeon pea processing. MAU Research Digest. 2021;36(1):53-58.
- Pawar N, Zade P. Constraints in dal mill operations in Vidarbha. Vidarbha Agri Economics Journal. 2020;15(2):60-65.
- Patil MD. Cost efficiency in pulses farming. Agricultural Economics Review. 2016;24(2):87-92.
- Mahapatra A. Post-harvest processing costs of pulses. Indian Journal of Post Harvest Technology. 2016;4(1):44-50.