
Research article · 2025 · Full text
International Journal of Biology SciencesMalaria vectors composition and vectorial transmission indices in selected rural and urban areas of Imo state, Nigeria
Volume 7(8) · Pages 06–12 · DOI: 10.33545/26649926.2025.v7.i8a.433 ↗
Research areasMalaria Research and ControlCOVID-19 epidemiological studiesDigital Imaging for Blood Diseases
Abstract
Author-writtenA combined field and laboratory investigation was conducted in selected communities from Obowo and Owerri North Local Government Areas of Imo State to determine the status of malaria in relation to mosquito vector for rainy and dry seasons. The pyrethrum knock down technique (PKD) was employed ones monthly in the morning hours (6:00am-10.00am) for collection of mosquitoes. The mosquitoes caught were taken to the Laboratory for identification, dissection and infectivity assessment using standard methods. Two malaria vectors Anopheles gambiae and Anopheles funestus sl were identified as major vectors of the disease. The proportions of indoor resting An. gambiae (53.6% vs 46.37%) and An. funestus (50.00% vs 50.00%) did not differ significantly for urban and rural areas (p>0.05). similarly, their indoor resting densities (IRD) 1.43% vs 1.45% as well as average bite/person/night (0.95 vs 1.16) had no difference between rainy and dry seasons. The proportions of the vectors and human biting rates (HBR) 1.56% vs 1.25% were comparable. July (55.75%) and May (50.60%) had the highest mosquito for rainy season while December (56.4%) and October (47.3%) for dry season. In these areas, the proportions of the transmitting vectors could not differ (p>0.05). Overall, sporozoite infection rates were 83.33% and 16.33% for species from urban and rural areas respectively. Monthly variations in density and parity were 57.95% and 42.04% for An. gambiae and An. funestus while monthly entomological inoculation rates (EIR), monthly biting rate (MBR) and monthly sporosites rate (SPR) were 0.021, 1,86% and 1.17% accordingly. HBR, SPR and EIR between urban and rural areas were (0.87% vs 0.98%), (0.41% vs 1.85%), (0.003 vs 0.018) respectively. From the results of this study it appeared that An. gambiae and An. funestus had vectorial capacity in malaria transmission despite low infectivity rate of salivary glands. The comparable rates of infection between urban and rural areas is a serious concern and could indicate the dynamics of vectors and infection status. This put to rest discrepancies about the relationship between malaria transmission and vector composition and signals the scalling up of integrated strategy that includes good environmental sanitation.
Summary
Source-checkedPlain-language reading of the full paper, prepared with AI and checked against the text. Each point links to the authors' own words.
Why it matters
- Malaria is the most significant vector-borne parasitic disease globally, remaining endemic in over 100 countries. View evidence ↗
- Nigeria has the highest global malaria burden, with roughly 51 million annual cases and 207,000 deaths, leaving 97% of its population at risk. View evidence ↗
- There is a lack of detailed information on the identity and distribution of malaria vectors in rural and urban areas of Imo State, Nigeria, which is needed to guide control efforts. View evidence ↗
The question
- The study aimed to investigate the composition, relative abundance, and roles of malaria vectors in transmission across areas with contrasting characteristics. View evidence ↗
What they did
- The research took place from July 2023 to May 2024 in four selected communities each from the Obowo and Owerri North Local Government Areas of Imo State. View evidence ↗
- Twenty-five households, consisting of 10 mud and 15 brick houses, were selected from each study area to represent the local housing. View evidence ↗
- The sporozoite rate was determined by dissecting the salivary glands of the mosquitoes following WHO (2013) standards. View evidence ↗
What they found
- Out of 1,224 collected mosquitoes, 53.51% (655) were from Obowo and 46.48% (569) were from Owerri-North. View evidence ↗
- Non-malaria transmitting mosquitoes were the most common (37.17%), followed by Anopheles gambiae (34.88%) and Anopheles funestus (27.94%). View evidence ↗
- There was no significant difference in the proportions of indoor resting An. gambiae (53.6% rural vs 46.37% urban) or An. funestus (50.00% rural vs 50.00% urban) between urban and rural areas. View evidence ↗
- Peak mosquito populations occurred in July (55.75%) and May (50.0%) during the rainy season, and in December (56.4%) and October (47.3%) during the dry season. View evidence ↗
- Sporozoite infection rates differed by area, with 83.33% in rural areas and 16.33% in urban areas. View evidence ↗
- The Entomological Inoculation Rate (EIR) was significantly higher in rural areas (0.018) than in urban areas (0.003). View evidence ↗
What it means
- The authors conclude that both urban and rural study areas require equal attention in malaria control and prevention interventions. View evidence ↗
- A major limitation was the reliance on morphological techniques for vector identification and infectivity assessment; the authors suggest that PCR would provide more reliable results. View evidence ↗
Visual summary
1 visualsIllustrations explain the paper; they do not show study data.
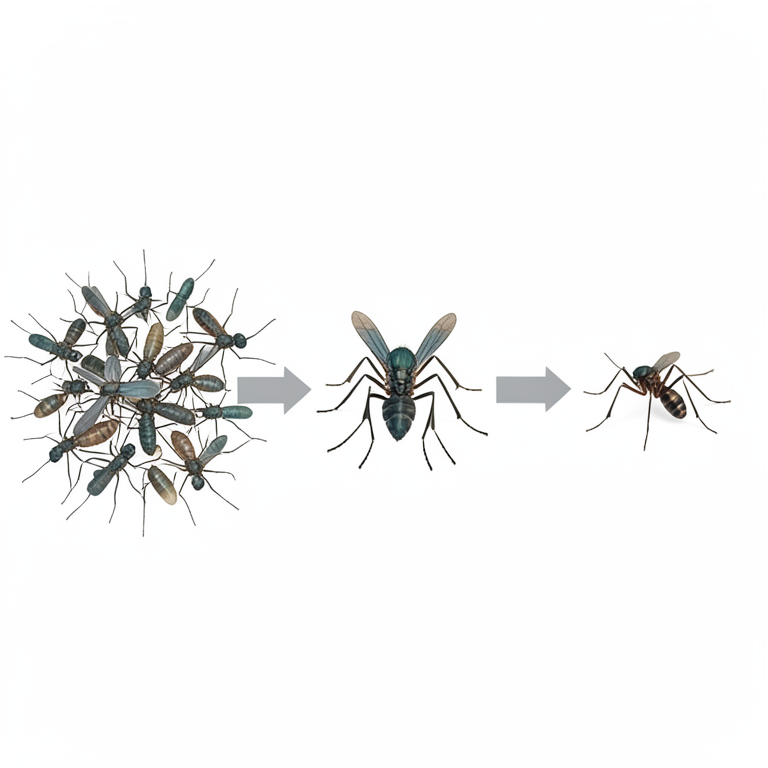
Vector Composition
AI-generated conceptual illustration (Anopheles gambiae, Anopheles funestus, and non-Anopheline mosquitoes). It explains the idea and does not show study data.
View source evidence ↗Figures & tables
From the original paper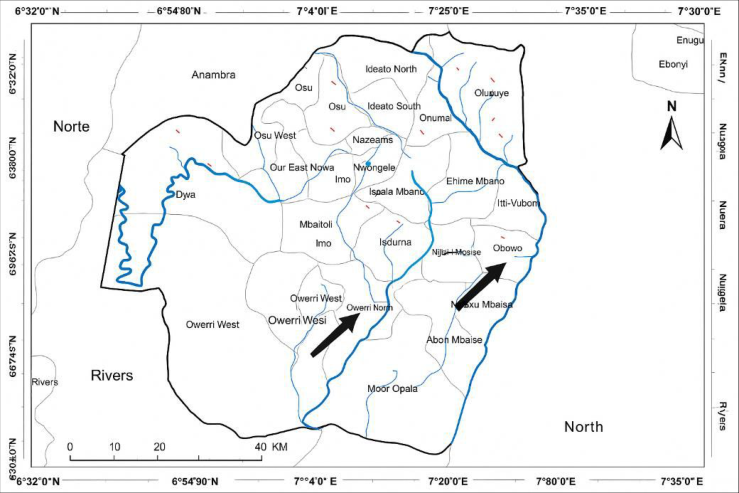 Figure 1
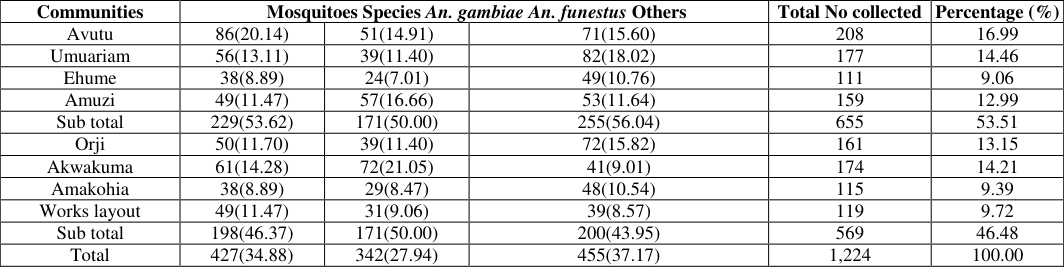 Table 1
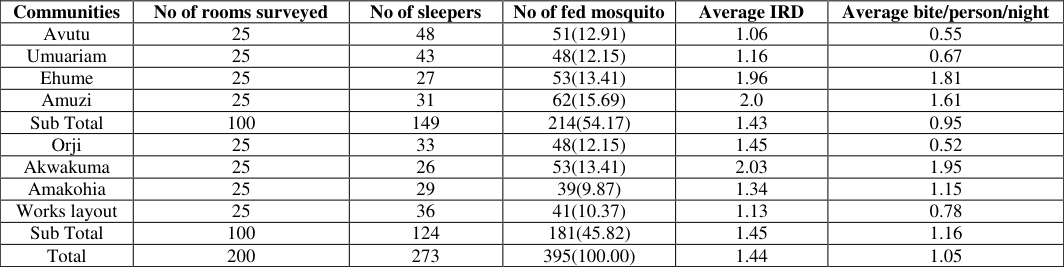 Table 2
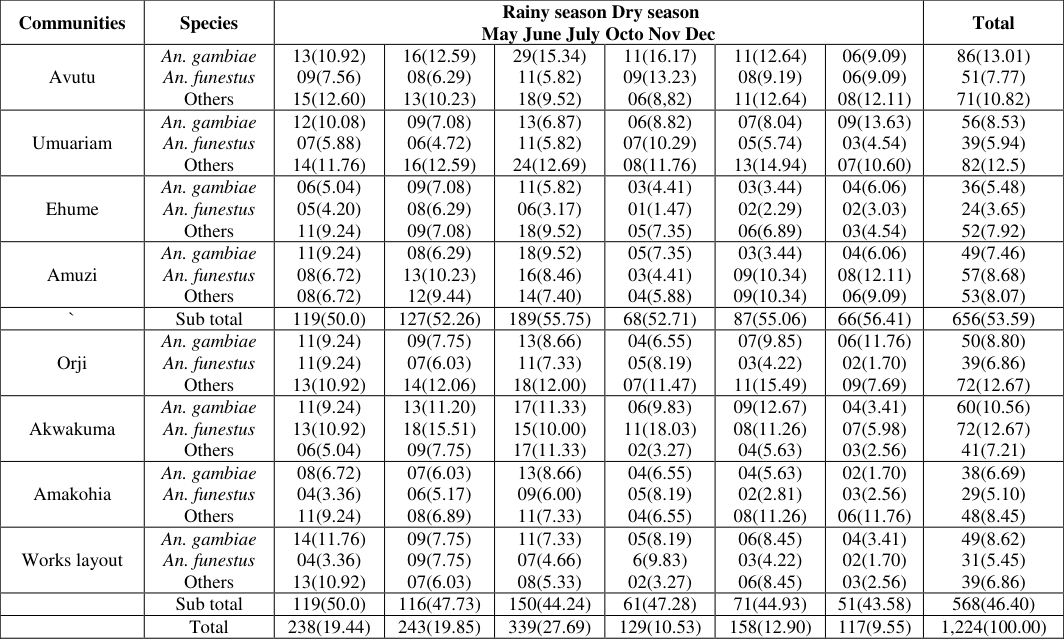 Table 3
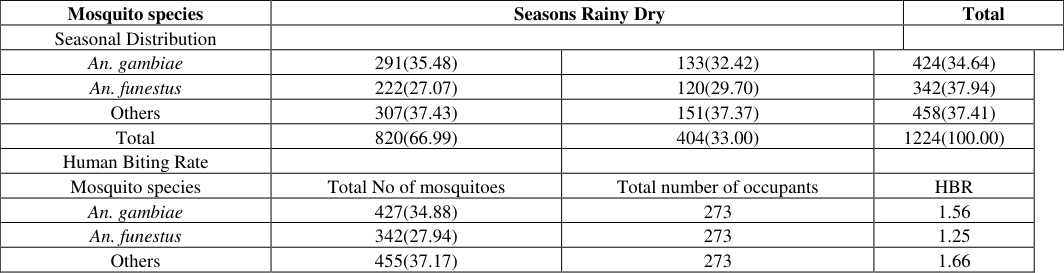 Table 4
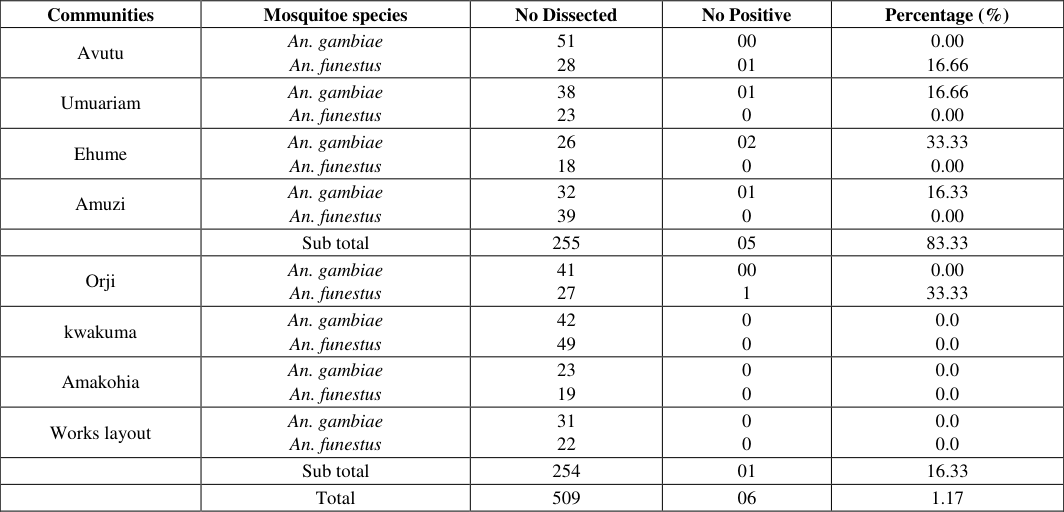 Table 5
 Table 6
 Table 7
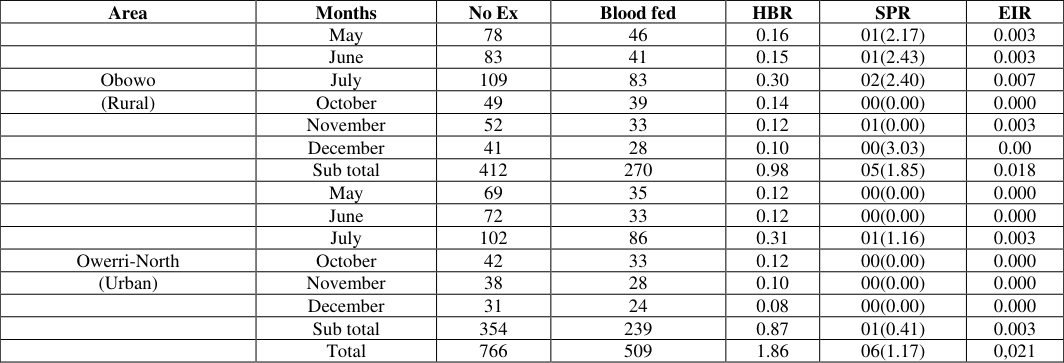 Table 8
Introduction
Despite impressive progress in malaria control interventions in many endemic countries, malaria remains the most important vector-borne parasitic disease worldwide and is endemic in more than 100 countries worldwide (WHO, 2009) [24] . Malaria caused by Plasmodium falciparum, and the mosquitoes Anopheles gambiae, Anopheles funestus, Anopheles arabiensis, and Anopheles moucheti are the major vectors that cause year-round transmission. It continues to be a major public health problem in 97 countries and territories in the tropics and subtropics. Globally, approximately 214 million cases of malaria occur annually and 3.2 billion people are at risk of infection (WHO, 2015) [27] . Approximately 438,000 deaths were attributed to malaria in 2015, particularly in sub-Saharan Africa, where an estimated 90% of all malaria deaths occur (WHO, 2015) [27] . Nigeria suffers the world's greatest malaria burden, with approximately 51 million cases and 207,000 deaths reported annually (approximately 30% of the total malaria burden in Africa), while 97% of the total population (approximately 173 million) is at risk of infection (WHO, 2014) [26] . Moreover, malaria accounts for 60% of outpatient visits to hospitals and led to approximately 11% maternal mortality and 30% child mortality, especially among children less than 5 years (WHO, 2014, NFMH, 2009) [24] . The vectors of malaria is the most wide spread in Africa and the most difficult to control (WHO, 2000) [23] . The human behavioral pattern is also a major epidemiological factor that impacts on disease transmission. In Nigeria, malaria is endemic and stable thus, a major cause of morbidity and mortality. The principal vectors Anopheles gambiae complex in Nigeria is closely associated with sunlit water collection close to human dwellings while An. funsestus sl another important vector tends to breed more in cool, clear, shaded, permanent water bodies undisturbed by humans (Onyindo et al., 2009) [18] . The transmission of species of human parasites depends on presence of both species of Anopheles and infected humans. The suitability of these vectors depends not only on physiological adaptation to the infection but also on other factors viz feeding preferences, hours of biting and flight, resting and breeding habits (Onyindo et al., 2009) [18] . Mosquito density together with Entomological Inoculation Rate (EIR) is a major determinant of malaria transmission. Despite the wide spread distribution, abundance and established roles of these malaria vectors transmission in Nigeria, information on the identity, distribution and transmission profiles remains scanty and unavailable to guide vector control activities in rural and urban areas of Imo State, Nigeria. This study was conducted to investigate the relative abundance, composition and roles of malaria vectors in malaria transmission in the study areas with contrasting characteristics
Materials and Methods
Materials and Methods
Study Area
The study was conducted in Four ( 4 [2,11,6] . In brief features contributing to perennial transmission in the areas are mainly due to population movement and favorable environmental factors that enhance insects breeding. The malaria vectors (Anopheles species) are very much potent with high anthropophilic index and frequent man biting habits. Above all, there could be presence of varying degree of resistance to insecticides and drugs (Okere AN 2024 Pers. Com).
Malaria
Malaria
Vectors Collection, Preservation and Identification
Due to uneven spread of households and status of the inhabitants, twenty five (25) households (10 mud and 15 bricks) were selected from each study area. This was to represent the houses in the area. Anthropophilic mosquitoes were collected using pyrethrum spray catches twice monthly during the hours of 6.00am and 10.00am (Mboera et al., 2006) [14] modified by Amaechi, 2009) [1] . The proportion of indoors mosquitoes were sampled by covering the floor with a white sheet of 5mX5m each edge held to the wall by a masking tape. The rooms were spread with pyrethrin insecticide and then left for 10 minutes with every opening (doors and windows) shut. Mosquitoes were collected thereafter with forcepts and emptied into petridish lined with normal saline and transported to Entomology laboratory of Imo State University Owerri for identification and processing. Upon collection, Anophelines were sorted from other mosquitoes and identified to species based on morphologyical features (Gilles and Coetzee 1987 and Gillies and De-Mellion, 1968) [9,8] Dissection and Parity Rate Determination After removing the wings and legs, the female mosquitoes were placed ventrally on a slide where dissection took place.
The mosquitoes were place by the thorax with the right hand needle while a small cut was made between the sixth and seventh sternite. The second needle was then used to extract the ovaries. Blood fed females were dissected to determine parity by observing the degree of ovarian trachioles (Detinova, 1962) [4] . Determination of Entomological Innoculation Rate (EIR) necessitated two other measurements; the sporozoite rate and the human biting rate. The abdominal and ovary dissection was conducted following the standard of WHO (1975). Ovaries with coiled tracheal skeins were considered as nulliparous while those stretched out tracheoles was taken to be parous as described by WHO (1975).
Sporozoite Rate Determination
This is the number of sporozoites found in the salivary gland of dissected Anophelin. The dissection of the salivary gland followed the technique of WHO (2013) [25] . Sporozoite rate which is the proportion of mosquitoes that tested positive for sporozoites.
Calculation of Annual Entomological Inoculation Rate
The EIR was calculated as the product of the sporozoite rate and the man biting rate (MA). The MA being the number of anopheline biting per person per night ie per human bait. EIR"h" where h equals MAS and is the daily number of infective bites received per person; M is the anopheline density in relation to human, A is the average number of person bitten by one mosquito in a day and S is the proportion of female anopheline with sporozoite. EIR is expressed as infective bites per person per month. Estimates of EIR by PSC are the product of sporozoite rate and MBR. MBR is obtained by multiplying the density per person of fed female mosquitoes (ie dividing the number of fed anopheline mosquitoes caught by number of occupants in the household) by the HBI.
Where F = total number of freshly fed mosquitoes in house M = human biting rate W = total number of human occupants.
Briefly, the PfEIR was calculated using the following formula:
Where EIR = Entomological Inoculation Rates HBR= Human Biting Rate. Which is the number of female Anopheles mosquitoes collected per house per night, and day
Data Analysis
Chi-Square was used to test for the significant difference in the species composition. Students t test was used to test the significant difference between IRD and HBR of the vectors in rainy and dry seasons. Anova was used to test the significant difference between IRD and MBR in the study areas.
Results
Table 1 demonstrated the Adult indoor malaria vectors and other mosquitoes in the study area. A total of 1,224 mosquitoes species were collected out of which 655(53.51%) were gotten from Obowo, while 569(46.48%) were gotten from Owerri-North. Non malaria transmitting mosquitoes were predominant (37.17%) followed by An. gambaie (34.88%), while An. funestus was the the least (27.94%) recovered mosquitoe. The differences between the malaria transmitting vectors were not statistically significant (p>0.05). Indoor resting densities and Man-biting rates of malaria vectors (Table 2) showed that a total of 200 rooms harbouring 273 sleepers were surveyed. Of the 1224 number of mosquitoes collected, 395(100.0%) were blood fed with Average IRD of (1.44) and Average bite/person/night (1.05). Although variations existed on the blood fed mosqitoes between rural and urban (54.2% vs 45.8%), there average IRD and average bite/per person per night did not differ (p>0.05). Adult mosquitoes composition and relative abundance (Table 3) indicated that the differences for rainy season and dry season catches (53.59% vs 46.40%) were not satistically significant (p˂0.05). Similarly, the proportions of Anopheles gambiae and An. funestus were not significantly different for the seasons (p˂0.05). Table 4 represented adult mosquito composition and relative abundance. July(55.75%) and May (50.0%) had the highest mosquito population for rainy season for both rural and urban respectively while for Dry season it was December (56.4%) and October (47.3%). In these areas the proportion of the transmitting vectors could not differ (p>0.05). The overall population and distribution of sporozoites (Table 5) revealed that in malaria vectors 06(1.17%) out of 509 Anopheles mosquitoes dissected were positive. Species from Obowo (rural) 83.33% had the highest prevalence than those from Owerri-North (urban) 33.33%. In Obowo, species from Ehume (33.33%) were the highest followed by species from Umuariam and Amuzi (16.66% and 16.66%) while mosquito species caught from Avutu recorded (0.00%) prevalence. On the contrary, in Owerri-North, species caught in Orji recorded (16.33%), while those from Akwakuma, Amakohia and Orji recorded zero prevalences (P<0.05). Table 6 summarized Monthly variations in density and parity of malaria vectors. From the table, An. gambaie had the highest population of species as well as more parous mosquitoes (424% and 57.95%) than An funestus (342 and 42.04%) (P<0.05). The majority of the parous mosquitoes were caught in July for An. gambaie (125 and 34.57%) followed by May (86 and 17.28%) while December (39 and 9.47%) produced the least (P<0.05). Similarly, more populations and parous An. funestus were caught in the month of July (86 and 31.30%) followed by June (75 and 16.35%) while December (33 and 11.21%) had the least (P<0.05). Table 7 summarized the Monthly EIR for Anopheline mosquitoes collected by PSC in the study area. Overall, the total Man Biting Rate was (1.86%), Sporozoite rate was (1.17%), while EIR (0.021). The month of July had the highest MBR (0.61%) followed by May (0.29%), while December had the least (0.19). Also for Sporozoite Rate (SPR), the month of July had the highest (1.77%) followed by November (1.63%), while October and December had zero SPR. Furthermore, the EIR for the study showed that the month of July had the highest (0.010), followed by May (0.003), June (0.003), November (0.003), while October and December had (0.000) EIR (P<0.05). Entomological Inoculation Rate between urban and rural communities (Table 8) showed that malaria vectors caught in rural area (0.018) had a higher Entomological Inoculation Rate compared to urban area species (0.003) (P<0.05). [13,10] which used morphological and dissection tools, our study identified Anopheles gambiae and Anopheles funestus as malaria transmitting vectors with no significant difference in distribution. Their indoor resting densities (1.43% vs 1.45%) could not differ between urban and rural. This is in line with CDC/USAID in Nigeria 2010 (Ezigwe et al., 2014) [7] . July (27.69%) had the highest number of malaria vectors while December had the least (9.55%). These observations differ from earlier survey where the densities increased with increasing rainfall (Onyirioha, 2004) [17] . One common agreement is that these studies identified An gambiae and An funestus as the main malaria transmitting vectors. Elsewhere another study that used enzyme linked Immunosorbent assay (ELISA) showed that the infectivity rate of Anopheles species varied 4.3% in the wet and 2.3% in the dry seasons (Oyewale et al 2007) [20] . The study equally recorded four Anopheles species in contrast to our findings. However, the similarity was that An gambiae was found to be the most abundant species. In another study, An gambaie was found to be abundant vector in four different ecological zones of Nigeria (Okwa et al 2009) [16] . All these findings point to the fact that An gambiae remains the dominant malaria vector in Nigeria. One major limitation of this study was the use of morphological techniques in the identification of malaria vectors and in the assessment of mosquito infectivity rates. More sensitive methods like PCR could have given more reliable results in characterizing the local malaria vectors as has been applied elsewhere (Oyewole et al 2005) [19] . This technique could be employed in the near future to re-characterise the malaria vectors composition in the study communities.
| Area | Months | No Ex | Blood fed | HBR | SPR | EIR |
|---|---|---|---|---|---|---|
| May | 78 | 46 | 0.16 | 01(2.17) | 0.003 | |
| June | 83 | 41 | 0.15 | 01(2.43) | 0.003 | |
| Obowo | July | 109 | 83 | 0.30 | 02(2.40) | 0.007 |
| (Rural) | October | 49 | 39 | 0.14 | 00(0.00) | 0.000 |
| November | 52 | 33 | 0.12 | 01(0.00) | 0.003 | |
| December | 41 | 28 | 0.10 | 00(3.03) | 0.00 | |
| Sub total | 412 | 270 | 0.98 | 05(1.85) | 0.018 | |
| May | 69 | 35 | 0.12 | 00(0.00) | 0.000 | |
| June | 72 | 33 | 0.12 | 00(0.00) | 0.000 | |
| July | 102 | 86 | 0.31 | 01(1.16) | 0.003 | |
| Owerri-North | October | 42 | 33 | 0.12 | 00(0.00) | 0.000 |
| (Urban) | November | 38 | 28 | 0.10 | 00(0.00) | 0.000 |
| December | 31 | 24 | 0.08 | 00(0.00) | 0.000 | |
| Sub total | 354 | 239 | 0.87 | 01(0.41) | 0.003 | |
| Total | 766 | 509 | 1.86 | 06(1.17) | 0,021 |
Table text extracted from the original PDF; superscript letters are shown inline. The original table image is below.
View original table image
| 1 | No Examined | Blood Fed | MBR | SPR | EIR |
|---|---|---|---|---|---|
| May | 147 | 81 | 0.29 | 01(1.23) | 0,003 |
| June | 155 | 74 | 0.27 | 01(1.35) | 0.003 |
| July | 211 | 169 | 0.61 | 03(1.77) | 0.10 |
| October | 91 | 72 | 0.26 | 00(0.00) | 0.000 |
| November | 90 | 61 | 0.22 | 01(1.63) | 0.003 |
| December | 72 | 52 | 0.19 | 00(0.00) | 0.000 |
| Total | 766 | 509 | 1.86 | 06(1.17) | 0.021 |
Table text extracted from the original PDF; superscript letters are shown inline. The original table image is below.
View original table image
| Months | An. Gambaie Density Parity | — | An. Funestus Density Parity | — |
|---|---|---|---|---|
| May | 86 | 51(17.28) | 61 | 30(14.01) |
| June | 80 | 39(13.22) | 75 | 35(16.35) |
| July | 125 | 102(34.57) | 86 | 67(31.30) |
| October | 44 | 39(13.22) | 47 | 33(15.42) |
| November | 50 | 36(12.20) | 40 | 25(11.68) |
| December | 39 | 28(9.49) | 33 | 24(11.21) |
| Total | 424 | 295(57.95) | 342 | 214(42.04) |
Table text extracted from the original PDF; superscript letters are shown inline. The original table image is below.
View original table image
| Mosquito species | Seasons Rainy Dry | — | — | Total | — |
|---|---|---|---|---|---|
| Seasonal Distribution | |||||
| An. gambiae | 291(35.48) | 133(32.42) | 424(34.64) | ||
| An. funestus | 222(27.07) | 120(29.70) | 342(37.94) | ||
| Others | 307(37.43) | 151(37.37) | 458(37.41) | ||
| Total | 820(66.99) | 404(33.00) | 1224(100.00) | ||
| Human Biting Rate | |||||
| Mosquito species | Total No of mosquitoes | Total number of occupants | HBR | ||
| An. gambiae | 427(34.88) | 273 | 1.56 | ||
| An. funestus | 342(27.94) | 273 | 1.25 | ||
| Others | 455(37.17) | 273 | 1.66 |
Table text extracted from the original PDF; superscript letters are shown inline. The original table image is below.
View original table image
| Communities | No of rooms surveyed | No of sleepers | No of fed mosquito | Average IRD | Average bite/person/night |
|---|---|---|---|---|---|
| Avutu | 25 | 48 | 51(12.91) | 1.06 | 0.55 |
| Umuariam | 25 | 43 | 48(12.15) | 1.16 | 0.67 |
| Ehume | 25 | 27 | 53(13.41) | 1.96 | 1.81 |
| Amuzi | 25 | 31 | 62(15.69) | 2.0 | 1.61 |
| Sub Total | 100 | 149 | 214(54.17) | 1.43 | 0.95 |
| Orji | 25 | 33 | 48(12.15) | 1.45 | 0.52 |
| Akwakuma | 25 | 26 | 53(13.41) | 2.03 | 1.95 |
| Amakohia | 25 | 29 | 39(9.87) | 1.34 | 1.15 |
| Works layout | 25 | 36 | 41(10.37) | 1.13 | 0.78 |
| Sub Total | 100 | 124 | 181(45.82) | 1.45 | 1.16 |
| Total | 200 | 273 | 395(100.00) | 1.44 | 1.05 |
Table text extracted from the original PDF; superscript letters are shown inline. The original table image is below.
View original table image
| Communities | Mosquitoes Species An. gambiae An. funestus Others | — | — | Total No collected | Percentage (%) |
|---|---|---|---|---|---|
| Avutu | 86(20.14) | 51(14.91) | 71(15.60) | 208 | 16.99 |
| Umuariam | 56(13.11) | 39(11.40) | 82(18.02) | 177 | 14.46 |
| Ehume | 38(8.89) | 24(7.01) | 49(10.76) | 111 | 9.06 |
| Amuzi | 49(11.47) | 57(16.66) | 53(11.64) | 159 | 12.99 |
| Sub total | 229(53.62) | 171(50.00) | 255(56.04) | 655 | 53.51 |
| Orji | 50(11.70) | 39(11.40) | 72(15.82) | 161 | 13.15 |
| Akwakuma | 61(14.28) | 72(21.05) | 41(9.01) | 174 | 14.21 |
| Amakohia | 38(8.89) | 29(8.47) | 48(10.54) | 115 | 9.39 |
| Works layout | 49(11.47) | 31(9.06) | 39(8.57) | 119 | 9.72 |
| Sub total | 198(46.37) | 171(50.00) | 200(43.95) | 569 | 46.48 |
| Total | 427(34.88) | 342(27.94) | 455(37.17) | 1,224 | 100.00 |
Table text extracted from the original PDF; superscript letters are shown inline. The original table image is below.
View original table image
Seasonal distribution and human biting rate tends to be on the increase during rainy season than dry season (66.99% vs 33.00%). This is in agreement with Efe and Ojoh (2013) [5] . Rainy season which presents favourable environmental condition that enhances mosquito breeding, survival and biting rates could explain this. Among the malaria transmitting vectors An. gambiae was the principal and predominant vector found indoor compared to other species. The endophagic and endophilic habits remains the basic prerequisite for the implication. The presence of both Anopheles gambiae and Anopheles funestus indoors suggest vector feeding and resting habits rather than environmental condition. The implication is that competent vectors are available and possibility of dwellings both urban and rural areas and being co-infected with malaria transmission all year round. These vectors co-occurrence also indicate suitable breeding sites and need to incoportae environmental management strategies as a component of the integrated vector control. Significantly, low infectivity rate of salivary glands of female anopheline were reported when compared with the study of Jande and Amuta (2015) [12] in Benue State Nigeria though their study involved only sixty two female mosquitoes. Contrary to his study which shows that the higher, the infectivity rate, the higher the chances of malaria transmission, our study is remarkable. It shows that the values for IRD, HBR, PR, SPR, EIR and annual biting rates/personal year were comparable between the seasons and among malaria vector species. Parasite prevalence is malaria-specific and can provide an adequate measure of transmission (Beier at al 1999) [3] . Revi and Nibhay (2003) [21] posited that during the development of Plasmodium in the mosquito midgut, sporozoite burst out of the oocysts into the haemocoel to locate and invade salivary glands prior to transmission. This process facilitates complete maturation of infection competent sporozoites. This is suggestive that people are prone to malarial infection since pressure of matured sporozoites in the salivary glands reveals that mosquitoes have malaria transmission potential. The absence of differences in the urban-rural entomological indices could explain prevalence in the human population and in the vectors in addition to longetivity and density of the vector population to ensure effective malarial transmission to humans during blood meal. Conclusively, human population density and man biting rates being parts of components of vectorial capacity/efficiency of malaria vectors, Anopheles gambiae and Anopheles funestus were found as the malaria transmitting vectors all factors being equal. The study areas (both urban and rural) need to be given equal treatment in intervention to malaria control and prevention.
Figures and tables from the paper
References
26 in the original paper- Amaechi AA. Studies on the insecticide treated bed nets on the control of mosquito-vectors of human lymphatic filariasis in parts of Ebonyi State, Nigeria. Owerri, Nigeria: Imo State University; 2009.
- Amaechi A, Iwunze J, Onyenakazi P, Ezike M, Nwachukwu M. Assessment of mosquito biting activities, community protection and treatment seeking behaviours in malarious communities of Mbaise and Obowo, Imo State, Nigeria. PPSN South-East Symposium Book of Proceedings. 2024;2:22-29.
- Beier K, Killen GF, Githure JI. Short report: entomological inoculation rates and Plasmodium falciparum malaria prevalence in Africa. An Trop Med Hyg. 1999;11:109-113.
- Detinova TS. Age grading method in Diptera of medical importance. Geneva: WHO Monogr Ser No. 47; 1962.
- Efe S, Ojoh C. Climate variation and malaria prevalence in Warri metropolis. Atmospheric and Climate Sciences. 2013;3:132-140.
- Egejuru NJ, Nwoke BEB, Ukaga CN, Amaechi AA. Schistosomiasis and soil-transmitted helminths in relation to anthropometric indices of school children in Owerri North L.G.A, Imo State, Nigeria. Int Sci Res J. 2016;2006-1730.
- Ezeigwe N, Inyama PU, Samdi CM, Akila JD, Awolola TS, Nwansat GS, et al. Anopheles species diversity, behavior and sporozoite rates in six states of Nigeria. Report submitted to CDC/USAID's Presidential Malaria Initiative; 2014.
- Gillies MT, De Meillon B. The Anophelinae of Africa south of the Sahara (Ethiopian zoogeographical region). Johannesburg: South African Institute for Medical Research; 1968.
- Gillies MT, Coetzee M. A supplement of the Anophelinae of Africa south of the Sahara. Johannesburg: South African Institute for Medical Research; 1987. p. 1-55.
- Ikpa GI, Mafuyai HB, Ikpa TE. Distribution and infectivity of Anopheles mosquitoes and asymptomatic malaria infection in a home setting of Gboko, Nigeria. Niger J Parasitol. 2017;38(1):98-103.
- Iwunze JI, Amaechi AA. Malaria prevalence and preventive measures among pregnant women in Obowo LGA Imo State, Nigeria. Innov J Med Sci. 2021;6(4):14.
- Jande EH, Amuta EA. Malaria preventive practices and vector infectivity studies in Benue State, Nigeria. Niger J Parasitol. 2015;36(2):101-107.
- Manyi MM, Vajimo GC, Immadeh GN. Sporozoite infection rates of female anopheline mosquitoes in Makurdi and endemic areas for malaria in Central Nigeria. Int J Entomol Res. 2014;2(2):103-115.
- Mboera LEG, Magesa SM, Molteni F. Indoors manbiting mosquitoes and their implication on malaria transmission in Mpwapwa and Iringa District, Tanzania. Tanzan Health Res Bull. 2006;8(3):141-149.
- National Federal Ministry of Health (NFMH). National Malaria Control Programme: strategic plan 2009-2013 - A roadmap for malaria control in Nigeria (abridged version). Abuja: Yalian Press Ltd; 2009.
- Okwa OO, Akinmolayan EI, Carter V, Hord H. Transmission dynamics of malaria in four selected ecological zones of Nigeria in the rainy season. Ann Afr Med. 2009;8(1):1-9.
- Owerri, Nigeria: Imo State University; 2004.
- Onyindo AE, Ezike VI, Nwosu EO, Ozumba NA, Ikpeze OO, Obiukwu MO, et al. Crepuscular manbiting mosquitoes of a zoological garden, Enugu, South Eastern Nigeria. Int J Parasit Dis. 2009;4(11):1-9.
- Oyewole IO, Ibidapo AC, Oduola AO, Obansa JB, Awolala ST. Molecular identification and population dynamics of the major malaria vectors in a rainforest zone of Nigeria. Biokemistri. 2005;17(2):171-178.
- Oyewole IO, Awolola TS, Ibidapo CA, Oduola AO, Okwa OO, Obansa JA. Behaviour and population dynamics of the major Anopheles vectors in malaria endemic areas in southern Nigeria. J Vector Borne Dis. 2007;44:56-64.
- Revi D, Nibhay K. Role of mosquito salivary glands. Curr Sci. 2003;85(9):1234-1236. (Page number inferred -please provide if known.)
- World Health Organization (WHO). Malaria on practical entomology in malaria. Part I, Ch. 1-5. Geneva: WHO Division of Malaria and Other Parasitic Diseases; 1975.
- World Health Organization (WHO). WHO technical report series 892. WHO Expert Committee on Malaria. Geneva: WHO; 2000.
- World Health Organization (WHO). Report on the twentieth WHOPES working group meeting. WHO/HTW/NTD/2009. Geneva: WHO; 2009.
- World Health Organization (WHO). World Malaria Report 2013. Geneva: WHO Global Malaria Programme; 2013.
- World Health Organization (WHO). World Malaria Report 2015. Geneva: WHO Global Malaria Programme; 2015.