
Research article · 2025 · Full text
International Journal of Geography Geology and EnvironmentMapping urban stress and green depletion in Shimla using remote sensing: A step towards sustainable urban future
Volume 7(7) · Pages 32–39 · DOI: 10.22271/27067483.2025.v7.i7a.383 ↗
Research areasRemote Sensing and Land UseEnvironmental Quality and PollutionUrban Heat Island Mitigation
Abstract
Author-writtenThe tracking of vegetation dynamics and urban growth is necessary for ecologically sound environmental planning, especially in ecologically vulnerable areas such as Himachal Pradesh. This paper provides a detailed examination of the seasonal correspondence between NDVI (normalized difference vegetation index) and NDBI (normalized difference Built-up index) from 2019 to 2024 based on Sentinel-2 imagery, chosen for its high spatial resolution and regular availability from 2019. A total of 50,000 spatially distributed but fixed points were analyzed across all districts of Himachal Pradesh. Karl Pearson's correlation coefficient was calculated season-wise by Python to reflect the relationship between NDVI and NDBI, which indicated a persistent negative correlation pattern, mainly in urbanizing areas. Time series and trend analysis were undertaken to evaluate long-term vegetation and built-up pattern changes, with a linear regression model used to project trends up to 2030. Findings show an evident seasonally related reduction in vegetation cover that parallels urban growth in major districts. Further, a heatmap of correlations was created to display spatial variation in the relationship between NDVI-NDBI, emphasizing ecological hotspots as well as zones of significant transition. This research offers policy-relevant findings for policymakers and urban planners in that it maps out regions most impacted by anthropogenic pressure and climatic variability in the Western Himalayan environment.
Summary
Source-checkedPlain-language reading of the full paper, prepared with AI and checked against the text. Each point links to the authors' own words.
Why it matters
- Himachal Pradesh is seeing rapid changes in land use due to increasing urbanization and development pressures. View evidence ↗
- The Western Himalayan region's sensitive ecosystems and biodiversity are under pressure from expanding infrastructure and built-up areas. View evidence ↗
- Changes in land cover in the Western Himalayas directly affect soil stability, climate sensitivity, and ecological balance. View evidence ↗
The question
- The study aims to evaluate land use changes by examining the seasonal and temporal correlation between vegetation (NDVI) and built-up (NDBI) indices from 2019 to 2024. View evidence ↗
What they did
- The researchers used high-resolution Sentinel-2 satellite imagery and Python tools to perform trend analysis, create heatmaps, and calculate seasonal correlations. View evidence ↗
- The analysis of the relationship between vegetation and built-up areas was conducted using 50,000 randomly selected sample points across the state. View evidence ↗
- Landsat 8 imagery from 2014 to 2024 was used to supplement Sentinel-2 data for long-term trend mapping of vegetation and built-up areas. View evidence ↗
- Vegetation health was measured using the Normalized Difference Vegetation Index (NDVI), and urban sprawl was identified using the Normalized Difference Built-up Index (NDBI). View evidence ↗
What they found
- NDBI values ranged from -0.4243 to 0.4554, reflecting a mix of natural surfaces and low-density urban development. View evidence ↗
- A moderate negative correlation (r = -0.33) was found between NDVI and NDBI, meaning that higher urban density is associated with lower vegetation cover. View evidence ↗
- The inverse relationship between urban growth and vegetation loss is statistically significant (p < 0.001). View evidence ↗
- Ecological stress is highest during the autumn season, which exhibited the strongest negative correlation between vegetation and built-up indices. View evidence ↗
- The Vegetation-Built-up Environment Index (VBEI) identified the city center and new development zones as areas of intense urban stress. View evidence ↗
What it means
- The authors conclude that the identified high-stress zones require urgent intervention through green infrastructure, vegetation reclamation, or stricter urban controls. View evidence ↗
- The study suggests that remote sensing and spatial analysis can provide critical data to help decision-makers balance urban growth with environmental resilience. View evidence ↗
Visual summary
1 visualsIllustrations explain the paper; they do not show study data.
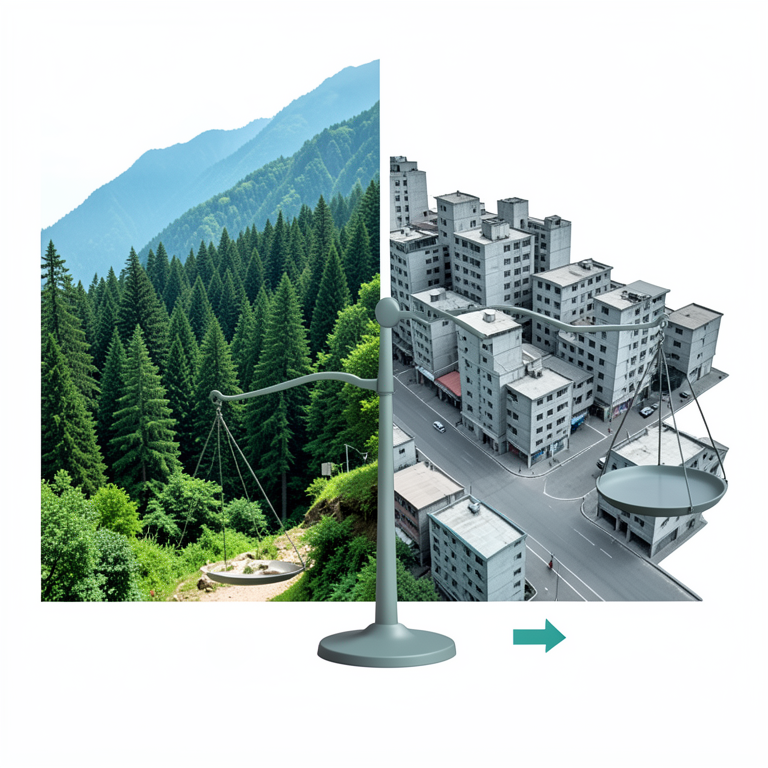
Urban Stress Concept
AI-generated conceptual illustration (The city of Shimla, India, featuring Himalayan mountain terrain, coniferous forests, and dense urban architecture). It explains the idea and does not show study data.
View source evidence ↗Figures & tables
From the original paper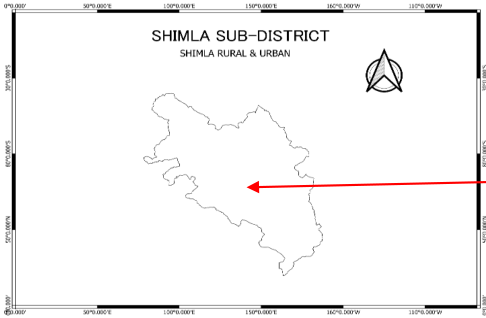 Figure 1
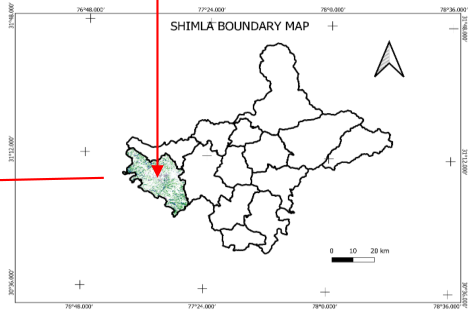 Figure 1
 Table 1
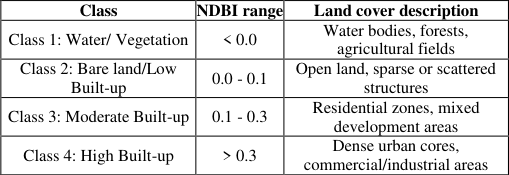 Table 2
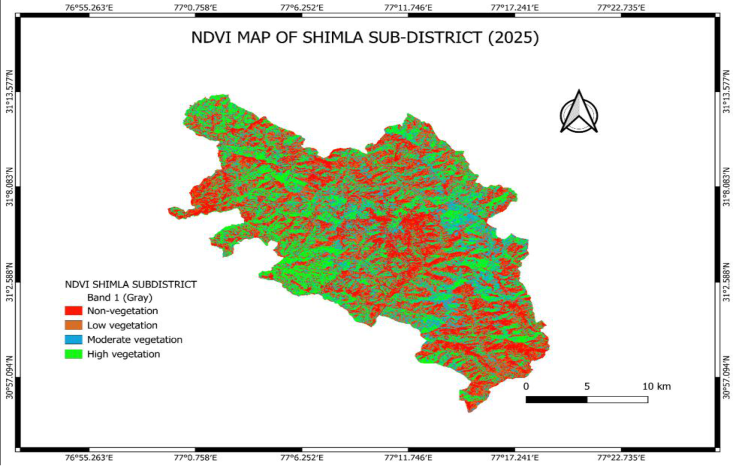 Figure 2
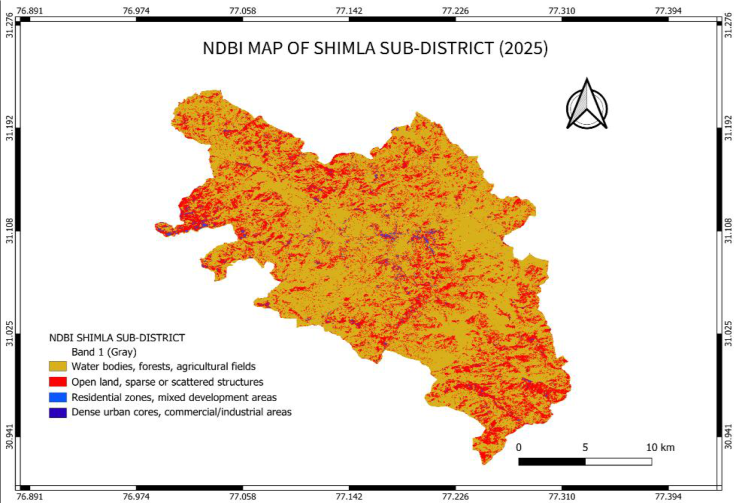 Figure 3
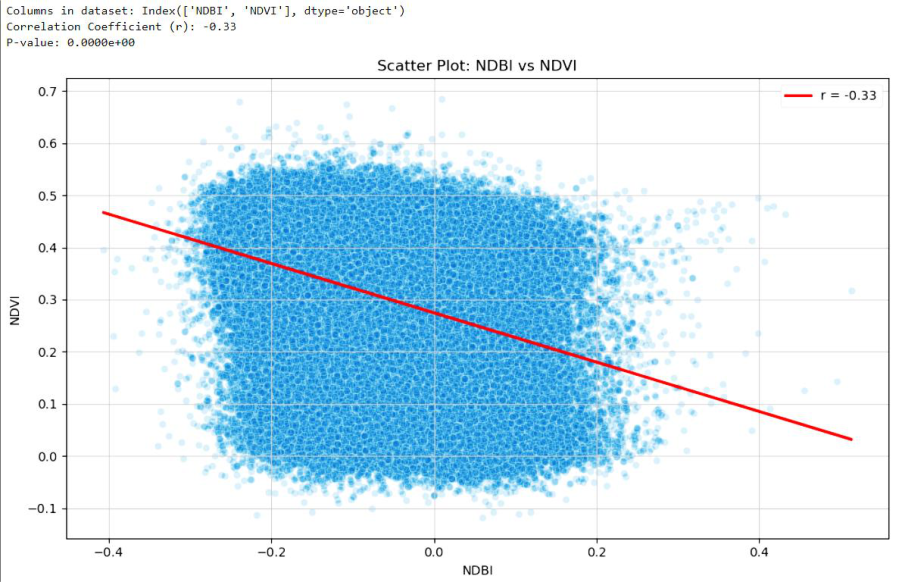 Figure 4
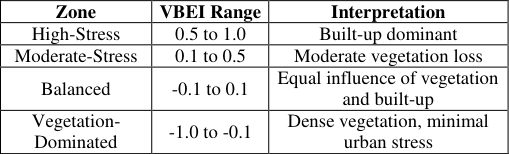 Table 3
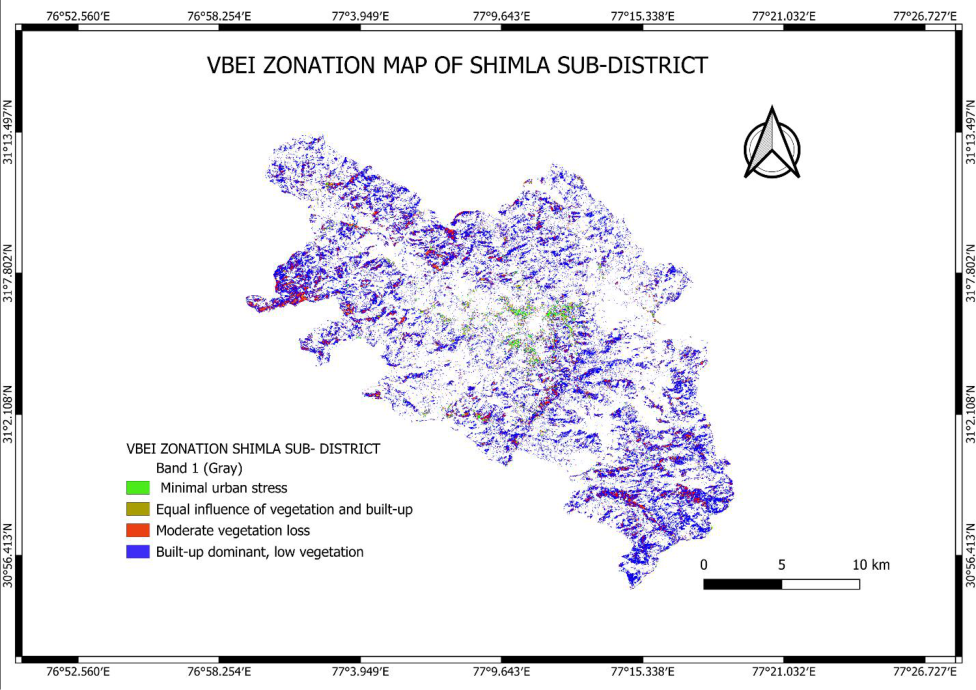 Figure 5
Introduction
Himachal Pradesh, a north Indian mountain state, is experiencing a process of accelerated land use modification as a result of intensified urbanization and developmental pressure. Historically famous for dense forest cover, high biodiversity, and sensitive ecosystems, the Western Himalayan region increasingly suffers from increased environmental pressure in the form of expanding built-up lands, infrastructure, and altered land cover. These changes have immediate implications for ecological equilibrium, soil stability, and climate sensitivity in the Western Himalayas (Mehra & Swain, 2025) [7] . To evaluate these changes, this research examined the seasonal and temporal correlation between the Normalized Difference Vegetation Index (NDVI) and the Normalized Difference Built-up Index (NDBI) for the whole state from 2019 to 2024. Utilizing high-resolution Sentinel-2 satellite imagery and Python-based analytical tools, we calculate seasonal correlations, create heatmaps, and employ time series and trend analysis to identify spatial patterns and predict land cover changes. The aim is to emphasize regions of ecological tension and urban growth in order to facilitate data-driven planning in this ecologically fragile area. The distribution of urban ecological stress in Himachal Pradesh, a rapidly urbanizing mountain state in North India, is evaluated in this study using a geospatial approach. Two commonly used remote sensing indices, NDVI (Normalized Difference Vegetation Index) and NDBI (Normalized Difference Built-up Index), were calculated seasonally using highresolution Sentinel-2 satellite imagery from 2019 to 2024 in order to assess the health of the vegetation and the growth of built-up in a variety of landscapes. Consistent, cloud-free, highresolution Sentinel-2 data became consistently available for the region only after 2019, which is reflected in the chosen time period. The study maps the shifting equilibrium between natural vegetation and impervious surfaces by comparing NDVI and NDBI trends, highlighting regions experiencing growing ecological stress as a result of urbanization. This method facilitates datadriven strategies for sustainable regional planning and allows for a thorough understanding of land surface transformation in the Western Himalayas. Since urban ecological studies have long used NDVI and NDBI as complementary indicators, they are suitable instruments for tracking the environmental effects of urbanization in hilly, sensitive areas (Ouma et al., 2021) [8] . Remote Sensing (RS) and geospatial technologies are now critical instruments in the quest for environmental sustainability and the promotion of green economy projects. They enable systematic observation, measurement, and analysis of Earth's surface characteristics over large spatial areas and long temporal durations. They offer timely, affordable, and repeatable methods of monitoring environmental change, particularly in areas of rapid urbanization and ecological changes (Grover & Kaur, 2024; Susaki et al., 2014) [2,10] . Remote sensing is a crucial tool for tracking changes in land use and cover in both urban and rural areas of Himachal Pradesh. Traditional field surveys can be difficult and resource-intensive due to the state's intricate mountainous terrain and ecological sensitivity. (Robinson et al., 2017; Vaid & Pathania, 2024) [9,11] . Among different remote sensing-based indicators, the Normalized Difference Vegetation Index (NDVI) is a powerful tool for vegetation health and density. It is chlorophyll sensitive and able to capture greenness levels over a range of land covers (Li et al., 2021) [5] . The Normalized Difference Built-up Index (NDBI) is employed for identifying built-up features and assisting in mapping the extent of urban infrastructure. These two indices combined, when examined simultaneously, provide a measure of the competing forces between natural and developed landforms (Guha et al., 2018; Zha et al., 2003) [3,14] . Aside from spatial mapping, this work also includes a correlation analysis of NDVI and NDBI to statistically assess the relationship between vegetation cover and built-up intensity in the urban landscape. This kind of analytical technique is essential for quantifying the extent to which urban growth is affecting green spaces (Cetin et al., 2024) [1] . A seasonal correlation between NDVI and NDBI was carried out throughout Himachal Pradesh using 50,000 randomly chosen sample points in order to further this analysis. A thorough analysis of the temporal and spatial patterns in urban growth and vegetation loss across different climatic zones and altitudinal gradients was made possible by this extensive dataset. Python was used for the correlation analysis and data processing, enabling statistical computation and effective handling of sizable raster datasets. In this study, a hybrid remote sensing approach was adopted to assess the spatiotemporal relationship between vegetation cover and urban expansion in Himachal Pradesh. Highresolution Sentinel-2 imagery (2019-2024) was utilized to compute seasonal correlation between the Normalized Difference Vegetation Index (NDVI) and the Normalized Difference Built-up Index (NDBI), enabling precise pattern detection and vegetation-urban stress mapping at a fine scale. However, due to the limited temporal availability of Sentinel-2 data, Landsat 8 level-2 imagery (2014-2024) was employed to derive long-term seasonal trend maps for NDVI and annual map for NDBI. The use of Landsat ensured consistent, decade-long time series analysis, while the Sentinel-based correlation analysis provided high spatial detail for recent years. This integrated approach leverages the strengths of both datasets, enhancing the overall robustness of the spatiotemporal analysis. An increasing inverse relationship between vegetation cover and built-up expansion throughout Himachal Pradesh was indicated by the analysis, which showed a steadily growing negative correlation between NDVI and NDBI between 2019 and 2024. This pattern demonstrates how, over time, natural vegetation is gradually being replaced by urban development. Significant temporal variations were found when the seasonal analysis was broken down into three categories: spring (March-May), summer (June-August), and autumn (September-November). The autumn season showed the strongest negative correlation, indicating that this time of year is the most ecologically stressed probably as a result of cumulative seasonal vegetation loss, dry weather, and continuous urbanization. The correlations between spring and summer were relatively moderately negative, with spring representing a partial recovery of vegetation following winter and summer representing a brief period of greenery. These findings are further supported and visually validated by NDVI and NDBI trend maps generated from Landsat 8 imagery (2014-2024), which clearly depict areas of long-term vegetation decline coinciding with urban expansion zones (Jaswal & Thakur, 2023) [4] . Finally, the research produces spatially explicit, evidencebased insights to guide various aspects of sustainable urban development. These involve the selection of degraded or high-stress areas for focusing urban greening, planning green infrastructure strategies that incorporate natural elements into urban form, and facilitating nature-based solutions that correspond to larger climate resilience agendas. By connecting satellite-derived indicators to localscale planning requirements, this study adds to the principles of a green economy supporting ecologically friendly, resource-efficient, and socially inclusive urban development.
Methodology 2.1 Study area
Himachal Pradesh is a mountainous state in northern India's western Himalayas that covers an area of about 55,673 km² and lies between latitudes 30°22′N and 33°12′N and longitudes 75°45′E and 79°04′E. From low Shivalik foothills (~350 m) to high-altitude regions above 7,000 m, the region's complicated topography results in a variety of climatic zones and vegetation types. Demographically, Himachal Pradesh has a population of approximately 6.8 million (Census 2011, projected to be over 7.9 million by 2024), with a rural majority and a growing urban footprint concentrated in hill towns and valley settlements The state's physiography is divided into four primary zones: the outer Himalayas (Shivaliks), the lesser Himalayas, the greater Himalayas, and the Trans-Himalayan zone, each influencing the region's microclimates, vegetation types, and land use patterns. As per Forest Survey of India Report 2021, Himachal Pradesh has 15,443 sq km (27.73%) of its area under forest cover. Because of its diverse topography and climate, the Himachal Pradesh's forests are home to a wide range of flora and fauna, making them rich in biodiversity. Chil, Deodar, Kail, Fir, Spruce, Oak, Khairi, Sal, Bamboo, and other broad-leaved species are found in these forests. These forests are categorized into tropical, sub-tropical, temperate, and alpine types, supporting rich biodiversity and playing a key role in carbon sequestration and watershed regulation (Forest Survey of India, 2023).
Preprocessing of image
To guarantee high radiometric and geometric consistency across all temporal datasets, Sentinel-2 Level-2A imagery (2019-2024) and Landsat 8 level-2 data (2014-2024) were used for this study. For spring (March-May), summer (June-August), and autumn (September-November), cloud-free imagery was chosen seasonally, excluding monsoon months because of high cloud cover and erratic reflectance levels. The first step in preprocessing was atmospheric correction, which was already used in Level-2A Sentinel and Landsat Surface Reflectance products. Next, clouds and shadows were masked using the pixel quality (QA_PIXEL) band for Landsat 8 and the QA60 band for Sentinel-2. To guarantee spatial consistency, all images were cropped to the Himachal Pradesh border using a high-resolution administrative shapefile. To lessen the effect of outliers and transient anomalies, seasonal image composites were created using median pixel values. The preprocessed datasets that were produced offered a reliable and consistent foundation for additional correlation analysis and trend identification over the chosen time frame.
Extracting
where: NDVI = Normalized Difference Vegetation Index NIR = Near Infrared Band Red = Red Band Healthy vegetation scatters more near-infrared and less red light, generating higher NDVI values. To maintain consistency in all indices (NDVI and NDBI) was kept in the full range from -1 to +1. This consistent scaling enabled precise comparison and visualization, picking up subtle differences in vegetation even in mixed or transitional land cover areas.
Extracting NDBI value
NDBI (Normalized Difference Built-up Index) was employed to identify built-up areas in the Himachal Pradesh. It operates by comparing reflectance between shortwave infrared (SWIR) and near-infrared (NIR) bands. Built-up surfaces tend to reflect more SWIR and less NIR, thus making the index efficient to identify urban sprawl.
where: NDBI = Normalized Difference Built-up Index SWIR = Shortwave Infrared NIR = Near Infrared Band NDBI was computed using the formula given above, utilizing Sentinel-2 Bands 11 (SWIR) and 8 (NIR) for 2019-2024, and Landsat 8 Bands 6 and 5 for 2014-2024. Seasonal composites were prepared for spring, summer, and autumn after cloud and shadow masking. NDBI values were extracted for the same 50,000 fixed random points to analyze urban expansion and correlate with NDVI values.
Correlation analysis
Sentinel satellite imagery was used in QGIS to analyze the relationship between vegetation cover and urban development in Shimla sub-district. NDVI and NDBI rasters were first generated using the raster calculator. These rasters were then converted into point layers so that each pixel had a corresponding geographic point with its NDVI or NDBI value as an attribute. Using Python, the NDVI and NDBI values were merged into a single point layer using geospatial libraries such as geopandas and pandas. This created an attribute table containing paired NDVI and NDBI values for each pixel. The statistical relationship between the values was then analyzed by calculating Pearson's correlation coefficient using Python's scipy.stats.pearsonr function. Pearson's correlation coefficient (r) measures the strength and direction of the linear relationship between two variables. It is calculated using the formula: r
Where X and Y are the variables (NDVI and NDBI), and 𝑋̄ and 𝑌̄ are their respective means. The result ranges from -1 to +1. A negative value indicates an inverse relationship meaning, as NDBI increases, NDVI decreases. This suggests that urban expansion is linked to vegetation loss. The method offered a clear, pixel-wise understanding of urban stress on green areas.
Extracting VBEI value and zonation mapping
where: NDBI = Normalized Difference Built-up Index NDVI = Normalized Difference Vegetation Index
Results and Discussion
Results and Discussion
Results of vegetation index
This study analyzed NDVI values and helped in reclassification of study area into four-classes as shown in Table 1. Statescu, 2017) [6] .
| Class | NDVI range | Land cover description |
|---|---|---|
| Class 1: Non-vegetation | < 0.2 | Water, roads, built-up areas |
| Class 2: Low vegetation | 0.2 - 0.4 | Grasslands, dry fields |
| Class 3: Moderate vegetation | 0.4 - 0.5 | Cropland, plantations |
| Class 4: High vegetation | > 0.5 | Dense forest, lush green cover |
Table text extracted from the original PDF; superscript letters are shown inline. The original table image is below.
View original table image
Results of buildup index
The study area's built-up intensity was evaluated with the aid of NDBI analysis. The values of this index which varied from -0.4243 to maximum 0.4554 showed a combination of low-density development and natural surfaces. This study analyzed NDBI values and helped in reclassification of study area into four-classes as shown in Table 2. The results of this index area also showing dominance of natural land cover and sparse settlements as shown in Figure 3. Similar results were reported by (Zha et al., 2003) [14] , who introduced NDBI to effectively distinguish built-up areas from other land covers using satellite imagery. Several recent studies, like (Xu, 2007) [13] and (Weng, 2012) [12] have confirmed that NDBI performs well in identifying urban footprints, especially when combined with NDVI for improved accuracy. Overall, the study area's vegetation cover and built-up intensity can be clearly understood from the NDVI and NDBI results. A comparatively unaltered landscape is highlighted by the predominance of natural land and minimal development. Future planning, land management, and environmental monitoring initiatives can benefit from these findings.
| Class | NDBI range | Land cover description |
|---|---|---|
| Class 1: Water/ Vegetation | < 0.0 | Water bodies, forests, agricultural fields |
| Class 2: Bare land/Low Built-up | 0.0 - 0.1 | Open land, sparse or scattered structures |
| Class 3: Moderate Built-up | 0.1 - 0.3 | Residential zones, mixed development areas |
| Class 4: High Built-up | > 0.3 | Dense urban cores, commercial/industrial areas |
Table text extracted from the original PDF; superscript letters are shown inline. The original table image is below.
View original table image
Table 2: Classification of buildup depending upon NDBI range
Table 2: Classification of buildup depending upon NDBI range
Correlation between NDVI and NDBI
To investigate the interaction between urbanization and vegetation cover in study area, a statistical correlation analysis was carried out between the Normalized Difference Vegetation Index (NDVI) and the Normalized Difference Built-up Index (NDBI). Pixel-wise values (approximately 170,000 records) were processed using Python in the Anaconda environment. Core libraries such as pandas were used for data management, scipy.stats for statistical analysis, and seaborn and matplotlib for data visualization.
The Pearson correlation coefficient was calculated to assess the strength and direction of the linear relationship between NDVI and NDBI. The result revealed a negative correlation of r = -0.33 was obtained, indicating a moderate inverse relationship i.e. areas with higher built-up density tend to have lower vegetation cover, although the relationship is not very strong. The p-value of 0.0000 (or more precisely, p<0.001) further supports the statistical significance of this correlation, suggesting that the observed relationship is highly unlikely to have occurred by random chance. A scatter plot with a fitted regression line was created to visually depict this trend. The observed negative correlation, though moderate, still suggests that urban expansion has a noticeable impact on vegetation loss and highlights the importance of integrating ecological indicators into urban planning strategies. Scatter Plot of NDBI vs NDVI for assessing the relationship between urbanization and vegetation cover in study area is shown below in Figure 4. To interpret these results meaningfully on the basis of VBEI values, the area under study was reclassified depending upon stress zones into four categories as given in Table 3: In raster processing, there were pixels that gave null or undefined values as a result of division by zero (when NDVI + NDBI = 0) were masked to avoid distortion in the analysis. The final zonation map according to VBEI classification distinctly revealed high-stress areas under urban pressure and low-stress areas with healthy vegetation. This assisted in confirming the results from NDVI and NDBI analysis and enhanced the understanding of vegetation loss patterns due to rapid urbanization in the area.
Conclusions
The current study evaluated vegetation health, intensity of built-up, and patterns of ecological stress in the study area using Sentinel-2 imagery and remote sensing indices, namely NDVI, NDBI, and VBEI. By synergizing geospatial analysis and correlation statistics, this study examined the ways in which uncontrolled urban growth is restructuring the natural terrain of this environmentally sensitive hill city.
The NDVI image evidently demonstrated a patchy vegetation pattern. Highly vegetated regions were generally confined to forest cover and slope areas, while the urban centers and developing construction belts had very low NDVI values. On the other hand, NDBI revealed developing built-up hotspots in the central part of city as well as outer developing areas. Combined, these indices revealed an increasing disparity between natural green cover and hard urban infrastructure.
A negative correlation (-0.33) between NDBI and NDVI, with a significant p-value of 0.000, provides strong evidences of the adverse effects of urbanization on vegetation cover in Shimla. A negative correlation between NDVI and NDBI reaffirmed the reversal relationship i.e. more urbanization results in loss of vegetation and hence poses a great challenge for sustainable development. This correlation was not more than just a figure; it supported the spatial patterns that this study mapped, which further assisted in validating the accuracy of our interpretation. These results create a good case for integrated planning, taking into account both ecological sustainability and land use pressure. VBEI, an aggregate index formed by combining NDVI and NDBI, provided some additional information which enable us to categorize the study area into different stress zones. Urban zones of high ecological stress were marked by high values of VBEI which were identified within the center of study area and spreading outskirts. Conversely, forested and vegetation spots registered negative VBEI values, which represent a healthier state of the environment. Further managing null values in VBEI computation arising from zero denominators guaranteed that the data was reliable and hence prevented misleading results.
Overall, this study provides a straightforward but effective geospatial approach to assess ecological stress in rapidly urbanizing study area. The application of zonation and statistical verification enabled us to identify those places that require urgent intervention be it through vegetation reclamation, green infrastructure, or more stringent urban controls. The methodology adopted here is extensible, replicable, and translatable to other comparable landscapes. As Shimla develops, the problem is not merely to control development but to maintain the natural systems that sustain it. This study demonstrates how spatial information, remote sensing technology, and intelligent analysis may inform decision makers about the balance of urban expansion and environmental resilience.
Figures and tables from the paper
References
15 in the original paper- Cetin M, Ozenen Kavlak M, Senyel Kurkcuoglu MA, Bilge Ozturk G, Cabuk SN, Cabuk A et al. Determination of land surface temperature and urban heat island effects with remote sensing capabilities: The case of Kayseri, Türkiye. Nat Hazards. 2024;120(6):5509-5536. https://doi.org/10.1007/s11069-024-06431-5
- Grover H, Kaur A. Dynamics of urbanization in Dharamshala city of Himachal Pradesh, India: A case study. Int J Geogr Geol Environ. 2024;6(1):93-100. https://doi.org/10.22271/27067483.2024.v6.i1b.206
- Guha S, Govil H, Dey A, Gill N. Analytical study of land surface temperature with NDVI and NDBI using Landsat 8 OLI and TIRS data in Florence and Naples city, Italy. Eur J Remote Sens. 2018;51(1):667-678. https://doi.org/10.1080/22797254.2018.1474494
- Jaswal, Thakur. Correlation between LST, NDVI and NDBI with reference to Urban Sprawling -A Case Study of Shimla city. Int J Multidiscip Res. 2023;5(6):10258. https://doi.org/10.36948/ijfmr.2023.v05i06.10258
- Li S, Xu L, Jing Y, Yin H, Li X, Guan X et al. Highquality vegetation index product generation: A review of NDVI time series reconstruction techniques. Int J Appl Earth Obs Geoinf. 2021;105:102640. https://doi.org/10.1016/j.jag.2021.102640
- Macarof P, Statescu F. Comparasion of NDBI and NDVI as indicators of surface urban heat island effect in Landsat 8 imagery: A case study of Iasi. Present Environ Sustain Dev. 2017;11(2):141-150. https://doi.org/10.1515/pesd-2017-0032
- Mehra N, Swain JB. GIS and remote sensing based analysis for monitoring urban growth dynamics in Western Himalayan city of Dharamshala, India. Urban Lifeline. 2025;3(1):4. https://doi.org/10.1007/s44285024-00033-0
- Ouma YO, Tjitemisa T, Segobye M, Moreri K, Nkwae B, Maphale L, et al. Urban land surface temperature variations with LULC, NDVI and NDBI in semi-arid urban environments: Case study of Gaborone City, Botswana (1989-2019). In: Chrysoulakis N, Erbertseder T, Zhang Y, editors. Remote Sensing Technologies and Applications in Urban Environments VI. SPIE; c2021, p. 6. https://doi.org/10.1117/12.2595031
- Robinson N, Allred B, Jones M, Moreno A, Kimball J, Naugle D, et al. A dynamic Landsat derived Normalized Difference Vegetation Index (NDVI) product for the conterminous United States. Remote Sens. 2017;9(8):863. https://doi.org/10.3390/rs9080863
- Susaki J, Kajimoto M, Kishimoto M. Urban density mapping of global megacities from polarimetric SAR images. Remote Sens Environ. 2014;155:334-348. https://doi.org/10.1016/j.rse.2014.09.006
- Vaid T, Pathania SS. Land use-land cover changes and associated drivers: A case of Salooni Block of Chamba. Curr World Environ. 2024;19(1):491-504. https://doi.org/10.12944/CWE.19.1.40
- Weng Q. Remote sensing of impervious surfaces in the urban areas: Requirements, methods, and trends. Remote Sens Environ. 2012;117:34-49. https://doi.org/10.1016/j.rse.2011.02.030
- Xu H. Extraction of urban built-up land features from Landsat imagery using a thematic-oriented index combination technique. Photogramm Eng Remote Sens. 2007;73(12):1381-1391. https://doi.org/10.14358/PERS.73.12.1381
- Zha Y, Gao J, Ni S. Use of normalized difference builtup index in automatically mapping urban areas from TM imagery. Int J Remote Sens. 2003;24(3):583-594. https://doi.org/10.1080/01431160304987
- Zhou L, Zhou W, Chen J, Xu X, Wang Y, Zhuang J, et al. Land surface phenology detections from multisource remote sensing indices capturing canopy photosynthesis phenology across major land cover types in the Northern Hemisphere. Ecol Indic. 2022;135:108579. https://doi.org/10.1016/j.ecolind.2022.108579
Cited by 1
From OpenAlex, OpenCitations and reference lists read by Scinovex
- Impact of horticulture on changing land use/land cover and forest depletion in Rohru Block, Shimla District of Himachal Pradesh, India ↗
Ajay Chanjta, D. K. Sharma, Janhavi U. Thakur, Kumari Sapna · Discover Forests · 2026
The Indian state of Himachal Pradesh is a mountainous region that can take pride in its rich forest resources and scenic environment. But human and environment interactions have taken an exploitative turn in recent times. This study deals with one such aspect of environmental concern due to horticulture expansion especially apple cultivation. It has led to drastic Land use land…
❝ 0PDF