
Research article · 2025 · Full text
International Journal of Agriculture and Food ScienceConsumer perception towards brands of sunflower oil in Buldhana District
Volume 7(7) · Pages 629–631 · DOI: 10.33545/2664844x.2025.v7.i7i.574 ↗
Research areasAgricultural Economics and Practices
Abstract
Author-writtenThis study investigates consumer perception and purchasing behavior for sunflower oil brands in Buldhana district, Maharashtra. A structured survey of 60 consumers and multiple retailers was conducted to assess preferences, market share, satisfaction levels, and brand-switching tendencies. Results indicate that quality 53.33% and health benefits 33.33% are the primary determinants of brand preference. Gemini and Fortune emerged as the preferred brands, while Vinayaka held the largest retail market share 50.97%. Most consumers purchase 5-liter packs 73.33% and spend ₹5,000–₹10,000 annually on sunflower oil. Promotional offers 96.67%and product availability are major factors influencing purchase decisions, while 58.33% of consumers are willing to pay a premium for fortified oils. Regression analysis showed that frequency of purchase and monthly consumption significantly influence brand selection. The study concludes that improved packaging, better promotional offers, and increased availability are critical for enhancing brand loyalty.
Summary
Source-checkedPlain-language reading of the full paper, prepared with AI and checked against the text. Each point links to the authors' own words.
Why it matters
- Sunflower oil is widely used in India due to its nutritional profile, light texture, and neutral taste. View evidence ↗
- Increased awareness of cardiovascular disease and high cholesterol has led consumers to switch from heavier oils to heart-healthy options. View evidence ↗
- Since edible oil is a high-frequency household purchase, small changes in consumer preference can significantly impact distribution strategies and market share. View evidence ↗
The question
- The study aims to investigate the purchasing behavior and consumer perceptions of sunflower oil brands in the Buldhana district of Maharashtra. View evidence ↗
What they did
- The researchers used a structured survey involving 60 consumers and several retailers to evaluate brand preferences, satisfaction, and market share. View evidence ↗
- The sample consisted of 60 purposively selected household consumers in Buldhana District who were the primary decision-makers for oil purchases. View evidence ↗
- Multiple linear regression was employed to determine which factors, such as price, packaging, and purchase frequency, significantly influenced brand decisions. View evidence ↗
What they found
- Quality (53.33%) and health benefits (33.33%) were identified as the main factors determining brand preference. View evidence ↗
- Vinayaka is the dominant brand in the retail market, holding 50.97% of the quantity share (23,520 liters) and 51% of the sales value share. View evidence ↗
- The majority of consumers (73.33%) prefer 5-liter packs and have an annual expenditure of ₹5,000–₹10,000 on sunflower oil. View evidence ↗
- Consumer satisfaction was lowest regarding discounts and offers, with 40 consumers reporting dissatisfaction compared to 19 who were satisfied. View evidence ↗
- Promotional offers (96.67%) and availability strongly influence purchases, and 58.33% of consumers are open to paying more for fortified oils. View evidence ↗
- Regression analysis revealed that monthly consumption (coefficient 5.57) and frequency of purchase (coefficient 4.58) have the most significant positive impact on consumer satisfaction. View evidence ↗
What it means
- The authors conclude that brand loyalty can be improved through better promotional offers, increased availability, and improved packaging. View evidence ↗
- The authors recommend a dual-tier marketing strategy consisting of a premium fortified line and a value-driven promotional line. View evidence ↗
Visual summary
3 visualsIllustrations explain the paper; charts are replotted from the paper's own table values.
Dual-Tier Marketing Strategy
AI-generated conceptual illustration (bottles of sunflower oil). It explains the idea and does not show study data.
View source evidence ↗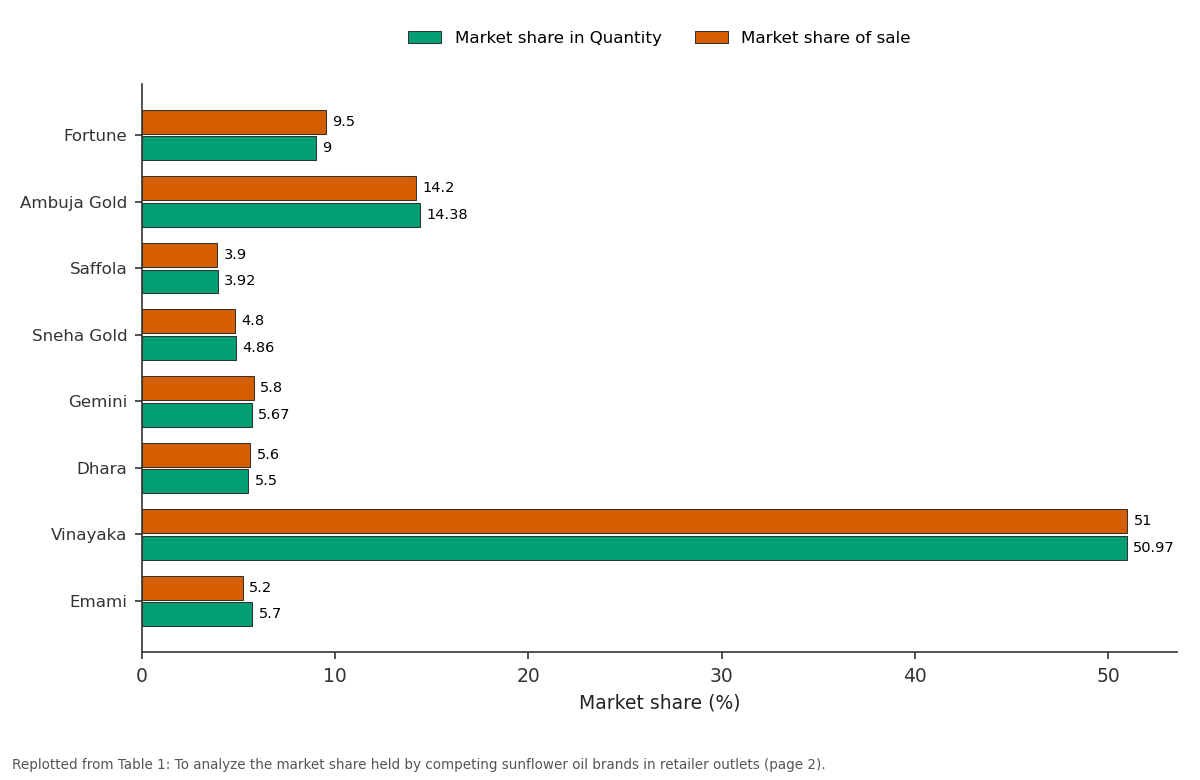
Market share in Quantity and Market share of sale: Fortune vs Ambuja Gold vs Saffola vs Sneha Gold vs Gemini
Replotted from Table 1 (page 2) of the original paper. Every bar is the paper's own table value.
View source evidence ↗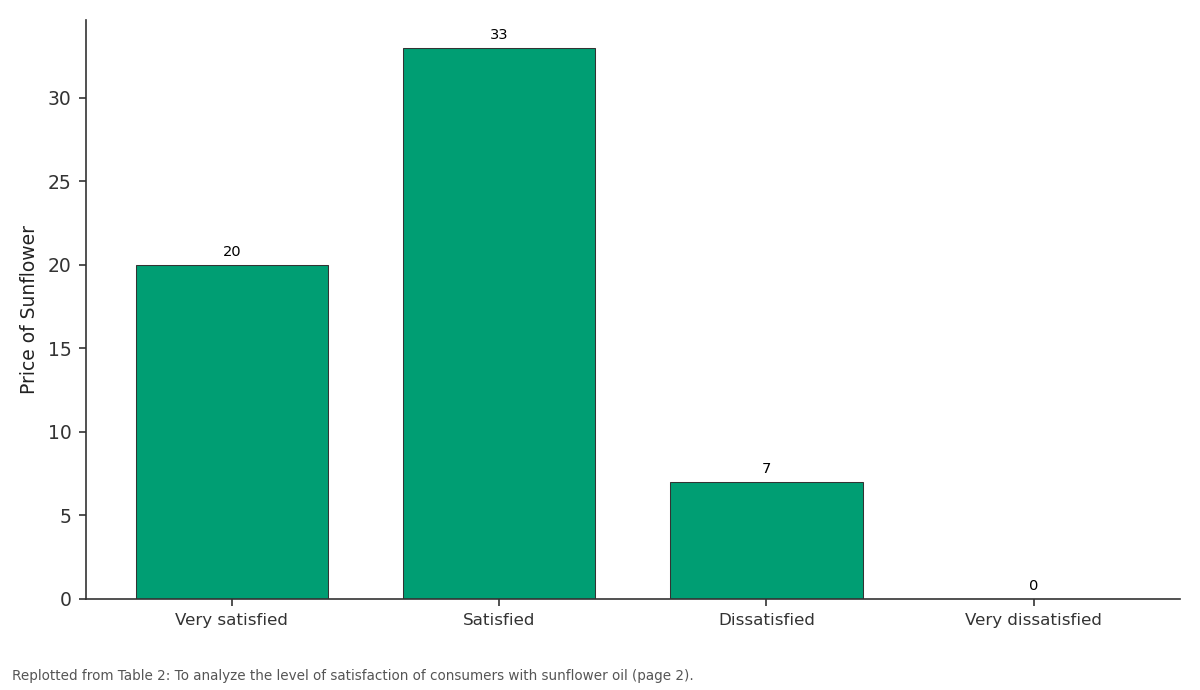
Price of Sunflower: Very satisfied vs Satisfied vs Dissatisfied vs Very dissatisfied
Replotted from Table 2 (page 2) of the original paper. Every bar is the paper's own table value.
View source evidence ↗Figures & tables
From the original paper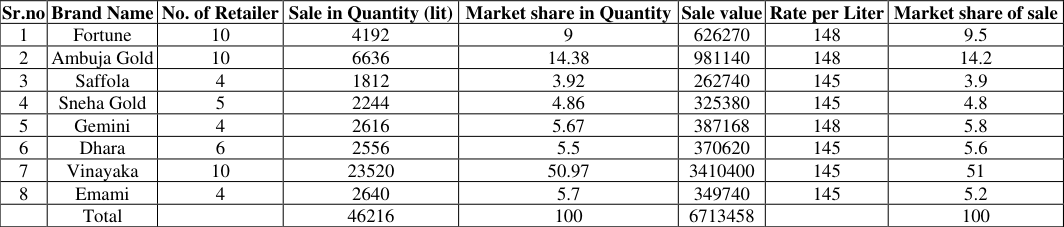 Table 1
 Table 2
 Table 3
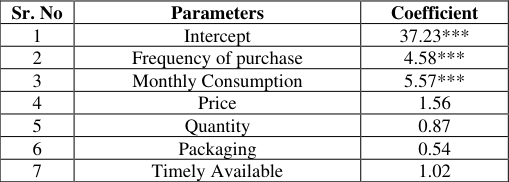 Table 4
Results
indicate that quality 53.33% and health benefits 33.33% are the primary determinants of brand preference. Gemini and Fortune emerged as the preferred brands, while Vinayaka held the largest retail market share 50.97%. Most consumers purchase 5-liter packs 73.33% and spend ₹5,000–₹10,000 annually on sunflower oil. Promotional offers 96.67%and product availability are major factors influencing purchase decisions, while 58.33% of consumers are willing to pay a premium for fortified oils.
Regression analysis showed that frequency of purchase and monthly consumption significantly influence brand selection. The study concludes that improved packaging, better promotional offers, and increased availability are critical for enhancing brand loyalty. Keywords: Consumer perception, Brand loyalty, Market share, Satisfaction level
Introduction
Sunflower oil has become one of India’s most widely used cooking oils, valued for its neutral taste, light texture, and favorable nutritional profile. Growing public awareness of diet related health risks including cardiovascular disease and high cholesterol has encouraged households to shift from traditional, heavier oils toward options positioned as ‘heart-healthy. Sunflower oil, being low in saturated fat and a good source In Buldhana District of Maharashtra where rural and semi urban consumption patterns intersect households face an expanding choice set: national brands e.g., Fortune, Saffola), strong regional players e.g., Gemini, Vinayaka, and emerging local or value brands e.g., Health Fit, Sneha Gold, Ambuja Gold. Brand selection in such routine, low involvement categories is typically shaped by a mix of perceived quality, health claims, price, availability, packaging convenience, and recommendations from family or retailers.
Because edible oil is a high penetration, high frequency household product, even marginal shifts in consumer preference can affect brand market share and distribution strategy. This condensed paper summarizes a field study designed to understand how consumers in Buldhana perceive, evaluate, and purchase competing sunflower oil brands and what that means for marketers and policy. Objectives of study 1. 1.Assess the market share of different sunflower oil brands in retail outlets. 2. Analyze the level of consumer satisfaction with sunflower oil. 3.
Identify the factors influencing brand selection and switching.
Methodology
A structured questionnaire was administered to a purposive sample of 60 household consumers across Buldhana District. Respondents were primary household decision makers for edible oil purchases. Complementary interviews with retailers were conducted to estimate comparative brand movement market share in quantity and value. NAAS Rating (2025): 4.97 IJAFS 2025; 7(7): 629-631 HS Sawale Master of Business Administration in Agri- Business Management, School of Agri-business Management, Nagpur, Maharashtra, India SV Warade Associate Professor (CAS), School of Agri-Business Management, Nagpur, Maharashtra, India PR Kadu Director, School of Agri- business Management, Nagpur and Associate Dean, College of Agriculture, Nagpur, Maharashtra, India NV Shende Head Department of Agricultural Economics & Statistics, Dr.
PDKV, Akola, Maharashtra, India HS Sawale Master of Business Administration in Agri- Business Management, School of Agri-business Management, Nagpur, Maharashtra, India https://www.agriculturaljournals.com Data Collected Socio demographic profile; preferred brand; purchase channel; monthly and annual consumption; spending; pack size; awareness of nutritional labels; willingness to pay for fortification; influence of price offers; and history of brand switching. Analytical Tools • Descriptive & Tabular Analysis to summarize demographic and behavioral patterns. • Market Share Estimation share of each brand’s sales in total observed retailer sales. • Satisfaction Profiling ratings across attributes such as quality, price, packet size, and availability. • Multiple Linear Regression – to test which factors (Frequency of purchase, monthly consumption, price, quantity, packaging, timely availability) significantly affect consumer brand decision. Data collection was completed in 2024; results reflect market conditions at that time.
Results And Discussion
The results of the present paper are presented as below. The
Results
are arranged as per the objectives achieved Table 1: To analyze the market share held by competing sunflower oil brands in retailer outlets Sr.no Brand Name No. of Retailer Sale in Quantity (lit) Market share in Quantity Sale value Rate per Liter Market share of sale 1 Fortune 10 4192 9 626270 148 9.5 2 Ambuja Gold 10 6636 14.38 981140 148 14.2 3 Saffola 4 1812 3.92 262740 145 3.9 4 Sneha Gold 5 2244 4.86 325380 145 4.8 5 Gemini 4 2616 5.67 387168 148 5.8 6 Dhara 6 2556 5.5 370620 145 5.6 7 Vinayaka 10 23520 50.97 3410400 145 51 8 Emami 4 2640 5.7 349740 145 5.2 Total 46216 100 6713458 100 The table presents a comparative analysis of market share for various sunflower oil brands across retail outlets. Among the eight brands surveyed, Vinayaka dominates with the highest market share both in terms of quantity sold 50.97%and sales value 51%, selling 23,520 liters across 10 retailers. Ambuja Gold follows with a 14.38% share in quantity and 14.2% in sales value, while Fortune holds a 9% share in quantity and 9.5% in value. Other brands like Emami, Gemini, Dhara, Sneha Gold, and Saffola have comparatively lower shares, each contributing between 3.9% to 5.8% of the total market.
| Sr.no | Brand Name | No. of Retailer | Sale in Quantity (lit) | Market share in Quantity | Sale value | Rate per Liter | Market share of sale |
|---|---|---|---|---|---|---|---|
| 1 | Fortune | 10 | 4192 | 9 | 626270 | 148 | 9.5 |
| 2 | Ambuja Gold | 10 | 6636 | 14.38 | 981140 | 148 | 14.2 |
| 3 | Saffola | 4 | 1812 | 3.92 | 262740 | 145 | 3.9 |
| 4 | Sneha Gold | 5 | 2244 | 4.86 | 325380 | 145 | 4.8 |
| 5 | Gemini | 4 | 2616 | 5.67 | 387168 | 148 | 5.8 |
| 6 | Dhara | 6 | 2556 | 5.5 | 370620 | 145 | 5.6 |
| 7 | Vinayaka | 10 | 23520 | 50.97 | 3410400 | 145 | 51 |
| 8 | Emami | 4 | 2640 | 5.7 | 349740 | 145 | 5.2 |
| Total | 46216 | 100 | 6713458 | 100 |
Table text extracted from the original PDF; superscript letters are shown inline. The original table image is below.
View original table image
Overall, the total quantity sold amounts to 46,216 liters, with total sales value reaching ₹67,13,458, clearly highlighting Vinayaka's significant dominance in the sunflower oil market among retailers. Table 2: To analyze the level of satisfaction of consumers with sunflower oil However, taste and cooking saw mixed responses, with a notable number 17 being dissatisfied. The aspect with the lowest satisfaction was discounts and offers, where 40 consumers were dissatisfied and only 19 were satisfied, indicating a major area of concern. Overall, while core product attributes like quality and health benefits are well- received, promotional aspects need improvement.
| Sr. No | Level of Satisfaction | Very satisfied | Satisfied | Dissatisfied | Very dissatisfied |
|---|---|---|---|---|---|
| 1 | Price of Sunflower | 20 | 33 | 7 | 0 |
| 2 | Availability in the market | 17 | 35 | 8 | 0 |
| 3 | Quality of the oil | 22 | 35 | 3 | 0 |
| 4 | Taste and cooking | 5 | 38 | 17 | 0 |
| 5 | Health benefit | 23 | 31 | 6 | 0 |
| 6 | Discount &offers | 0 | 19 | 40 | 1 |
Table text extracted from the original PDF; superscript letters are shown inline. The original table image is below.
View original table image
Sr. No Level of Satisfaction Very satisfied Satisfied Dissatisfied Very dissatisfied 1 Price of Sunflower 20 33 7 0 2 Availability in the market 17 35 8 0 3 Quality of the oil 22 35 3 0 4 Taste and cooking 5 38 17 0 5 Health benefit 23 31 6 0 6 Discount &offers 0 19 40 1 The table analyses consumer satisfaction across six key aspects of sunflower oil: price, availability, quality, taste, health benefits, and discounts/offers. Most consumers expressed high satisfaction with the quality 22 very satisfied, 35 satisfied and health benefits 23 very satisfied, 31 satisfied of sunflower oil. Price and availability also received largely positive feedback, with a majority of respondents indicating satisfaction or high satisfaction.
Table 3: Analyzing the factors influencing consumer decision for selection of brands Sr. No Factor Influencing Very Satisfied Satisfied Dissatisfied 1 Frequency of purchase 50 10 0 2 Monthly Consumption 32 23 5 3 Price 11 46 3 4 Quantity 32 25 3 5 Packaging 15 42 3 6 Timely Available 30 30 0 The table highlights the key factors influencing consumer decisions when selecting sunflower oil brands. Frequency of purchase emerged as the most positively rated factor, with 50 consumers very satisfied, indicating consistent buying behavior. Timely availability, quantity, and monthly consumption also scored well, with high levels of https://www.agriculturaljournals.com 4.
| Sr. No | Factor Influencing | Very Satisfied | Satisfied | Dissatisfied |
|---|---|---|---|---|
| 1 | Frequency of purchase | 50 | 10 | 0 |
| 2 | Monthly Consumption | 32 | 23 | 5 |
| 3 | Price | 11 | 46 | 3 |
| 4 | Quantity | 32 | 25 | 3 |
| 5 | Packaging | 15 | 42 | 3 |
| 6 | Timely Available | 30 | 30 | 0 |
Table text extracted from the original PDF; superscript letters are shown inline. The original table image is below.
View original table image
Gupta S, Verma P. Health consciousness and edible oil purchase behavior. Contemp Issues Bus Gov. 2020;26(1). 5. Parasuraman A, Zeithaml VA, Berry LL.
SERVQUAL: A multiple-item scale for measuring consumer perceptions of service quality. J Retailing. 1988;64(1):12–40. satisfaction and minimal dissatisfaction. Price remains a critical factor, with 46 consumers satisfied and only a few dissatisfied, showing its importance in brand selection. Packaging also plays a notable role, with a majority expressing satisfaction.
Overall, the data indicates that regular availability, appropriate quantity, and reasonable pricing are the most influential factors in consumer brand choice, with very low dissatisfaction across all areas. Table 4: Regression Coefficients & Standard error Sr. No Parameters Coefficient 1 Intercept 37.23*** 2 Frequency of purchase 4.58*** 3 Monthly Consumption 5.57*** 4 Price 1.56 5 Quantity 0.87 6 Packaging 0.54 7 Timely Available 1.02 The table presents the regression analysis results, showing the coefficients for various factors influencing consumer satisfaction with sunflower oil. The intercept value is 37.23*, indicating the baseline level of satisfaction when all variables are zero.
| Sr. No | Parameters | Coefficient |
|---|---|---|
| 1 | Intercept | 37.23*** |
| 2 | Frequency of purchase | 4.58*** |
| 3 | Monthly Consumption | 5.57*** |
| 4 | Price | 1.56 |
| 5 | Quantity | 0.87 |
| 6 | Packaging | 0.54 |
| 7 | Timely Available | 1.02 |
Table text extracted from the original PDF; superscript letters are shown inline. The original table image is below.
View original table image
Among the predictors, monthly consumption 5.57* and frequency of purchase 4.58* have the highest and statistically significant positive impact on consumer satisfaction, marked by triple asterisks *** denoting high significance. Other factors like price 1.56, timely availability 1.02, quantity 0.87, and packaging 0.54 have smaller, positive coefficients, but are not marked as statistically significant. This suggests that while all these factors contribute to satisfaction to some extent, frequency of purchase and monthly consumption are the most influential in driving consumer satisfaction.
Conclusion
The Buldhana sunflower oil market is active, competitive, and healthy. Consumers primarily women managing mid‑income households evaluate brands first on quality and health cues, then on availability and value. Gemini and Fortune lead in stated preference, yet retailer evidence shows Vinayaka performing strongly in actual movement, suggesting distribution reach can offset weaker preference scores. High rates of brand switching signal that loyalty is contestable; consistent supply and taste maintenance are essential.
The willingness of over half the sample to pay for fortified oil, combined with near‑universal responsiveness to price promotions, indicates room for a dual‑tier strategy: a fortification‑led premium line and a value‑driven promotional pack architecture. Improving packet size ranges and enhancing promotional visibility may address current dissatisfaction pockets and strengthen retention.
References
3 in the original paper- Aaker DA. Managing Brand Equity. New York: Free Press; 1991.
- Bhatt D, Shah A. Customer satisfaction in the edible oil industry. Int J Res Anal Rev. 2019;6(1).
- Dey S, Nath R. Consumer behavior toward edible oils and health consciousness. Int J Manag Soc Sci Res (IJMSSR). 2017;5(2).