
Research article · 2025 · Full text
International Journal of Agriculture and Food ScienceBusiness analysis of government biological pest control laboratory, Seloo, District Wardha
Volume 7(8) · Pages 20–25 · DOI: 10.33545/2664844x.2025.v7.i8a.588 ↗
Research areasEntomopathogenic Microorganisms in Pest ControlInsect Pest Control StrategiesDengue and Mosquito Control Research
Abstract
Author-writtenThe study focused on detailed economic and operational assessment of the Government Biological Pest Control Laboratory (BPCL), Seloo, functioning under the Department of Agriculture, Government of Maharashtra. The study covers the fiscal year 2024-25 and focuses on key aspects such as capital investment, cost and return structure, break-even analysis, marketing expenditure, and production constraints. The total capital investment in the unit was ₹91.00 lakhs, with major allocations to infrastructure (38.46%) and machinery (37.57%). Fixed costs totalled ₹14.69 lakhs, and variable costs stood at ₹24.30 lakhs, primarily due to raw materials and labour charges. The unit achieved a total production cost of ₹44.93 lakhs against gross returns of ₹50.10 lakhs, yielding net returns of ₹5.16 lakhs. Among the four biofertilizer products produced Azotobacter and Rhizobium (for Soybean, Tur, and Gram) Rhizobium (Tur) was found to be the most financially efficient, with the lowest break-even quantity (302.36 L) and highest margin of safety (77.20%). Marketing was conducted through a direct channel, with transportation being the major expense. Despite challenges like inadequate infrastructure and skilled labour shortages, the unit operated at a high capacity utilization rate of 91.31%. The benefit-cost ratios of all products were above 1, confirming profitability. The study concludes that the BPCL Seloo unit is economically sustainable and has strong potential for future expansion with targeted improvements.
Summary
Source-checkedPlain-language reading of the full paper, prepared with AI and checked against the text. Each point links to the authors' own words.
Why it matters
- Biofertilizers are increasingly important for sustainable agriculture as an alternative to chemical fertilizers, which can cause adverse environmental effects. View evidence ↗
- These inputs use living microorganisms to enhance soil nutrient availability through nitrogen fixation, phosphorus solubilization, and organic matter decomposition. View evidence ↗
- The Government Biological Pest Control Laboratory (BPCL) in Seloo, Wardha, is operated by the Department of Agriculture, Government of Maharashtra. View evidence ↗
The question
- The study aims to evaluate the economic performance of the BPCL laboratory, specifically its capital investment, production costs, break-even points, and marketing structure. View evidence ↗
What they did
- The analysis was based on data collected during the 2024-2025 fiscal year, spanning from April 2024 to March 2025. View evidence ↗
- Primary data was gathered through personal interviews with laboratory officials using a pretested schedule. View evidence ↗
- The study analyzed four specific biofertilizer products: Azotobacter and Rhizobium for Soybean, Tur, and Gram. View evidence ↗
What they found
- The total capital investment for the biofertilizer production project was ₹91.00 lakhs. View evidence ↗
- The total annual fixed cost for the production project was ₹14.69 lakhs. View evidence ↗
- The unit generated net returns of ₹5.16 lakhs, with gross returns of ₹50.10 lakhs against a total production cost of ₹44.93 lakhs. View evidence ↗
- Rhizobium for Tur was the most resource-efficient product, achieving the highest benefit-cost ratio of 1.72. View evidence ↗
- Rhizobium for Gram produced the highest net return at ₹12,55,977.20, whereas Rhizobium for Tur produced the lowest at ₹2,46,226.26. View evidence ↗
- Rhizobium for Tur showed the best financial efficiency, with the lowest break-even quantity of 302.36 L and the highest margin of safety at 77.20%. View evidence ↗
- Raw materials constituted the primary variable expense, accounting for over 80% of variable costs for all products. View evidence ↗
What it means
- The authors conclude that the BPCL Seloo unit is economically sustainable and possesses strong potential for expansion if targeted improvements are made. View evidence ↗
- The production unit is considered to have low financial risk and strong sustainability because all products maintained a margin of safety above 66%. View evidence ↗
Visual summary
3 visualsIllustrations explain the paper; charts are replotted from the paper's own table values.
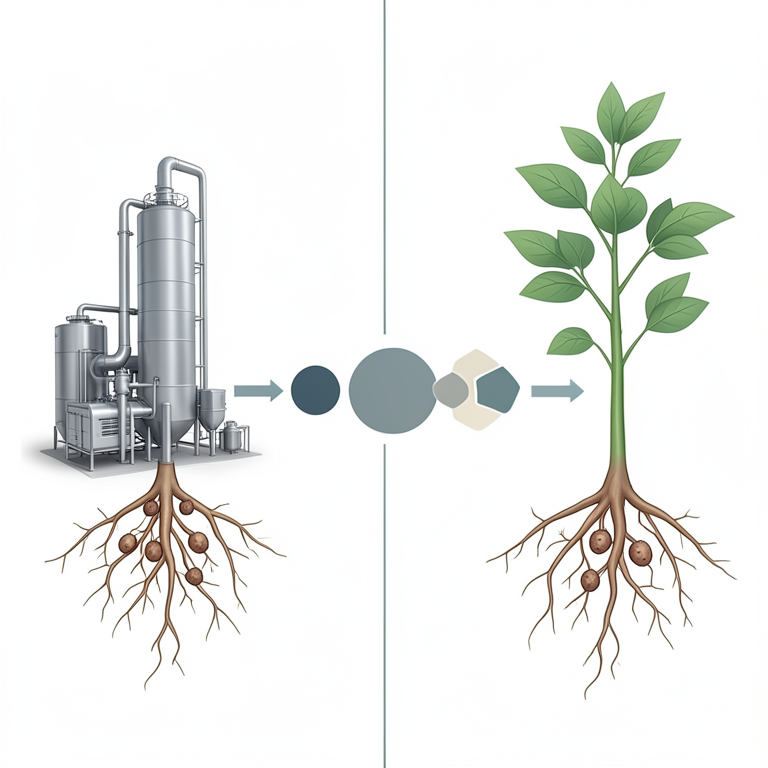
Comparative Product Efficiency
AI-generated conceptual illustration (Rhizobium biofertilizer applied to Tur and Gram legume crops). It explains the idea and does not show study data.
View source evidence ↗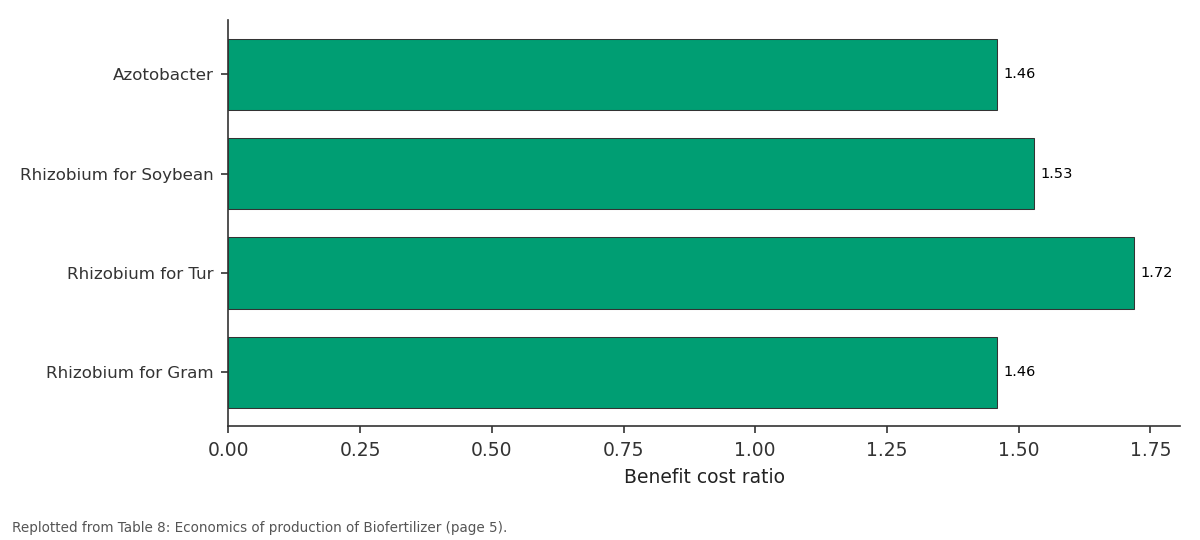
Benefit cost ratio: Azotobacter vs Rhizobium for Soybean vs Rhizobium for Tur vs Rhizobium for Gram
Replotted from Table 8 (page 5) of the original paper. Every bar is the paper's own table value.
View source evidence ↗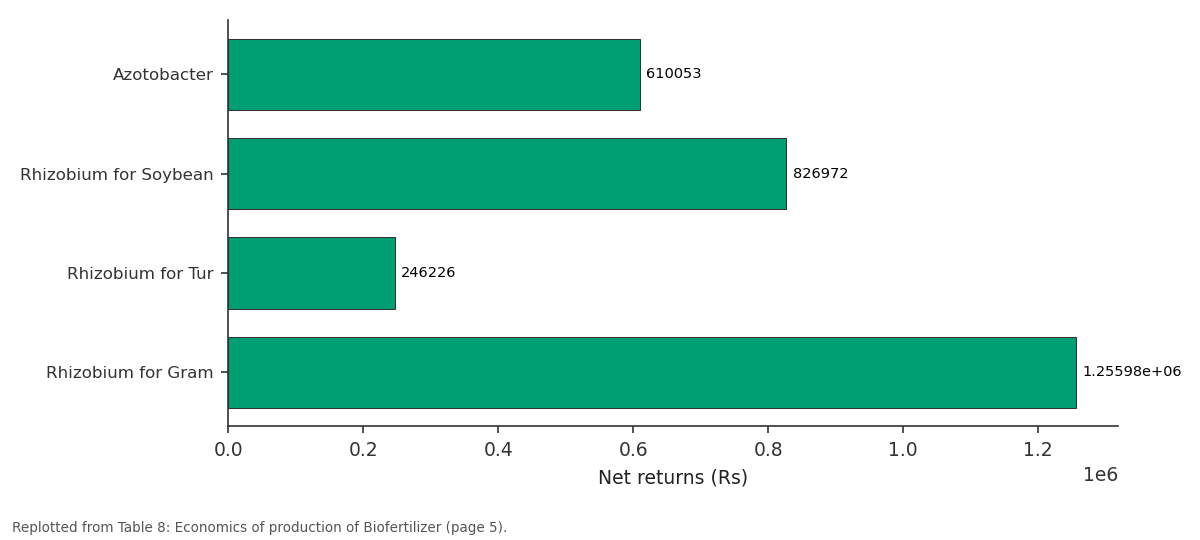
Net returns (Rs): Azotobacter vs Rhizobium for Soybean vs Rhizobium for Tur vs Rhizobium for Gram
Replotted from Table 8 (page 5) of the original paper. Every bar is the paper's own table value.
View source evidence ↗Figures & tables
From the original paper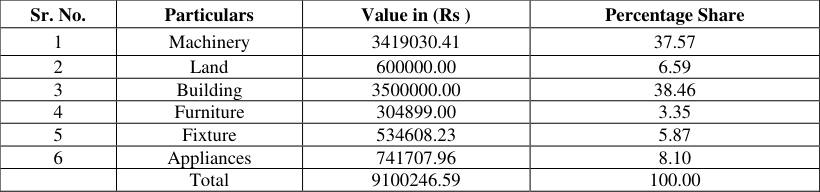 Table 1
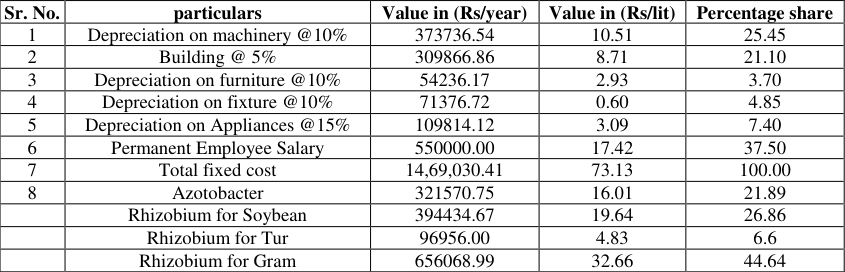 Table 2
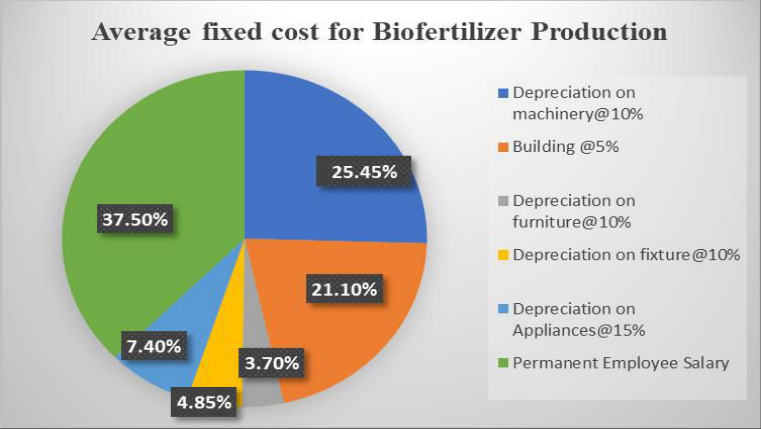 Figure 1
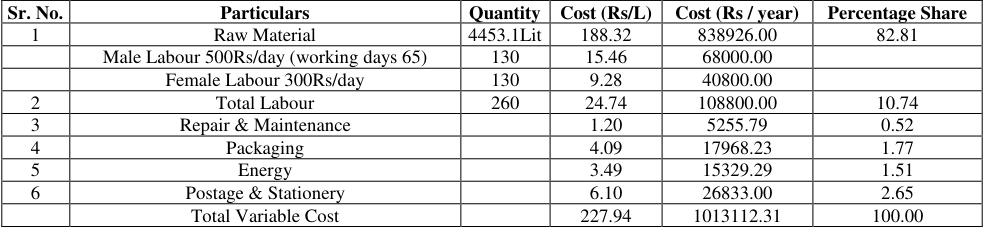 Table 3
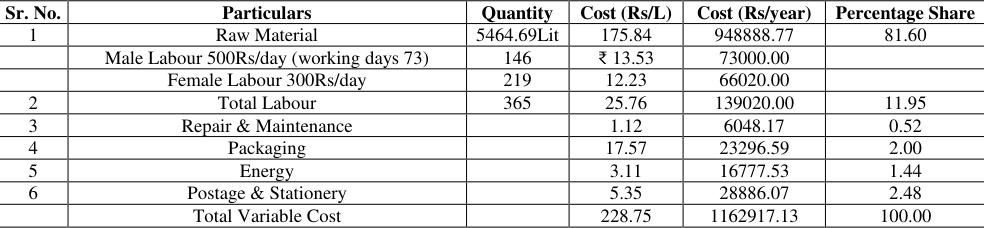 Table 4
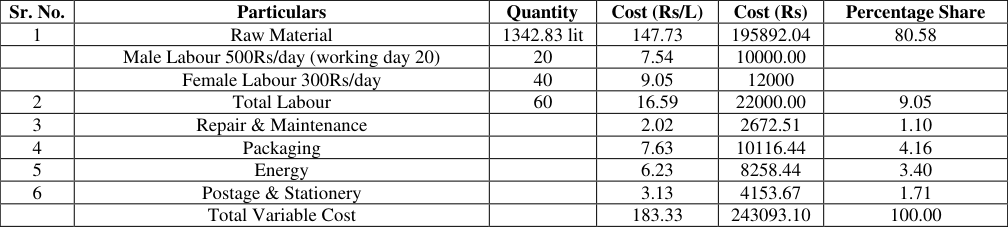 Table 5
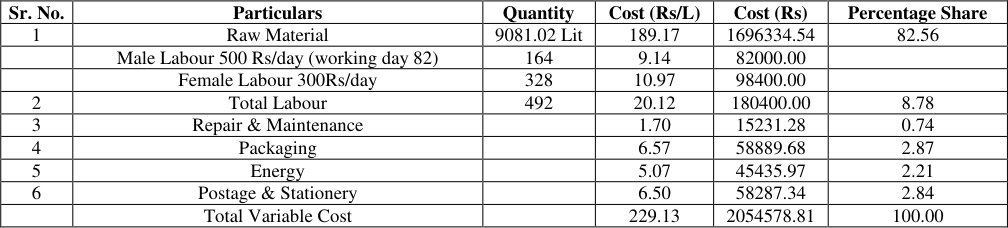 Table 6
 Table 7
 Table 8
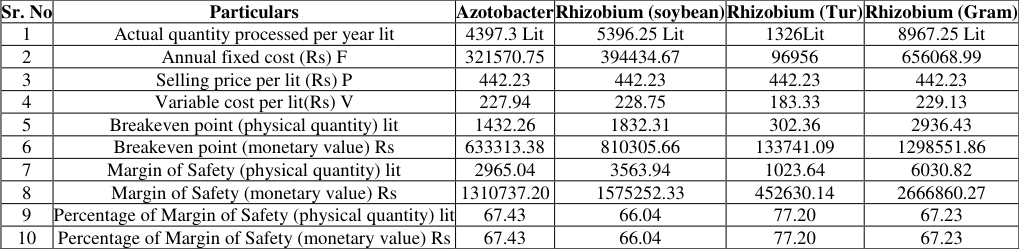 Table 9
Introduction
In recent years, biofertilizers have gained significant relevance in sustainable agriculture, especially in response to the adverse effects of long-term chemical fertilizer use. These inputs, based on beneficial microorganisms, play a crucial role in restoring soil health and supporting eco-friendly farming practices. These eco-friendly inputs contain living microorganisms that improve nutrient availability by fixing atmospheric nitrogen, solubilizing phosphorus, and decomposing organic matter in the soil (Subba Rao, 1982). Their use supports sustainable agriculture by improving soil fertility, crop productivity, and environmental health. The continuous use of chemical fertilizers has led to severe problems including decreased soil productivity, water pollution, and loss of microbial biodiversity. In contrast, biofertilizers such as Azotobacter and Rhizobium not only reduce chemical input dependency but also restore natural soil activity. As per the Ministry of Agriculture and Farmers Welfare, the promotion of bio-inputs is a key strategy under national programs like Paramparagat
The BPCL Seloo not only supports sustainable agriculture but also contributes to rural employment and skill development by involving technical staff and local labour in production and distribution activities. This research aims to study the economic performance of the laboratory by assessing its capital investment, cost of production, break-even analysis, marketing structure, and production constraints. The findings are intended to provide practical insights to policymakers, academicians, agroentrepreneurs, and rural development planners. Biofertilizers offer a range of agronomic and environmental benefits that make them a sustainable alternative to chemical fertilizers. Their key benefits include:
Methodology area of study
The present study was conducted at Government Biological Pest Control Laboratory Seloo.
Period of study
The data was collected for FY 2024-2025 i.e., from April 2024 to March 2025.
Source of Data
Primary data was collected by pretested schedule from concern person, officials of selected firm by personal interview method regarding the production of Biofertilizer. Analytical Tools
Cost and Returns of Biofertilizer Production
The collected data related to required cost and returns from Biofertilizer were analysed, tabulated on the following different aspects viz.
Fixed Cost
The fixed cost includes the data regarding the cost of machinery, building, furniture, and wages of payment employed labours, salary of staff. These information was collected from Government Biological Pest Control Laboratory Seloo.
Variable Cost
The variable cost consists of expenditure on purchase of raw material, wages of casual labours, repair and maintenance of machinery, electricity and stationary charges, etc.
Total Cost
Total cost was comprised of the total fixed cost and total variable cost calculated by adding both costs together.
Total cost = Fixed cost + Variable cost
Total cost = Fixed cost + Variable cost
Gross Returns
The gross returns for production of Biofertilizer was calculated by adding together value of main product received after production of biofertilizer. The gross returns defined as the total rate of return on an investment before the deduction of any expenses.
Gross returns = Quantity of product X Price per unit
Net Returns
The net returns refer to returns after deducting all expenses from the gross return generated by the investment. Net returns = Gross returns-Total cost
B:C ratio
The benefit cost ratio compares the present value of all benefits with that of the cost and investment of the project. B:C ratio = Gross returns / Total cost.
Breakeven Point Analysis
The point at which the two curves i.e. total cost curve and total revenue curve intersect is called as breakeven point, which indicates the level of production at which neither losses money nor makes profit. Where, F = Annual fixed cost in Rs. P = Selling price per unit in Rs. V = Variable cost per unit in Rs.
Computation in physical quantity
Computation in physical quantity
Results and Discussion
Results and Discussion
Cost and returns of selected unit
To fulfil the first objectives of the study in respect of organizational study of Biofertilizer production the results has been obtained on cost required, returns obtained from the unit are given as under
Total cost incurred by producer for production of Biofertilizer
Total cost incurred by producer for production of Biofertilizer is the sum of fixed cost and variable cost incurred by producer
Economics of production of Biofertilizer
It explores the financial of Biofertilizer production, focusing on production costs, revenue, and profitability. By evaluating these economic factors, it provides insights into the financial viability and sustainability of Biofertilizer production as a business by calculating the benefit cost ratio.
II. Break-even point analysis:
The break-even point is the number of Biofertilizer produced to cover all costs associated with the production process, including both fixed and variable expenses. It is the level at which the total revenue from sell of Biofertilizer matches the total costs incurred, meaning that no profit or loss is achieved. in variable expenditure (over 80% for all). The Benefit-Cost Ratios for all products were greater than 1 (ranging 1.46 to 1.72), indicating economic feasibility of production. The break-even analysis showed that only a small percentage of total production was required to cover costs. All products had a high margin of safety (>66%), which reflects a low financial risk and strong economic sustainability of the production unit.
Figures and tables from the paper
| Sr. No. | Particulars | Value in (Rs ) | Percentage Share |
|---|---|---|---|
| 1 | Machinery | 3419030.41 | 37.57 |
| 2 | Land | 600000.00 | 6.59 |
| 3 | Building | 3500000.00 | 38.46 |
| 4 | Furniture | 304899.00 | 3.35 |
| 5 | Fixture | 534608.23 | 5.87 |
| 6 | Appliances | 741707.96 | 8.10 |
| Total | 9100246.59 | 100.00 |
Table text extracted from the original PDF; superscript letters are shown inline. The original table image is below.
View original table image
| Sr. No. | particulars | Value in (Rs/year) | Value in (Rs/lit) | Percentage share |
|---|---|---|---|---|
| 1 | Depreciation on machinery @10% | 373736.54 | 10.51 | 25.45 |
| 2 | Building @ 5% | 309866.86 | 8.71 | 21.10 |
| 3 | Depreciation on furniture @10% | 54236.17 | 2.93 | 3.70 |
| 4 | Depreciation on fixture @10% | 71376.72 | 0.60 | 4.85 |
| 5 | Depreciation on Appliances @15% | 109814.12 | 3.09 | 7.40 |
| 6 | Permanent Employee Salary | 550000.00 | 17.42 | 37.50 |
| 7 | Total fixed cost | 14,69,030.41 | 73.13 | 100.00 |
| 8 | Azotobacter | 321570.75 | 16.01 | 21.89 |
| Rhizobium for Soybean | 394434.67 | 19.64 | 26.86 | |
| Rhizobium for Tur | 96956.00 | 4.83 | 6.6 | |
| Rhizobium for Gram | 656068.99 | 32.66 | 44.64 |
Table text extracted from the original PDF; superscript letters are shown inline. The original table image is below.
View original table image
| Sr. No. | Particulars | Quantity | Cost (Rs/L) | Cost (Rs / year) | Percentage Share |
|---|---|---|---|---|---|
| 1 | Raw Material | 4453.1Lit | 188.32 | 838926.00 | 82.81 |
| Male Labour 500Rs/day (working days 65) | 130 | 15.46 | 68000.00 | ||
| Female Labour 300Rs/day | 130 | 9.28 | 40800.00 | ||
| 2 | Total Labour | 260 | 24.74 | 108800.00 | 10.74 |
| 3 | Repair & Maintenance | 1.20 | 5255.79 | 0.52 | |
| 4 | Packaging | 4.09 | 17968.23 | 1.77 | |
| 5 | Energy | 3.49 | 15329.29 | 1.51 | |
| 6 | Postage & Stationery | 6.10 | 26833.00 | 2.65 | |
| Total Variable Cost | 227.94 | 1013112.31 | 100.00 |
Table text extracted from the original PDF; superscript letters are shown inline. The original table image is below.
View original table image
| Sr. No. | Particulars | Quantity | Cost (Rs/L) | Cost (Rs/year) | Percentage Share |
|---|---|---|---|---|---|
| 1 | Raw Material | 5464.69Lit | 175.84 | 948888.77 | 81.60 |
| Male Labour 500Rs/day (working days 73) | 146 | ₹ 13.53 | 73000.00 | ||
| Female Labour 300Rs/day | 219 | 12.23 | 66020.00 | ||
| 2 | Total Labour | 365 | 25.76 | 139020.00 | 11.95 |
| 3 | Repair & Maintenance | 1.12 | 6048.17 | 0.52 | |
| 4 | Packaging | 17.57 | 23296.59 | 2.00 | |
| 5 | Energy | 3.11 | 16777.53 | 1.44 | |
| 6 | Postage & Stationery | 5.35 | 28886.07 | 2.48 | |
| Total Variable Cost | 228.75 | 1162917.13 | 100.00 |
Table text extracted from the original PDF; superscript letters are shown inline. The original table image is below.
View original table image
| Sr. No. | Particulars | Quantity | Cost (Rs/L) | Cost (Rs) | Percentage Share |
|---|---|---|---|---|---|
| 1 | Raw Material | 1342.83 lit | 147.73 | 195892.04 | 80.58 |
| Male Labour 500Rs/day (working day 20) | 20 | 7.54 | 10000.00 | ||
| Female Labour 300Rs/day | 40 | 9.05 | 12000 | ||
| 2 | Total Labour | 60 | 16.59 | 22000.00 | 9.05 |
| 3 | Repair & Maintenance | 2.02 | 2672.51 | 1.10 | |
| 4 | Packaging | 7.63 | 10116.44 | 4.16 | |
| 5 | Energy | 6.23 | 8258.44 | 3.40 | |
| 6 | Postage & Stationery | 3.13 | 4153.67 | 1.71 | |
| Total Variable Cost | 183.33 | 243093.10 | 100.00 |
Table text extracted from the original PDF; superscript letters are shown inline. The original table image is below.
View original table image
| Sr. No. | Particulars | Quantity | Cost (Rs/L) | Cost (Rs) | Percentage Share |
|---|---|---|---|---|---|
| 1 | Raw Material | 9081.02 Lit | 189.17 | 1696334.54 | 82.56 |
| Male Labour 500 Rs/day (working day 82) | 164 | 9.14 | 82000.00 | ||
| Female Labour 300Rs/day | 328 | 10.97 | 98400.00 | ||
| 2 | Total Labour | 492 | 20.12 | 180400.00 | 8.78 |
| 3 | Repair & Maintenance | 1.70 | 15231.28 | 0.74 | |
| 4 | Packaging | 6.57 | 58889.68 | 2.87 | |
| 5 | Energy | 5.07 | 45435.97 | 2.21 | |
| 6 | Postage & Stationery | 6.50 | 58287.34 | 2.84 | |
| Total Variable Cost | 229.13 | 2054578.81 | 100.00 |
Table text extracted from the original PDF; superscript letters are shown inline. The original table image is below.
View original table image
| Sr. No. | Name of Product | Variable cost | Variable cost(Rs/lit) | Fixed cost | Fixed cost (Rs/lit) | Total cost | Total cost (Rs/lit) |
|---|---|---|---|---|---|---|---|
| 1 | Azotobacter | 1013112.31 | 227.94 | 321570.75 | 73.13 | 1334683.06 | 301.07 |
| 2 | Rhizobium for Soybean | 1162917.13 | 228.75 | 394434.67 | 73.09 | 1557351.8 | 301.84 |
| 3 | Rhizobium for Tur | 243093.1 | 183.33 | 96956.00 | 73.12 | 340049.1 | 256.45 |
| 4 | Rhizobium for Gram | 2054578.81 | 229.13 | 656068.99 | 73.16 | 2710647.8 | 302.29 |
Table text extracted from the original PDF; superscript letters are shown inline. The original table image is below.
View original table image
| Sr. No. | Particulars | Azotobacter | Rhizobium for Soybean | Rhizobium for Tur | Rhizobium for Gram |
|---|---|---|---|---|---|
| 1 | Production in Lit | 4397.3 | 5396.25 | 1326 | 8967.25 |
| 2 | Value of final product(Rs) | 1944735.77 | 2384323.56 | 586275.36 | 3966625.00 |
| 3 | Gross return (Rs) | 1944735.77 | 2384323.56 | 586275.36 | 3966625.00 |
| 4 | Total cost incurred by producer (Rs) | 1334683.06 | 1557351.80 | 340049.10 | 2710647.80 |
| 5 | Net returns (Rs) | 610052.71 | 826971.76 | 246226.26 | 1255977.20 |
| 6 | Benefit cost ratio | 1.46 | 1.53 | 1.72 | 1.46 |
Table text extracted from the original PDF; superscript letters are shown inline. The original table image is below.
View original table image
| Sr. No | Particulars | Azotobacter | Rhizobium (soybean) | Rhizobium (Tur) | Rhizobium (Gram) |
|---|---|---|---|---|---|
| 1 | Actual quantity processed per year lit | 4397.3 Lit | 5396.25 Lit | 1326Lit | 8967.25 Lit |
| 2 | Annual fixed cost (Rs) F | 321570.75 | 394434.67 | 96956 | 656068.99 |
| 3 | Selling price per lit (Rs) P | 442.23 | 442.23 | 442.23 | 442.23 |
| 4 | Variable cost per lit(Rs) V | 227.94 | 228.75 | 183.33 | 229.13 |
| 5 | Breakeven point (physical quantity) lit | 1432.26 | 1832.31 | 302.36 | 2936.43 |
| 6 | Breakeven point (monetary value) Rs | 633313.38 | 810305.66 | 133741.09 | 1298551.86 |
| 7 | Margin of Safety (physical quantity) lit | 2965.04 | 3563.94 | 1023.64 | 6030.82 |
| 8 | Margin of Safety (monetary value) Rs | 1310737.20 | 1575252.33 | 452630.14 | 2666860.27 |
| 9 | Percentage of Margin of Safety (physical quantity) lit | 67.43 | 66.04 | 77.20 | 67.23 |
| 10 | Percentage of Margin of Safety (monetary value) Rs | 67.43 | 66.04 | 77.20 | 67.23 |
Table text extracted from the original PDF; superscript letters are shown inline. The original table image is below.
View original table image
References
5 in the original paper- Mondal R. Economic analysis of cost and return structure of paddy cultivation under traditional and SRI International Journal of Agriculture and Food Science https://www.agriculturaljournals.com method: A comparative study. Int J Agric Sci. 2018;10(8):5890-5893.
- Zulkifli M, Haeruddin S, Rachmawaty. Break-even point analysis of liquid inorganic fertilizer business: A case study of Gapoktan Bubun Rondon, Alla District, Enrekang Regency. J Environ Agric Stud. 2023;4(3):58-67.
- Meshram RR, Shende NV, Kathale SD. Cost-benefit analysis and marketing of cabbage vegetable in Bhandara District. RNI No. UPBIL/55438. 2012;IV(II):10-16.
- Matakana MJ, Siregar HM, Saragih B. Value added analysis, break-even point and profit of tofu industry in Nabire Regency. J Soc Sci Res. 2021;17(2):112-120.
- Patience S, Ali O. Analysis of costs and returns of groundnut processing in Taraba State, Nigeria. J Res Bus Manag. 2017;5(6):19-26.