
Research article · 2025 · Full text
International Journal of Agriculture and Food ScienceNutrient utilization in Mewari chicks fed varying crude protein in the diet under intensive system in southern Rajasthan
Volume 7(7) · Pages 358–361 · DOI: 10.33545/2664844x.2025.v7.i7e.528 ↗
Research areasLivestock and Poultry ManagementAgricultural Economics and PracticesAgricultural Practices and Plant Genetics
Abstract
Author-writtenThe purpose of this study was to determine the most effective protein levels for Mewari chicks. Five hundred ten day-old unsexed Mewari chicks were obtained from AICRP on Poultry Breeding, Rajasthan College of Agriculture, Udaipur. They were then randomly separated into five feeding groups, each with six repetitions of 17 birds. The chicks were raised using a deep litter housing system according to standard methods until they were 8 weeks old. These day-old Mewari chicks were given five distinct experimental diets that had the same calorie content but varied in crude protein levels: 16%, 17%, 18%, 19%, and 20%. To assess how different dietary protein levels affected nutrient use, a metabolic trial was performed once the feeding period concluded. The digestibility rates for all nutrients, except for dry matter (DM) which showed no significant difference, were notably higher in treatment group 3 (T3) when compared to the other groups. The average digestibility rates for crude protein (78.38±0.88), crude fiber (76.33±1.00), ether extract (EE) (85.91±0.59), and nitrogen-free extract (NFE) (80.14±0.840) were significantly greater (p
Summary
Source-checkedPlain-language reading of the full paper, prepared with AI and checked against the text. Each point links to the authors' own words.
Why it matters
- Poultry farming is a highly profitable and economically viable industry that provides significant employment opportunities. View evidence ↗
- The Mewari chicken is the only registered breed originating from Southern Rajasthan. View evidence ↗
- While nutrient utilization is well-studied in broilers, there is a lack of available information regarding the Mewari chick. View evidence ↗
The question
- The study aimed to identify the most effective dietary protein levels for Mewari chicks. View evidence ↗
What they did
- The experiment used 510 day-old, unsexed Mewari chicks sourced from the Rajasthan College of Agriculture. View evidence ↗
- Chicks were randomly assigned to five dietary treatment groups, each consisting of six replicates of 17 birds. View evidence ↗
- The birds were fed iso-caloric diets with varying crude protein levels: 16%, 17%, 18%, 19%, and 20%. View evidence ↗
- Data were analyzed using a completely randomized design (CRD) and analysis of variance (ANOVA). View evidence ↗
What they found
- Treatment group 3 (T3) showed significantly higher digestibility rates for all nutrients except dry matter compared to other groups. View evidence ↗
- The diet with 18% crude protein (T3) resulted in significantly higher digestibility rates (p<0.01) for crude protein (78.38±0.88%), crude fiber (76.33±1.00%), ether extract (85.91±0.59%), and nitrogen-free extract (80.14±0.840%). View evidence ↗
- There was no statistically significant difference in the digestibility coefficient of dry matter across the five treatment groups. View evidence ↗
- Nitrogen balance was significantly higher (P<0.01) in groups T3 (1.45±0.06 g), T4 (1.38±0.04 g), and T5 (1.41±0.02 g) compared to T1 (1.10±0.03 g) and T2 (1.16±0.02 g). View evidence ↗
- Crude protein intake was highest in T5 (11.71±0.16 g) and lowest in T1 (9.52±0.22 g). View evidence ↗
What it means
- The authors conclude that a diet containing 18% crude protein is the most favorable level for enhancing nutrient digestibility in Mewari chicks during the first 8 weeks of age. View evidence ↗
Figures & tables
From the original paper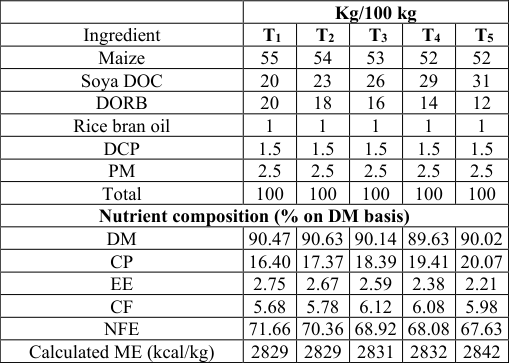 Table 1
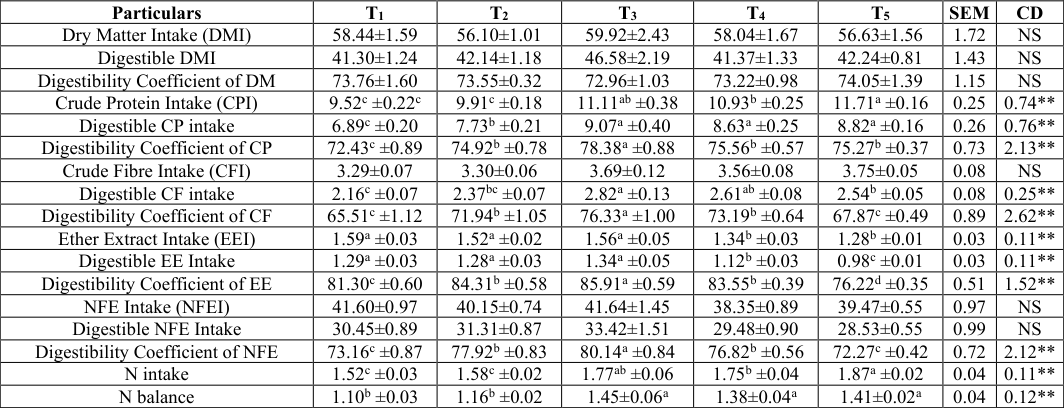 Table 2
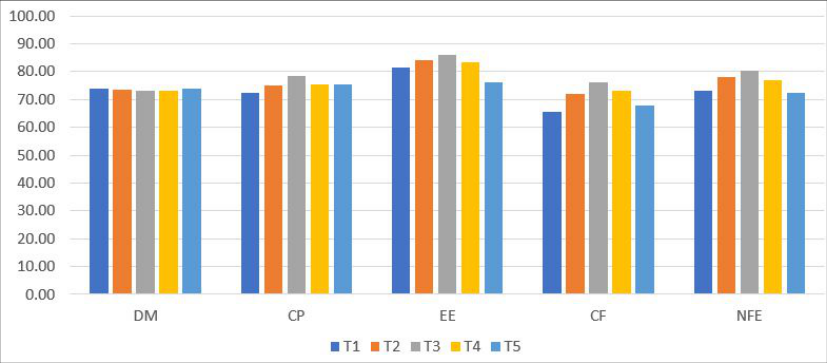 Figure 1
Introduction
Poultry farming is a largest profitable and economically viable venture as it provides employment to the large section of the society. Poultry refers to birds like chickens, ducks, and turkeys that people raise for their eggs, meat and feathers. The poultry industry involves the breeding, hatching, rearing and processing of domestic birds. Rearing poultry is a very old practice in our country and it is now an important contributor to the economy in rural and semi-urban areas. In the Indian poultry market, approximately 70% of the total production originates from the organized sector, with the remaining 30% coming from the unorganized sector. For egg production, India's southern region is the biggest contributor at around 57%. The eastern and central regions collectively produce about 17%, and the northern and western regions together account for 26% of the total Mewari is the only registered breed of Rajasthan which has been originated from Southern Rajasthan and is distributed in many other districts of Rajasthan. This breed is small to medium-sized, distinguished by its multicolored feathers and a red, single comb. In their natural environment, adult females usually weigh between 1.09 and 1.47 kg, with males typically weighing 2.29 kg. However, an average egg production of 37-52 an age at first egg ranging from 6-7.5 months, its productivity remains low (Mishra et al., 2022) [4] . Soybean De-oiled Cake (DOC) stands out as the most popular vegetable protein source, despite its frequent high cost. Due to the increased availability and reasonable price of synthetic amino acids, new diet formulations have been adopted. These diets are now created with precise amino acid concentrations and minimum protein levels to effectively reduce costs and lessen nitrogen excretion. There has been lot work on utilization of nutrients in broiler, however such work on indigenous chicken is very scarce and the information on Mewari chick is not available.
Materials and Methods
Materials and Methods
Experimental birds and diets
A total of 510 straight-run, day-old Mewari chicks were obtained from AICRP on Poultry breeding, Rajasthan College of Agriculture, Udaipur. They were randomly separated into five different dietary treatment groups, with each group further divided into six replicates of 17 birds. The chicks were reared in a deep litter housing system, adhering to standard practices. The chicks were fed five different iso caloric experimental rations containing five different levels of crude protein viz. This involved randomly selecting two birds (one male and one female) from each replicate within the treatment groups and transferring them to metabolic cages. This ensured precise measurement of feed intake and the complete collection of all excreta (faeces and urine combined) from a total of ten birds per treatment. This is done to accurately determine the digestibility and utilization of nutrients from different diets. The birds were individually fed with experimental diet. The birds were given adaptation period of 6 days followed by 3 days collection of excreta voided. For subsequent nutrient analysis, measurements of feed offered, feed waste, and voided excreta were meticulously recorded during the collection phase. During the trial, the excreta (droppings) from each individual bird in every treatment group were collected and weighed every 24 hours at precisely 8:00 AM. Simultaneously, representative samples of the feed offered were taken for a detailed proximate analysis. Following this, aliquots (sub-samples) of the faecal matter were also carefully prepared for a comprehensive nutrient analysis. This meticulous collection ensured accurate data for understanding nutrient digestion and utilization. The proximate principles present in the feed and faeces were determined as per AOAC, 2005.
Statistical Analysis
The experiment's structure was based on the completely randomized design (CRD). All collected data, encompassing parameters like body weight, body weight gain, feed intake, feed conversion ratio, nutrient digestibility, and the economic aspects of rearing Mewari chicks, underwent analysis via analysis of variance, adhering to the methodology presented by Snedecor and Cochran (1994).
Results and Discussion
All the dietary treatments were iso caloric with metabolizable energy ranged from 2829-2842 Kcal/kg diet, However the CP contents were 16.40, 17.37, 18.39, 19.41 and 20.07% in T1, T2, T3, T4 and T5 respectively. All the other nutrients were in experimental diets were normal range across all dietary treatments groups (Table 1). The nutrient intake, digestible nutrient intake and digestibility coefficients are presented in Table 2 and Fig. 1. Following the conclusion of the 8-week feeding trial, a comprehensive metabolic trial was executed to ascertain the digestibility coefficients of the various dietary regimens administered to the Mewari chicks. The ensuing data, precisely detailing nutrient intake and subsequent utilization, is meticulously catalogued within Table 4.6. The dry matter intake (g/bird/day) was 58.44±1.59, 56.10±1.01, 59.92±2.43, 58.04±1.67 and 56.63±1.56 g in T1, T2, T3, T4 and T5 groups respectively. Nevertheless, no statistically significant variation in DMI was observed among the distinct dietary treatment groups. The mean digestible dry matter intakes were 41.30±1.24, 42.14±1.18, 46.58±2.19, 41.37±1.33 and 42.24±0.81 g in T1, T2, T3, T4 and T5 groups respectively. The variations in mean digestible dry matter intake among groups were minor and not statistically significant. The mean digestibility coefficients of dry matter for groups T1, T2, T3, T4, and T5 were recorded as 73.76±1.60%, 73.55±0.32%, 72.96±1.03%, 73.22±0.98%, and 74.05±1.39% respectively. However, the differences in dry matter digestibility between these groups were not statistically significant. The mean crude protein intakes (g/bird/day) were 9.52±0.22, 9.91±0.18, 11.11±0.38, 10.93±0.25 and 11.71±0.16 in T1, T2, T3, T4 and T5 groups respectively. The data revealed that the difference in the mean CP intake was significantly higher in (P<0.01) T5 followed by T3, T4 and lowest in T2 and T1. However, T3 did not differ with T5 and T4. Similarly, the difference in CP intake in T1 and T2 was also found to be non-significant. The mean digestible crude protein intakes were 6.89±0.20, 7.73±0.21, 9.07±0.40, 8.63±0.25 and 8.82±0.16 g in T1, T2, T3, T4 and T5 groups respectively. The data revealed that the mean digestible CP intake was significantly higher (P<0.01) in T3, T5, T4, followed by T2 and lowest in T1. The difference between T3, T5 and T4 was found to be nonsignificant. The mean digestible crude protein coefficients were 72.43±0.89, 74.92±0.78, 78.38±0.88, 75.56±0.57 and 75.27±0.37% in T1, T2, T3, T4 and T5 respectively. It was found that T3 demonstrated significantly higher crude protein digestibility (P<0.01). While, the overall ranking from highest to lowest digestibility was T3 followed by T4, T5, T2 and lowest in T1. The differences in digestibility among T4, T5 and T2 were not statistically significant. The mean crude fibre intake (CFI) were 3.29±0.07, 3.30±0.06, 3.69±0.12, 3.56±0.08 and 3.75±0.05 g in T1, T2, T3, T4 and T5 groups respectively. The keen perusal of data revealed that the difference in mean CF intake was nonsignificant. The mean digestible CF intakes were 2.16±0.07, 2.37±0.07, 2.82±0.13, 2.16±0.08 and 2.54±0.05 g respectively in T1, T2, T3, T4 and T5 groups. The difference in mean digestible CF intake was found to be significantly higher in T3 (P<0.01) followed by T4, T5, T2 and lowest in T1. However, the digestible CF intake in T3 did not differ significantly with T3, T5 and T2. Similarly, the digestible CF intake in T2 was found to be statistically non-significant with T4, T5 and T1. The mean digestibility coefficients of crude fibre were 65.51±1.12, 71.94±1.05, 76.33±1.00, 73.19±0.64 and 67.87±0.49% in T1, T2, T3, T4 and T5 groups respectively. The mean value was significantly higher in T3 (P<0.01) followed by T4, T2 and lowest in T5 and T1. However, the difference in mean digestibility in T4 and T2 and T5 and T1 did not differ significantly. The mean Ether Extract intakes were 1.59±0.03, 1.52±0.02, 1.56±0.05, 1.34±0.03 and 1.28±0.01 g in T1, T2, T3, T4 and T5 groups respectively. It was found that the mean EE intake was significantly higher (p<0.01) in T1, T3 and T2 as compared to T4 and T5. However, the difference in ether extract intake among T1, T3 and T2 and T5 and T4 was small and statistically non-significant. The mean digestible EE intakes were 1.29±0.03, 1.28±0.03, 1.34±0.05, 1.12±0.03 and 0.98±0.01 g in T1, T2, T3, T4and T5 groups respectively. The difference in mean digestible EE intake amongst different groups was found to be significantly higher in T3 followed by T1, T2 and lowest in T4 and T5. However, the difference in T3, T1, T2 were found to be non-significant. The mean digestibility coefficients of ether extract were 81.30±0.60, 84.31±0.58, 85.91±0.59, 83.55±0.39 and 76.22±0.35% in T1, T2, T3, T4 and T5 groups respectively. The mean digestibility coefficient in significantly higher in (P<0.01) T3 followed by T2, T4, T1 and lowest in T5. Based on the data analysis, it was determined that the mean digestibility coefficient of ether extract for groups T2 and T4 was statistically non-significant. The mean NFE intake was 41.60±0.97, 40.15±0.74, 41.64±1.45, 38.35±0.89 and 39.47±0.55 g in T1, T2, T3, T4 and T5 groups respectively. The keen perusal of data revealed that the difference in mean NFE intake was nonsignificant. The mean digestible NFE intakes were 30.45±0.89, 31.31±0.87, 33.42±1.51, 29.48±0.90 and 28.53±0.55 g in International Journal of Agriculture and Food Science https://www.agriculturaljournals.com T1, T2, T3, T4 and T5 respectively. The mean digestible intake was found to be statistically non-significant.
| Particulars | T1 | T2 | T3 | T4 | T5 | SEM | CD |
|---|---|---|---|---|---|---|---|
| Dry Matter Intake (DMI) | 58.44±1.59 | 56.10±1.01 | 59.92±2.43 | 58.04±1.67 | 56.63±1.56 | 1.72 | NS |
| Digestible DMI | 41.30±1.24 | 42.14±1.18 | 46.58±2.19 | 41.37±1.33 | 42.24±0.81 | 1.43 | NS |
| Digestibility Coefficient of DM | 73.76±1.60 | 73.55±0.32 | 72.96±1.03 | 73.22±0.98 | 74.05±1.39 | 1.15 | NS |
| Crude Protein Intake (CPI) | 9.52c ±0.22c | 9.91c ±0.18 | 11.11ab ±0.38 | 10.93b ±0.25 | 11.71a ±0.16 | 0.25 | 0.74** |
| Digestible CP intake | 6.89c ±0.20 | 7.73b ±0.21 | 9.07a ±0.40 | 8.63a ±0.25 | 8.82a ±0.16 | 0.26 | 0.76** |
| Digestibility Coefficient of CP | 72.43c ±0.89 | 74.92b ±0.78 | 78.38a ±0.88 | 75.56b ±0.57 | 75.27b ±0.37 | 0.73 | 2.13** |
| Crude Fibre Intake (CFI) | 3.29±0.07 | 3.30±0.06 | 3.69±0.12 | 3.56±0.08 | 3.75±0.05 | 0.08 | NS |
| Digestible CF intake | 2.16c ±0.07 | 2.37bc ±0.07 | 2.82a ±0.13 | 2.61ab ±0.08 | 2.54b ±0.05 | 0.08 | 0.25** |
| Digestibility Coefficient of CF | 65.51c ±1.12 | 71.94b ±1.05 | 76.33a ±1.00 | 73.19b ±0.64 | 67.87c ±0.49 | 0.89 | 2.62** |
| Ether Extract Intake (EEI) | 1.59a ±0.03 | 1.52a ±0.02 | 1.56a ±0.05 | 1.34b ±0.03 | 1.28b ±0.01 | 0.03 | 0.11** |
| Digestible EE Intake | 1.29a ±0.03 | 1.28a ±0.03 | 1.34a ±0.05 | 1.12b ±0.03 | 0.98c ±0.01 | 0.03 | 0.11** |
| Digestibility Coefficient of EE | 81.30c ±0.60 | 84.31b ±0.58 | 85.91a ±0.59 | 83.55b ±0.39 | 76.22d ±0.35 | 0.51 | 1.52** |
| NFE Intake (NFEI) | 41.60±0.97 | 40.15±0.74 | 41.64±1.45 | 38.35±0.89 | 39.47±0.55 | 0.97 | NS |
| Digestible NFE Intake | 30.45±0.89 | 31.31±0.87 | 33.42±1.51 | 29.48±0.90 | 28.53±0.55 | 0.99 | NS |
| Digestibility Coefficient of NFE | 73.16c ±0.87 | 77.92b ±0.83 | 80.14a ±0.84 | 76.82b ±0.56 | 72.27c ±0.42 | 0.72 | 2.12** |
| N intake | 1.52c ±0.03 | 1.58c ±0.02 | 1.77ab ±0.06 | 1.75b ±0.04 | 1.87a ±0.02 | 0.04 | 0.11** |
| N balance | 1.10b ±0.03 | 1.16b ±0.02 | 1.45±0.06a | 1.38±0.04a | 1.41±0.02a | 0.04 | 0.12** |
Table text extracted from the original PDF; superscript letters are shown inline. The original table image is below.
View original table image
| — | Kg/100 kg | — | — | — | — |
|---|---|---|---|---|---|
| Ingredient | T1 | T2 | T3 | T4 | T5 |
| Maize | 55 | 54 | 53 | 52 | 52 |
| Soya DOC | 20 | 23 | 26 | 29 | 31 |
| DORB | 20 | 18 | 16 | 14 | 12 |
| Rice bran oil | 1 | 1 | 1 | 1 | 1 |
| DCP | 1.5 | 1.5 | 1.5 | 1.5 | 1.5 |
| PM | 2.5 | 2.5 | 2.5 | 2.5 | 2.5 |
| Total | 100 | 100 | 100 | 100 | 100 |
| Nutrient composition (% on DM basis) | |||||
| DM | 90.47 | 90.63 | 90.14 | 89.63 | 90.02 |
| CP | 16.40 | 17.37 | 18.39 | 19.41 | 20.07 |
| EE | 2.75 | 2.67 | 2.59 | 2.38 | 2.21 |
| CF | 5.68 | 5.78 | 6.12 | 6.08 | 5.98 |
| NFE | 71.66 | 70.36 | 68.92 | 68.08 | 67.63 |
| Calculated ME (kcal/kg) | 2829 | 2829 | 2831 | 2832 | 2842 |
Table text extracted from the original PDF; superscript letters are shown inline. The original table image is below.
View original table image
The mean digestibility coefficients of NFE were 73.16±0.87, 77.92±0.83, 80.14±0.84, 76.82±0.56 and 72.27±0.42% in T1, T2, T3, T4 and T5 respectively. The perusal of data revealed that the mean digestibility coefficient of NFE was significantly highest (P<0.01) in T3 followed by T2, T4 and lowest in T1 and T5. However, the difference in T2 and T4 and T1 and T5 were found to be nonsignificant.
The nitrogen intakes in different groups were 1.52±0.03, 1.58±0.02, 1.77±0.06, 1.75±0.04 and 1.87±0.02 g in T1, T2, T3, T4 and T5 respectively. It was found from the perusal of data that the nitrogen intake was significantly (P˂0.01) higher in T5 followed by T3, T4 and lowest in T2 and T1. However, the difference between T1 and T2 was nonsignificant and value observed in T3 did not differ with T4 and T5. The nitrogen balances were 1.10±0.03, 1.16±0.02, 1.45±0.06, 1.38±0.04 and 1.41±0.02 g in T1, T2, T3, T4 and T5 groups respectively. The mean of nitrogen balance was significantly higher (P˂0.01) in T3, T5 and T4 as compared to T2 and T1. However, the difference between T3, T5 and T4 and T2 and T1 was found to be statistically non-significant.
The digestibility coefficients of CP, CF, EE and NFE were found to be significantly higher in T3 compared to other treatment groups indicating better utilization of nutrients which resulted in higher body weight gains and feed efficiency.
In opposition to the findings of this study, Perveen et al.
(2017) [5] observed non-significant effect on digestibility and nutrient balances in Vanaraja chicken fed different levels of protein and energy. Similar results were also observed by Candrawati (2020) [3] in a study determine the effects of disparate dietary energy-to-protein ratios on both feedstuff digestibility and the initial growth performance of indigenous chicken breeds. Wang et al. (2020) [7] studied the impact of disparate dietary crude protein inclusion rates and exogenous protease on growth performance. A total of 960 fourteen-day-old male ducks were systematically allocated to ten distinct dietary treatments, each replicated in six pens. A regimen featuring 13.5% CP evinced a propitious effect (P<0.05) on meat quality, the utilization efficiency of dietary dry matter, energy and nitrogen as well as the standardized ileal digestibility of amino acids. Nevertheless, within the confines of this study, an 18% protein concentration markedly elevated the digestibility coefficients of nutrients. Sefat et al. (2022) [2] examined how supplementing diets with an emulsifier blend at varying metabolizable energy and crude protein levels affected broiler performance. It was observed that the emulsifier blend increased the ileal digestibility of crude protein and crude fat, along with the apparent metabolizable energy for nitrogen balance (P<0.05%). Notably, this positive response was more pronounced at lower ME concentrations, indicating a significant ME x Emulsifier blend (EB) interaction.
Acknowledgement
AcknowledgmentThe authors are thankful to Head, Department of Animal Production and ICAR-AICRP on poultry breeding project for providing facilities during the experiment to carried out the research work.
References
6 in the original paper- Ahmadi-Sefat AA, Taherpour K, Ghasemi HA, Gharaei MA, Shirzadi H, Rostami F, et al. Effects of an emulsifier blend supplementation on growth performance, nutrient digestibility, intestinal morphology, and muscle fatty acid profile of broiler chickens fed with different levels of energy and protein. Poult Sci. 2022;101(11):102145.
- Candrawati DPMA. The effect of different energyprotein ratio in diets on feed digestibility and performance of native chickens in the starter phase. Int J Fauna Biol Stud. 2020;7(3):92-96.
- Mishra S, Chatterjee RN, Haunshi S, Rajkumar U. Characterization of Mewari, indigenous chicken breed, from hot tropical climate of India. Indian J Anim Sci. 2022;92(12):1408-1414.
- Perween S, Kumar K, Kumar S, Chandramoni GA. Effect of feeding different dietary level of energy and protein on nutrient utilization and production economy in Vanaraja chicken under hot humid environment. Environ Ecol. 2017;35:544-548.
- Rao SV, Paul SS, Raju MVLN, Nagalakshmi D, Prakash B, Phani P. Requirements of metabolisable energy, crude protein and methionine for growing white leghorn chicken under tropical condition. Anim Nutr Feed Technol. 2024;24(1):1-13.
- Wang QD, Zhang KY, Zhang Y, Bai SP, Ding XM, Wang JP, et al. Effects of dietary protein levels and protease supplementation on growth performance, carcass traits, meat quality, and standardized ileal digestibility of amino acid in Pekin ducks fed a complex diet. Poult Sci. 2020;99(7):3557-3566.