
Research article · 2025 · Full text
International Journal of Agriculture and NutritionAssessment of genetic diversity in cowpea (Vigna unguiculata L.)
Volume 7(7) · Pages 87–91 · DOI: 10.33545/26646064.2025.v7.i7b.242 ↗
Research areasAgricultural pest management studiesGenetic and Environmental Crop StudiesGenetics and Plant Breeding
Abstract
Author-writtenCowpea (Vigna unguiculata L. Walp) is an important legume crop valued for its adaptability, high protein content, and soil enriching properties. The present study was conducted to assess the genetic variability, trait associations, and genetic divergence among thirty diverse cowpea genotypes for ten yield and yield contributing and quality - related traits, with high heritability and high genetic advance recorded for plant height, yield per plant, number of branches, number of pods per plant, indicating the influence of additive gene action and potential for effective selection. correlation and path coefficient analyses revealed that number of pods per plant,100- seed weight, plant height and number of branches were the most influential traits contributing to seed yield, both directly and indirectly. Genotype Phule Sonali showed highest seed yield (23.89 g/plant)and number of pods (18.18), while TPTC-1 exhibited the tallest plants (85.50 cm) and CPD-32 had the highest number of seeds per plant (13.06) GCP-6 and CPD-119 recorded the highest protein (30.66%) and methionine content (36.48%) respectively, highlighting their superiority. Genetic divergence using Mahalnobis D2 statistics grouped the genotypes into seven clusters, with maximum inter-cluster distance observed between cluster II and VII, indicating wide genetic diversity. Genotypes from these clusters, particularly high -yielding and nutritionally superior types are recommended for hybridization to develop improved cowpea varities.
Summary
Source-checkedPlain-language reading of the full paper, prepared with AI and checked against the text. Each point links to the authors' own words.
Why it matters
- Cowpea is a significant legume crop known for its ability to adapt to different environments, its high protein levels, and its capacity to enrich the soil. View evidence ↗
- Cowpea yields are currently low and unstable, which is attributed to a narrow genetic base and a lack of systematic selection and genetic improvement. View evidence ↗
- Analyzing genetic diversity is critical for crop improvement because it allows breeders to identify the best parent plants for hybridization. View evidence ↗
The question
- The study aimed to evaluate the genetic variability of thirty different cowpea genotypes based on key nutritional and agronomic traits. View evidence ↗
What they did
- Thirty cowpea genotypes from various research institutions were evaluated at the Post Graduate Institute Rahuri during the 2024 kharif season. View evidence ↗
- The experiment used a randomized block design (RBD) with three replications. View evidence ↗
- Ten parameters were measured on five randomly selected plants per treatment, including plant height, yield per plant, protein content, and methionine content. View evidence ↗
- The researchers used Mahalanobis D2 statistics, cluster analysis, and principal component analysis (PCA) to assess genetic diversity. View evidence ↗
What they found
- The Phule Sonali genotype achieved the highest seed yield at 23.89 g/plant and the highest number of pods at 18.18. View evidence ↗
- TPTC-1 was the tallest genotype at 85.50 cm, while CPD-32 produced the most seeds per plant at 13.06. View evidence ↗
- The highest protein content (30.66%) was found in GCP-6, and the highest methionine content (36.48%) was found in CPD-119. View evidence ↗
- The strongest direct positive effects on seed yield came from the number of pods per plant (0.8915) and 100-seed weight (0.5990). View evidence ↗
- Protein content was negatively correlated with seed yield, with genotypic and phenotypic correlations of -0.114 and -0.048, respectively. View evidence ↗
- The greatest genetic divergence was found between Cluster II and Cluster VII, with a distance (D) of 18.30 and a squared distance (D²) of 334.89. View evidence ↗
What it means
- The authors recommend using high-yielding and nutritionally rich genotypes from divergent clusters, such as Phule Sonali, CPD-32, TPTC-1, and GCP-6, for hybridization to create superior cultivars. View evidence ↗
Visual summary
3 visualsIllustrations explain the paper; charts are replotted from the paper's own table values.
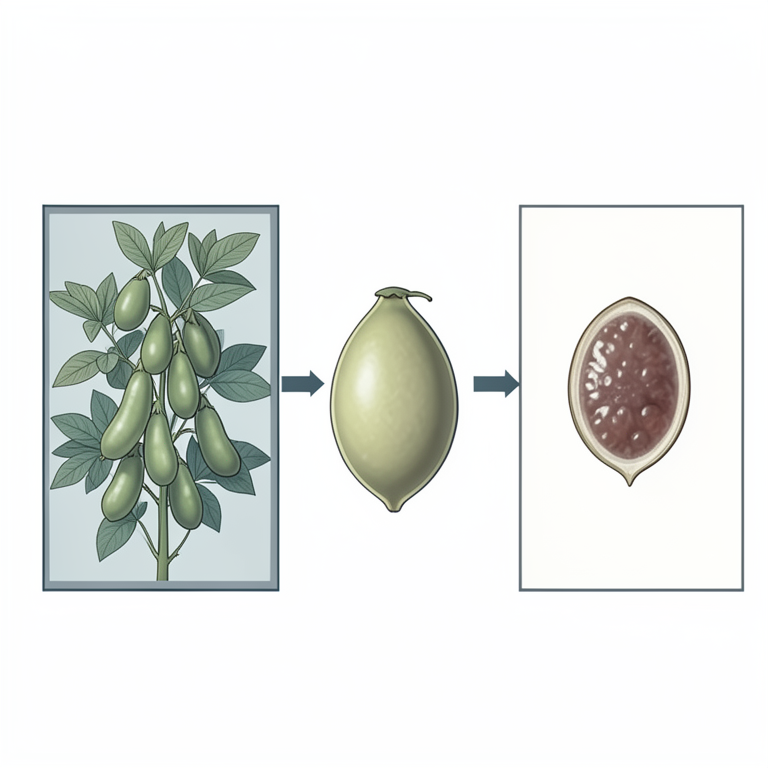
Yield Correlation Map
AI-generated conceptual illustration (cowpea plants (Vigna unguiculata L.)). It explains the idea and does not show study data.
View source evidence ↗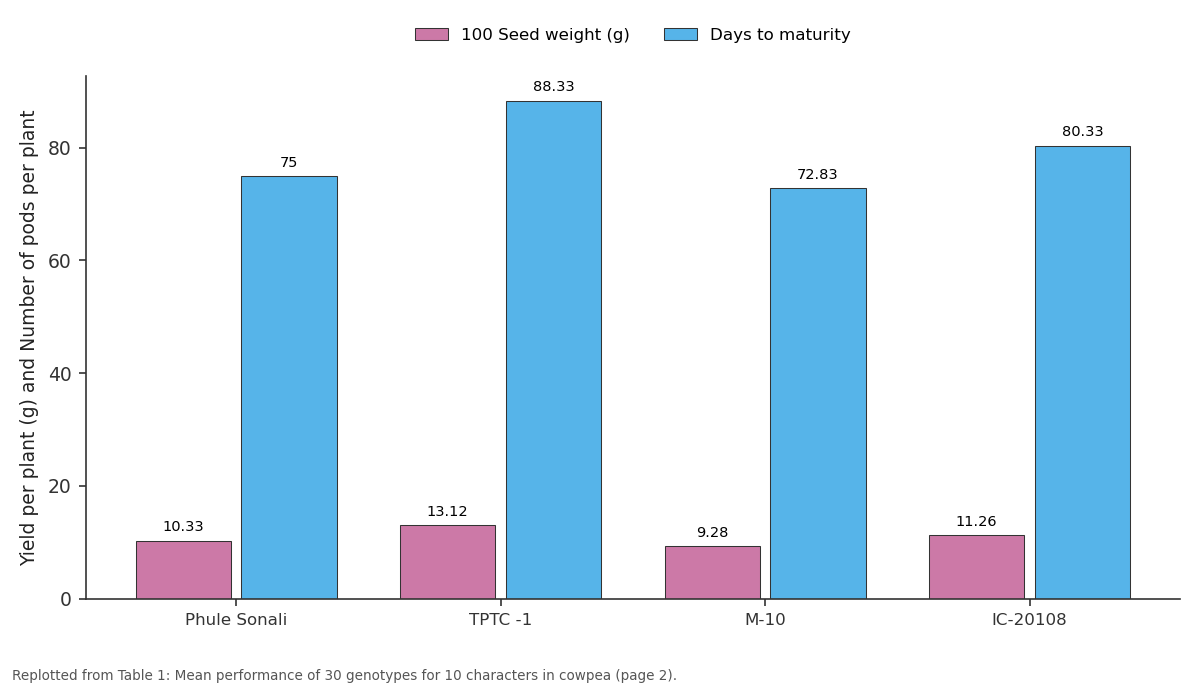
100 Seed weight (g) and Days to maturity: Phule Sonali vs TPTC -1 vs M-10 vs IC-20108
Replotted from Table 1 (page 2) of the original paper. Every bar is the paper's own table value.
View source evidence ↗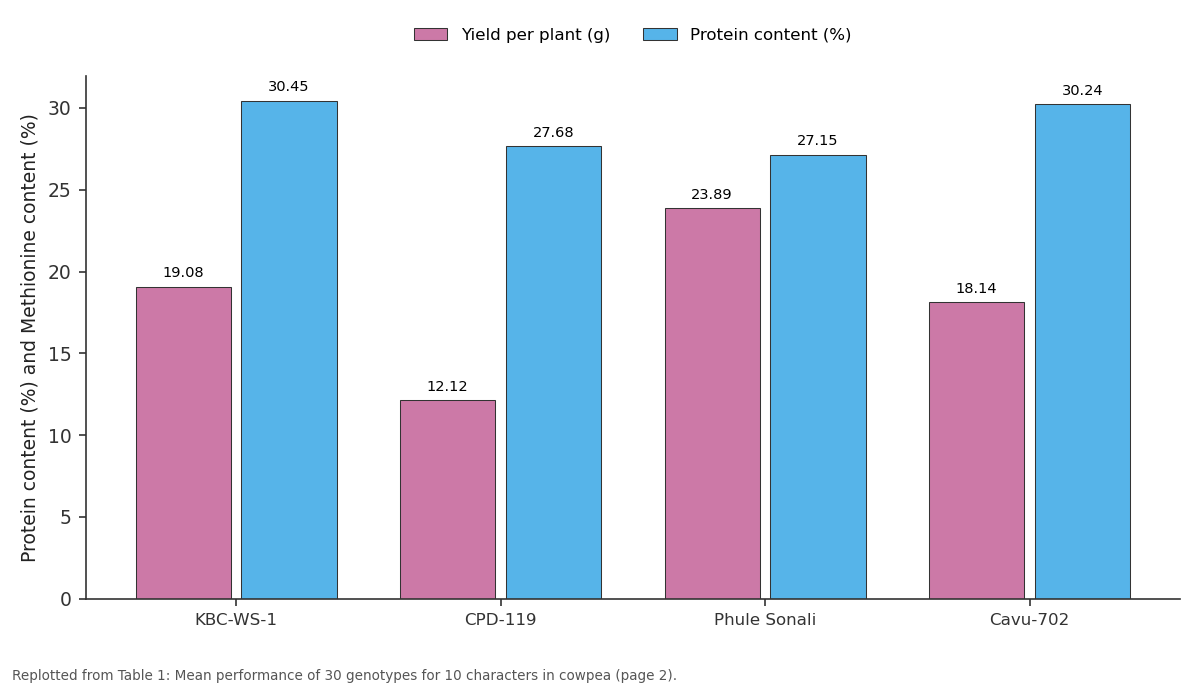
Yield per plant (g) and Protein content (%): KBC-WS-1 vs CPD-119 vs Phule Sonali vs Cavu-702
Replotted from Table 1 (page 2) of the original paper. Every bar is the paper's own table value.
View source evidence ↗Figures & tables
From the original paper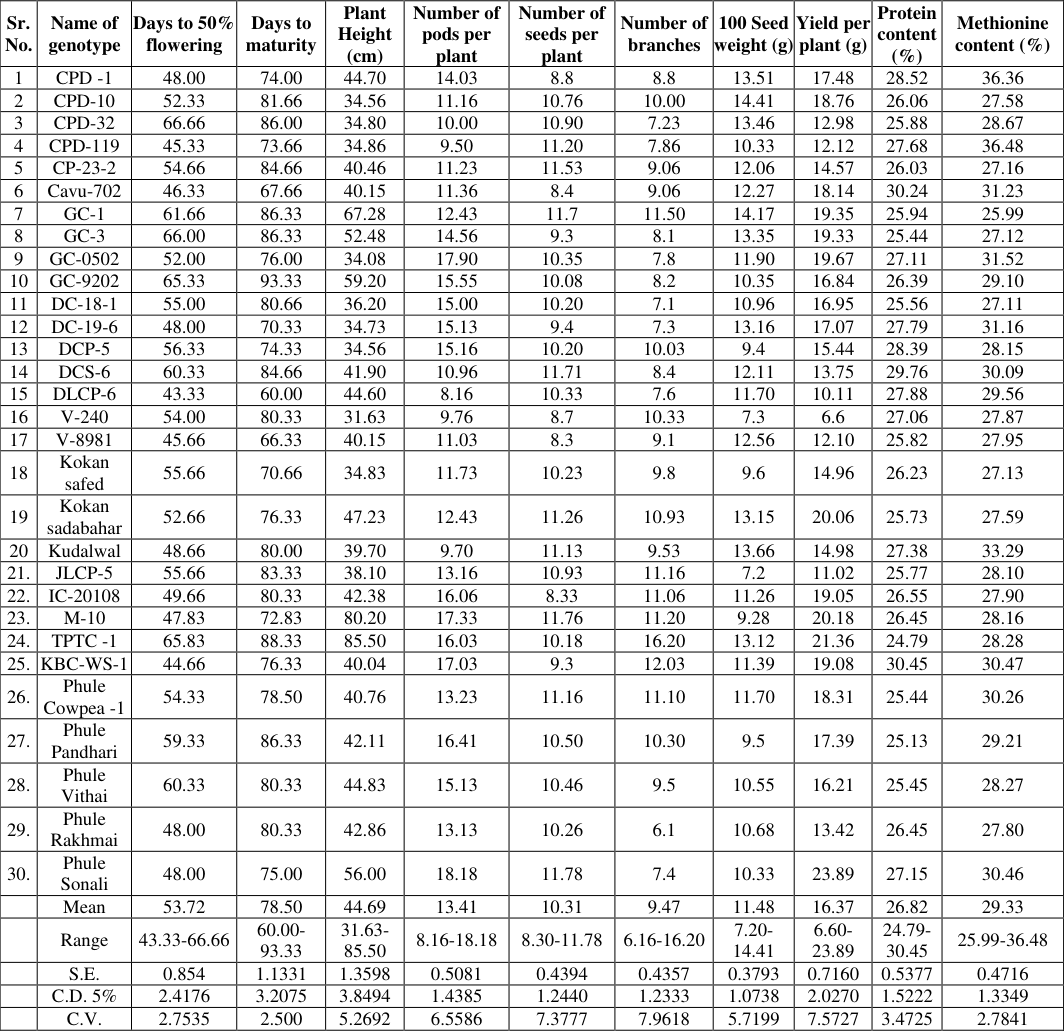 Table 1
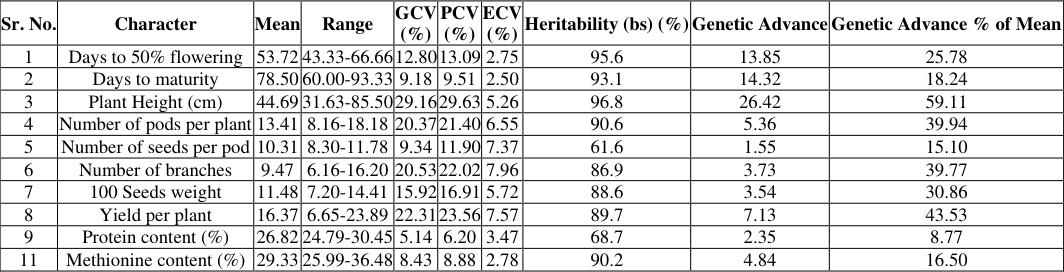 Table 2
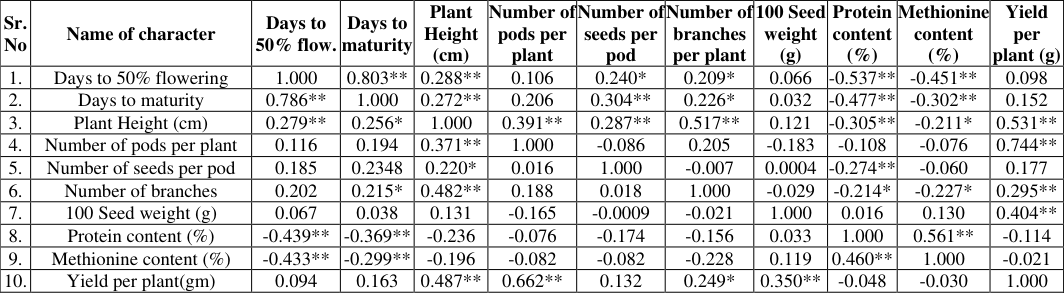 Table 3
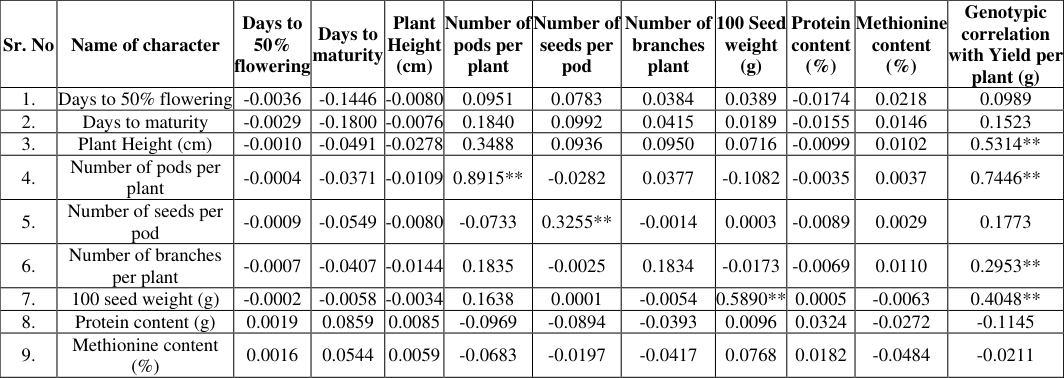 Table 4
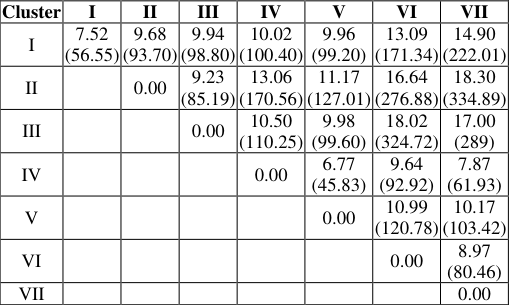 Table 5
Introduction
Cowpea (Vigna unguiculata L. Walp) is an important annual herbaceous crop from the genus Vigna legume crop cultivated widely in tropical and subtropical regions of world. It is a major source of dietary protein especially in vegetarian diets and play a crucial role in food security, soil enrichment through nitrogen fixation and climate resilience due to its drought tolerance and adaptability to marginal environments. In India, cowpea grown for both grain and fodder purposes and contributes significantly to the livelihood of smallholder farmers. A high level of morphological diversity is found within the species with large variation in size, shape and structure of the plant. Cowpea were domesticated in Africa and secondly found in Asia. Vigna unguiculata is a member of Vigna (Pea and beans) genus. Unguiculata is latin for "with a small claw", common names black eye pea, southern pea etc. belong to the Fabaceae family. Despite its importance, cowpea yield remains low and unstable due to limited genetic improvement, narrow genetic base and lack of systematic selection. Understanding the extent of genetic diversity is essential for crop improvement programs as it helps identify suitable parents for hybridization and selection strategies. Several studies have reported variability in cowpea using both morphological and molecular markers, however, comprehensive evaluations combining agronomic and nutritional traits such as protein and methionine content remains limited. Hence, assessing diversity using multiple traits can provide more reliable and useful information for breeding purposes. The present study was undertaken to evaluate thirty cowpea genotypes for genetic variability using key agronomic and nutritional traits. The study aims to estimate genetic parameters, Divergence among the genotypes play a vital role in cultivar improvement because, crosses involving genetically diverse parents likely to produce high heterotic effects and also more variability in segregating generations D 2 statistics is powerful tool for quantifying the divergence between two populations analyze clustering patterns and identify promising genotypes for future hybridization programs. This research contributes to developing a broader genetic base for cowpea improvement in Indian circumstances.
Materials and Methods
The experimental material consisted of 30 cowpea genotypes used in the study were collected from various agricultural research institutions, including RARI Durgapur, POCRTC Pandharpur, SDAU, SK, Nagar, UAS Dharwad, Dr. BSKKV Dapoli, RARS, ANGRAU, Tirupati evaluated at the Post Graduate Institute Rahuri, during the kharif season 2024. The trail was laid out in a randomized block design (RBD) with 3 replications. Standard cultural practices were followed throughout the growing season. The genotypes sown in two rows of each genotype of spacing 45 × 10 cm. The observations were recorded on five randomly selected plants from each treatment in each replication for 10 morphological, yield contributing along with quality parameters viz., Data was were recorded on days to 50% flowering, days to maturity, plant height (cm), number of branches per plant, number of pods per plant, number of seeds per pod, 100 seed weight, yield per plant, protein content and methionine content. The collected data were subjected to analysis of variance (ANOVA) and genetic parameters including genotypic and phenotypic coefficients of variation (GCV and PCV), heritability and genetic advance were computed. Genetic diversity was assessed using Mahalanobis D 2 statistics, cluster analysis, and principal component analysis (PCA). The correlation analysis was performed at both genotypic (above diagonal) and phenotypic (below diagonal) levels to understand the relationships among yield and its contributing traits in cowpea.
Result and discussion
Result and discussion
At the genotypic level, seed yield per plant exhibited a highly significant and positive correlation with: Number of pods per plant (r = 0.744**), Plant height (r = 0.487**),100Path coefficient analysis was carried out at the genotypic level to partition the correlation coefficients into direct and indirect effects, thereby providing insight into the true relationships between yield and its component traits in cowpea.
Direct Effects on Seed Yield
The highest positive direct effect on seed yield was observed for: Number of pods per plant (0.8915**),100 seed weight (0.5990**), Plant height (0.0278) These results indicate that these characters are the most important direct contributors to yield per plant. Improvement in these traits is likely to result in a significant increase in yield. Other traits such as days to maturity (0.1800) and number of branches per plant (0.1834) also showed positive but lower direct effects, suggesting their moderate contribution to yield.
Indirect Effects on
Indirect Effects on
Residual Effect
The residual effect was 0.219, indicating that the majority (around 78%) of the variability in seed yield was explained by the characters included in the analysis. This confirms the adequacy of the model. The path coefficient analysis clearly suggests that number of pods per plant, 100 seed weight, plant height, and number of branches per plant are the most promising characters for direct selection to improve seed yield in cowpea. These findings are in agreement with earlier correlation results and reinforce the importance of yield component traits in cowpea breeding strategies.
Conclusion
The present study revealed substantial genetic variability among thirty cowpea genotypes for key yield and yield contributing characters along with quality traits. High heritability combined with high genetic advance was observed for plant height, number of pods per plant and seed yield, indicating of predominance of additive gene action and potential for effective selection. Correlation and path coefficient analyses identified number of pods per plant, 100 seed weight and number of branches per plant as the most important contributors to seed yield both directly and indirectly. Among the genotypes, Phule sonali exhibited the highest seed yield (23.89 g/plant) and number of pods (18.18) while TPTC-1 recorded maximum plant height (85.50 cm) and CPD-32 showed maximum seeds per plant (13.06). The above genotypes show positively significant for yield and yield contributing characters viz., number of branches per plant, plant height and 100 seed weight. For quality traits, CPD-119 had the highest methionine content (36.48%) and GCP-6 highest protein content (30.65%). Genetic divergence analysis grouped genotypes into seven clusters, with the maximum inter-cluster distance between cluster II and VII, indicating wide genetic diversity.
Genotypes from this divergent clusters, especially high yielding and nutritionally rich types like Phule sonali, CPD-32, TPTC-1 and GCP-6, are ideal for use in hybridization programs to develop superior cowpea cultivars.
Figures and tables from the paper
| Sr. No. | Name of genotype | Days to 50% flowering | Days to maturity | Plant Height (cm) | Number of pods per plant | Number of seeds per plant | Number of branches | 100 Seed weight (g) | Yield per plant (g) | Protein content (%) | Methionine content (%) |
|---|---|---|---|---|---|---|---|---|---|---|---|
| 1 | CPD -1 | 48.00 | 74.00 | 44.70 | 14.03 | 8.8 | 8.8 | 13.51 | 17.48 | 28.52 | 36.36 |
| 2 | CPD-10 | 52.33 | 81.66 | 34.56 | 11.16 | 10.76 | 10.00 | 14.41 | 18.76 | 26.06 | 27.58 |
| 3 | CPD-32 | 66.66 | 86.00 | 34.80 | 10.00 | 10.90 | 7.23 | 13.46 | 12.98 | 25.88 | 28.67 |
| 4 | CPD-119 | 45.33 | 73.66 | 34.86 | 9.50 | 11.20 | 7.86 | 10.33 | 12.12 | 27.68 | 36.48 |
| 5 | CP-23-2 | 54.66 | 84.66 | 40.46 | 11.23 | 11.53 | 9.06 | 12.06 | 14.57 | 26.03 | 27.16 |
| 6 | Cavu-702 | 46.33 | 67.66 | 40.15 | 11.36 | 8.4 | 9.06 | 12.27 | 18.14 | 30.24 | 31.23 |
| 7 | GC-1 | 61.66 | 86.33 | 67.28 | 12.43 | 11.7 | 11.50 | 14.17 | 19.35 | 25.94 | 25.99 |
| 8 | GC-3 | 66.00 | 86.33 | 52.48 | 14.56 | 9.3 | 8.1 | 13.35 | 19.33 | 25.44 | 27.12 |
| 9 | GC-0502 | 52.00 | 76.00 | 34.08 | 17.90 | 10.35 | 7.8 | 11.90 | 19.67 | 27.11 | 31.52 |
| 10 | GC-9202 | 65.33 | 93.33 | 59.20 | 15.55 | 10.08 | 8.2 | 10.35 | 16.84 | 26.39 | 29.10 |
| 11 | DC-18-1 | 55.00 | 80.66 | 36.20 | 15.00 | 10.20 | 7.1 | 10.96 | 16.95 | 25.56 | 27.11 |
| 12 | DC-19-6 | 48.00 | 70.33 | 34.73 | 15.13 | 9.4 | 7.3 | 13.16 | 17.07 | 27.79 | 31.16 |
| 13 | DCP-5 | 56.33 | 74.33 | 34.56 | 15.16 | 10.20 | 10.03 | 9.4 | 15.44 | 28.39 | 28.15 |
| 14 | DCS-6 | 60.33 | 84.66 | 41.90 | 10.96 | 11.71 | 8.4 | 12.11 | 13.75 | 29.76 | 30.09 |
| 15 | DLCP-6 | 43.33 | 60.00 | 44.60 | 8.16 | 10.33 | 7.6 | 11.70 | 10.11 | 27.88 | 29.56 |
| 16 | V-240 | 54.00 | 80.33 | 31.63 | 9.76 | 8.7 | 10.33 | 7.3 | 6.6 | 27.06 | 27.87 |
| 17 | V-8981 | 45.66 | 66.33 | 40.15 | 11.03 | 8.3 | 9.1 | 12.56 | 12.10 | 25.82 | 27.95 |
| 18 | Kokan safed | 55.66 | 70.66 | 34.83 | 11.73 | 10.23 | 9.8 | 9.6 | 14.96 | 26.23 | 27.13 |
| 19 | Kokan sadabahar | 52.66 | 76.33 | 47.23 | 12.43 | 11.26 | 10.93 | 13.15 | 20.06 | 25.73 | 27.59 |
| 20 | Kudalwal | 48.66 | 80.00 | 39.70 | 9.70 | 11.13 | 9.53 | 13.66 | 14.98 | 27.38 | 33.29 |
| 21. | JLCP-5 | 55.66 | 83.33 | 38.10 | 13.16 | 10.93 | 11.16 | 7.2 | 11.02 | 25.77 | 28.10 |
| 22. | IC-20108 | 49.66 | 80.33 | 42.38 | 16.06 | 8.33 | 11.06 | 11.26 | 19.05 | 26.55 | 27.90 |
| 23. | M-10 | 47.83 | 72.83 | 80.20 | 17.33 | 11.76 | 11.20 | 9.28 | 20.18 | 26.45 | 28.16 |
| 24. | TPTC -1 | 65.83 | 88.33 | 85.50 | 16.03 | 10.18 | 16.20 | 13.12 | 21.36 | 24.79 | 28.28 |
| 25. | KBC-WS-1 | 44.66 | 76.33 | 40.04 | 17.03 | 9.3 | 12.03 | 11.39 | 19.08 | 30.45 | 30.47 |
| 26. | Phule Cowpea -1 | 54.33 | 78.50 | 40.76 | 13.23 | 11.16 | 11.10 | 11.70 | 18.31 | 25.44 | 30.26 |
| 27. | Phule Pandhari | 59.33 | 86.33 | 42.11 | 16.41 | 10.50 | 10.30 | 9.5 | 17.39 | 25.13 | 29.21 |
| 28. | Phule Vithai | 60.33 | 80.33 | 44.83 | 15.13 | 10.46 | 9.5 | 10.55 | 16.21 | 25.45 | 28.27 |
| 29. | Phule Rakhmai | 48.00 | 80.33 | 42.86 | 13.13 | 10.26 | 6.1 | 10.68 | 13.42 | 26.45 | 27.80 |
| 30. | Phule Sonali | 48.00 | 75.00 | 56.00 | 18.18 | 11.78 | 7.4 | 10.33 | 23.89 | 27.15 | 30.46 |
| Mean | 53.72 | 78.50 | 44.69 | 13.41 | 10.31 | 9.47 | 11.48 | 16.37 | 26.82 | 29.33 | |
| Range | 43.33-66.66 | 60.00- 93.33 | 31.63- 85.50 | 8.16-18.18 | 8.30-11.78 | 6.16-16.20 | 7.20- 14.41 | 6.60- 23.89 | 24.79- 30.45 | 25.99-36.48 | |
| S.E. | 0.854 | 1.1331 | 1.3598 | 0.5081 | 0.4394 | 0.4357 | 0.3793 | 0.7160 | 0.5377 | 0.4716 | |
| C.D. 5% | 2.4176 | 3.2075 | 3.8494 | 1.4385 | 1.2440 | 1.2333 | 1.0738 | 2.0270 | 1.5222 | 1.3349 | |
| C.V. | 2.7535 | 2.500 | 5.2692 | 6.5586 | 7.3777 | 7.9618 | 5.7199 | 7.5727 | 3.4725 | 2.7841 |
Table text extracted from the original PDF; superscript letters are shown inline. The original table image is below.
View original table image
| Sr. No. | Character | Mean | Range | GCV (%) | PCV (%) | ECV (%) | Heritability (bs) (%) | Genetic Advance | Genetic Advance % of Mean |
|---|---|---|---|---|---|---|---|---|---|
| 1 | Days to 50% flowering | 53.72 | 43.33-66.66 | 12.80 | 13.09 | 2.75 | 95.6 | 13.85 | 25.78 |
| 2 | Days to maturity | 78.50 | 60.00-93.33 | 9.18 | 9.51 | 2.50 | 93.1 | 14.32 | 18.24 |
| 3 | Plant Height (cm) | 44.69 | 31.63-85.50 | 29.16 | 29.63 | 5.26 | 96.8 | 26.42 | 59.11 |
| 4 | Number of pods per plant | 13.41 | 8.16-18.18 | 20.37 | 21.40 | 6.55 | 90.6 | 5.36 | 39.94 |
| 5 | Number of seeds per pod | 10.31 | 8.30-11.78 | 9.34 | 11.90 | 7.37 | 61.6 | 1.55 | 15.10 |
| 6 | Number of branches | 9.47 | 6.16-16.20 | 20.53 | 22.02 | 7.96 | 86.9 | 3.73 | 39.77 |
| 7 | 100 Seeds weight | 11.48 | 7.20-14.41 | 15.92 | 16.91 | 5.72 | 88.6 | 3.54 | 30.86 |
| 8 | Yield per plant | 16.37 | 6.65-23.89 | 22.31 | 23.56 | 7.57 | 89.7 | 7.13 | 43.53 |
| 9 | Protein content (%) | 26.82 | 24.79-30.45 | 5.14 | 6.20 | 3.47 | 68.7 | 2.35 | 8.77 |
| 11 | Methionine content (%) | 29.33 | 25.99-36.48 | 8.43 | 8.88 | 2.78 | 90.2 | 4.84 | 16.50 |
Table text extracted from the original PDF; superscript letters are shown inline. The original table image is below.
View original table image
| Sr. No | Name of character | Days to 50% flow. | Days to maturity | Plant Height (cm) | Number of pods per plant | Number of seeds per pod | Number of branches per plant | 100 Seed weight (g) | Protein content (%) | Methionine content (%) | Yield per plant (g) |
|---|---|---|---|---|---|---|---|---|---|---|---|
| 1. | Days to 50% flowering | 1.000 | 0.803** | 0.288** | 0.106 | 0.240* | 0.209* | 0.066 | -0.537** | -0.451** | 0.098 |
| 2. | Days to maturity | 0.786** | 1.000 | 0.272** | 0.206 | 0.304** | 0.226* | 0.032 | -0.477** | -0.302** | 0.152 |
| 3. | Plant Height (cm) | 0.279** | 0.256* | 1.000 | 0.391** | 0.287** | 0.517** | 0.121 | -0.305** | -0.211* | 0.531** |
| 4. | Number of pods per plant | 0.116 | 0.194 | 0.371** | 1.000 | -0.086 | 0.205 | -0.183 | -0.108 | -0.076 | 0.744** |
| 5. | Number of seeds per pod | 0.185 | 0.2348 | 0.220* | 0.016 | 1.000 | -0.007 | 0.0004 | -0.274** | -0.060 | 0.177 |
| 6. | Number of branches | 0.202 | 0.215* | 0.482** | 0.188 | 0.018 | 1.000 | -0.029 | -0.214* | -0.227* | 0.295** |
| 7. | 100 Seed weight (g) | 0.067 | 0.038 | 0.131 | -0.165 | -0.0009 | -0.021 | 1.000 | 0.016 | 0.130 | 0.404** |
| 8. | Protein content (%) | -0.439** | -0.369** | -0.236 | -0.076 | -0.174 | -0.156 | 0.033 | 1.000 | 0.561** | -0.114 |
| 9. | Methionine content (%) | -0.433** | -0.299** | -0.196 | -0.082 | -0.082 | -0.228 | 0.119 | 0.460** | 1.000 | -0.021 |
| 10. | Yield per plant(gm) | 0.094 | 0.163 | 0.487** | 0.662** | 0.132 | 0.249* | 0.350** | -0.048 | -0.030 | 1.000 |
Table text extracted from the original PDF; superscript letters are shown inline. The original table image is below.
View original table image
| Sr. No | Name of character | Days to 50% flowering | Days to maturity | Plant Height (cm) | Number of pods per plant | Number of seeds per pod | Number of branches plant | 100 Seed weight (g) | Protein content (%) | Methionine content (%) | Genotypic correlation with Yield per plant (g) |
|---|---|---|---|---|---|---|---|---|---|---|---|
| 1. | Days to 50% flowering | -0.0036 | -0.1446 | -0.0080 | 0.0951 | 0.0783 | 0.0384 | 0.0389 | -0.0174 | 0.0218 | 0.0989 |
| 2. | Days to maturity | -0.0029 | -0.1800 | -0.0076 | 0.1840 | 0.0992 | 0.0415 | 0.0189 | -0.0155 | 0.0146 | 0.1523 |
| 3. | Plant Height (cm) | -0.0010 | -0.0491 | -0.0278 | 0.3488 | 0.0936 | 0.0950 | 0.0716 | -0.0099 | 0.0102 | 0.5314** |
| 4. | Number of pods per plant | -0.0004 | -0.0371 | -0.0109 | 0.8915** | -0.0282 | 0.0377 | -0.1082 | -0.0035 | 0.0037 | 0.7446** |
| 5. | Number of seeds per pod | -0.0009 | -0.0549 | -0.0080 | -0.0733 | 0.3255** | -0.0014 | 0.0003 | -0.0089 | 0.0029 | 0.1773 |
| 6. | Number of branches per plant | -0.0007 | -0.0407 | -0.0144 | 0.1835 | -0.0025 | 0.1834 | -0.0173 | -0.0069 | 0.0110 | 0.2953** |
| 7. | 100 seed weight (g) | -0.0002 | -0.0058 | -0.0034 | 0.1638 | 0.0001 | -0.0054 | 0.5890** | 0.0005 | -0.0063 | 0.4048** |
| 8. | Protein content (g) | 0.0019 | 0.0859 | 0.0085 | -0.0969 | -0.0894 | -0.0393 | 0.0096 | 0.0324 | -0.0272 | -0.1145 |
| 9. | Methionine content (%) | 0.0016 | 0.0544 | 0.0059 | -0.0683 | -0.0197 | -0.0417 | 0.0768 | 0.0182 | -0.0484 | -0.0211 |
Table text extracted from the original PDF; superscript letters are shown inline. The original table image is below.
View original table image
| Cluster | I | II | III | IV | V | VI | VII |
|---|---|---|---|---|---|---|---|
| I | 7.52 (56.55) | 9.68 (93.70) | 9.94 (98.80) | 10.02 (100.40) | 9.96 (99.20) | 13.09 (171.34) | 14.90 (222.01) |
| II | 0.00 | 9.23 (85.19) | 13.06 (170.56) | 11.17 (127.01) | 16.64 (276.88) | 18.30 (334.89) | |
| III | 0.00 | 10.50 (110.25) | 9.98 (99.60) | 18.02 (324.72) | 17.00 (289) | ||
| IV | 0.00 | 6.77 (45.83) | 9.64 (92.92) | 7.87 (61.93) | |||
| V | 0.00 | 10.99 (120.78) | 10.17 (103.42) | ||||
| VI | 0.00 | 8.97 (80.46) | |||||
| VII | 0.00 |
Table text extracted from the original PDF; superscript letters are shown inline. The original table image is below.
View original table image
References
20 in the original paper- Somkuwar RG, et al. Evaluation of Cowpea Genotypes for Genetic Diversity. Indian J Genet. 2020;80(1):4550.
- Rao CR. Advanced Statistical Methods in Biometric Research. 1952.
- Dewey DR, Lu KH. A Correlation and Path Coefficient Analysis. Agron J. 1959;51(9):515-518.
- ICAR-NBPGR. Cowpea Germplasm Diversity Catalogue. National Bureau of Plant Genetic Resources; 2021.
- Singh B, Misra AK. Genetic variability and character association studies in cowpea (Vigna unguiculata L. Walp). Legume Res Int J. 2020;43(1):85-89.
- Kumar A, Meena ML, Meena HS. Genetic divergence analysis in cowpea [Vigna unguiculata (L.) Walp.] using Mahalanobis D² statistics. Electron J Plant Breed. 2021;12(1):201-6.
- Choudhary S, Patel DA. Path coefficient and correlation analysis in cowpea (Vigna unguiculata L. Walp). Int J Chem Stud. 2019;7(3):316-20.
- Aliyu B. Assessment of genetic diversity among cowpea genotypes using agro-morphological traits. Afr J Agric Res. 2022;17(2):185-192.
- Verma R, Yadav R. Studies on heritability and genetic advance in cowpea genotypes. J Pharmacogn Phytochem. 2023;12(4):1069-1072.
- Gupta R, Sharma D. Genetic parameters and variability in cowpea. Indian J Agric Sci. 2020;90(7):1254-1258.
- Tura I, Tesso T. Genetic diversity in cowpea genotypes using morphological traits. J Agric Res Dev. 2021;11(2):64-71.
- Sibara S, Jha A, Yadav H, Dixit S, Singh H, Ram S. Assessment of genetic diversity for qualitative and quantitative traits in pumpkin (Cucurbita moschata). Int. J. Adv. Biochem. Res. 2024;8(8):36-38.
- Okoye MN, Nwosu DJ. Multivariate analysis of genetic diversity in cowpea. Niger J Genet. 2020;34(1):89-97.
- Prasad M, Singh J. Character association and variability studies in cowpea. Agric Sci Dig. 2019;39(4):300-304.
- Yadav SS, Rao S. Evaluation of cowpea genotypes for yield and quality traits. J Food Legum. 2021;34(2):141145.
- Thakur A, Sharma P. Diversity analysis in cowpea using multivariate techniques. Int J Agric Sci. 2022;14(3):172-177.
- Murtadha AA, Mohammed I. Genetic variability and correlation in cowpea. Sci Res J Agric. 2020;8(2):95102.
- Solanki SS, Meena HR. Genetic variability in cowpea under arid conditions. J Arid Legum. 2021;19(1):33-39.
- Patel J, Desai S. Genetic divergence and character association studies in cowpea genotypes. Bioscan. 2023;18(2):117-122.
- Sinha R, Prasad V. Genetic variability and divergence in cowpea under rainfed conditions. Legume Genomics Genet. 2022;13(3):23-29.
Cited by 2
From OpenAlex, OpenCitations and reference lists read by Scinovex
- Research Article Genetic diversity in cowpea landraces analyzed by ISSR markers ↗
Linda Brenna Ribeiro Araújo, LEONARDO B.C. FIEGE, A.V.A Silva, Cândida Hermínia Campos de Magalhães Bertini · Genetics and Molecular Research · 2019
The cowpea, Vigna unguiculata (Fabeaceae) is widely cultivated in semi-arid regions, such as northeast Brazil.Due to the low crop yields in this region, it would be useful to develop cultivars adapted to these climate conditions.Landraces are seen as an important source of germplasm to be used in breeding programs of this species due to their good adaptation to the environment,…
❝ 6PDF - Simple Sequence Repeats Marker based Detection of Genetic Diversity of Indian Bean Dolichos lablab (L.) of Family Fabaceae ↗
Vishwajeet Singh, Rajdeep Kudesia, Seema Bhadauria · Legume Research - An International Journal · 2021
Background: Assessment and molecular characterization of genetic diversity among the Dolichos lablab (L.) have huge implication in scheming strategies for breeding. In India, there is less comprehensive information on the potential genetic diversity of lablab bean and this is a major challenge for systematic use of lablab bean in genetic breeding programs. To exploit the available trait of interest, the…
❝ 2PDF