
Research article · 2025 · Full text
International Journal of Agriculture and Food ScienceSupplementation of green coffee bean powder in sev - its nutritional, organoleptic and shelf life evaluation
Volume 7(7) · Pages 117–123 · DOI: 10.33545/2664844x.2025.v7.i7b.504 ↗
Research areasCoffee research and impacts
Abstract
Author-writtenScientific researches have disclosed that components present in green coffee play important preventive role against various degenerative diseases. Green coffee beans (GCB), in particular, are characterized by its unique composition and properties that are beneficial for good health. The objective of this work was to investigate the impact of green coffee beans (Coffea arabica) in addition on the quality and antioxidant properties of the sev. For sev preparation, Bengal gram flour and GCB were used. Bengal gram flour was replaced with GCB flour at 5, 10, 15 and upto 20% levels. Colour, texture, taste, aroma and sensory properties of sev were determined. Mineral and vitamin were assessed. Furthermore, total phenolic content was evaluated. The results showed that sev supplementation with GCB had positive influence on sensory parameters. Sev incorporated with 15% of green coffee bean powder had maximum acceptability. The mineral and vitamin present in sev has increased significantly as a result of the GCB addition. The addition of GCB significantly enriched sev with phenolic compounds. However supplementation of GBC has decreased peroxide value significantly when compared with control representing better storage quality. Moreover, the GCB addition enhanced the nutritional quality and shelf life sev.
Summary
Source-checkedPlain-language reading of the full paper, prepared with AI and checked against the text. Each point links to the authors' own words.
Why it matters
- Green coffee contains components that may help prevent various degenerative diseases. View evidence ↗
- The health benefits of green coffee are primarily attributed to its antioxidant phenolic compounds, particularly chlorogenic acids. View evidence ↗
The question
- The study aimed to investigate how adding green coffee beans (GCB) affects the nutritional quality, antioxidant properties, and shelf life of sev. View evidence ↗
What they did
- The researchers prepared five types of sev: a control (100% bengal gram flour) and four supplemented versions where flour was replaced by GCB powder at levels of 5%, 10%, 15%, and 20%. View evidence ↗
- The sev were produced at the Food Laboratory in BPSIHL of BPS Women University in Sonipat. View evidence ↗
- Data were analyzed using ANOVA, with a p-value of ≤0.05 used to determine statistical significance. View evidence ↗
What they found
- Fat acidity was lower in GCB-supplemented sev than in the control, with the 20% group showing 5.78 mg KOH/100g compared to 6.75 mg KOH/100g in the control after 90 days. View evidence ↗
What it means
- The authors conclude that adding green coffee beans significantly improves the nutritional properties of sev by increasing its antioxidant and phenolic content. View evidence ↗
- The authors state that further research is required to fully estimate the health benefits of products value-added with green coffee beans. View evidence ↗
Visual summary
2 visualsIllustrations explain the paper; charts are replotted from the paper's own table values.
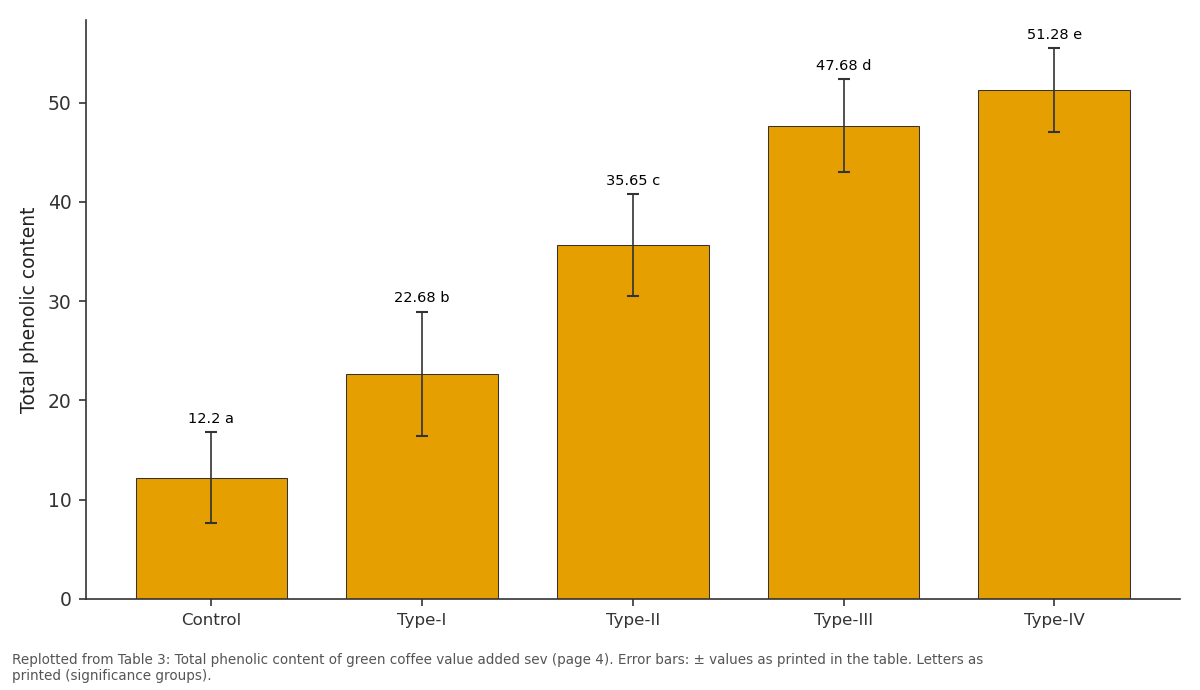
Sev: Control vs Type-I vs Type-II vs Type-III vs Type-IV
Replotted from Table 3 (page 4) of the original paper. Every bar is the paper's own table value.
View source evidence ↗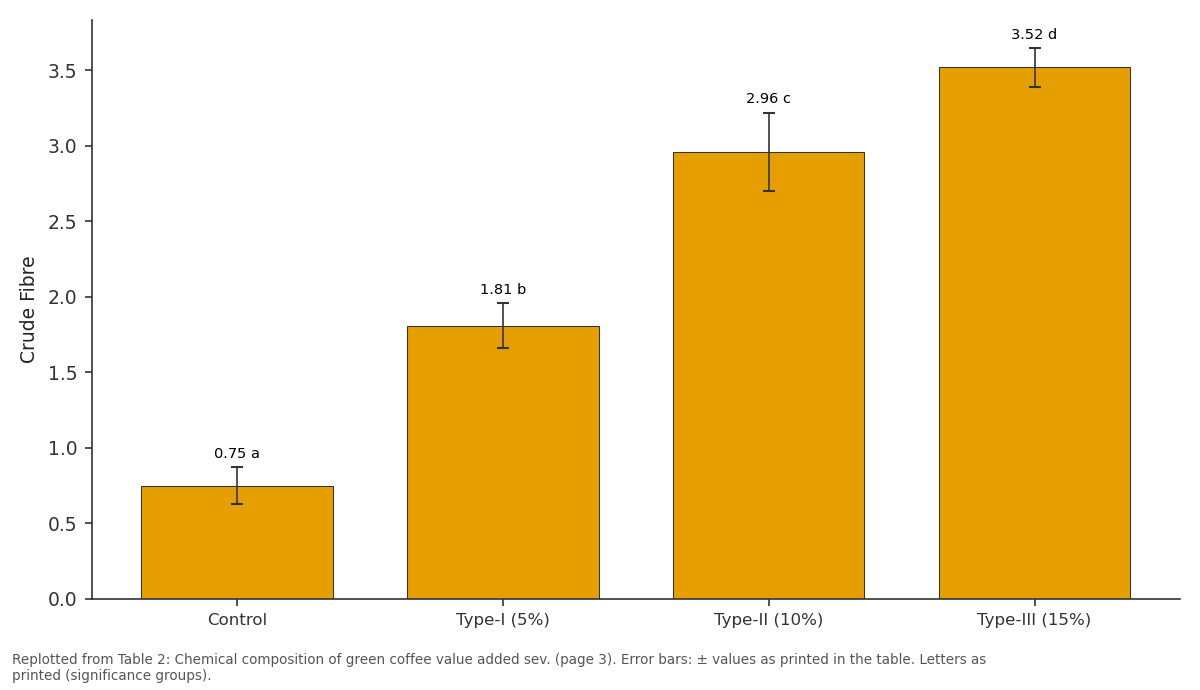
Crude Fibre: Control vs Type-I (5%) vs Type-II (10%) vs Type-III (15%)
Replotted from Table 2 (page 3) of the original paper. Every bar is the paper's own table value.
View source evidence ↗Figures & tables
From the original paper Table 1
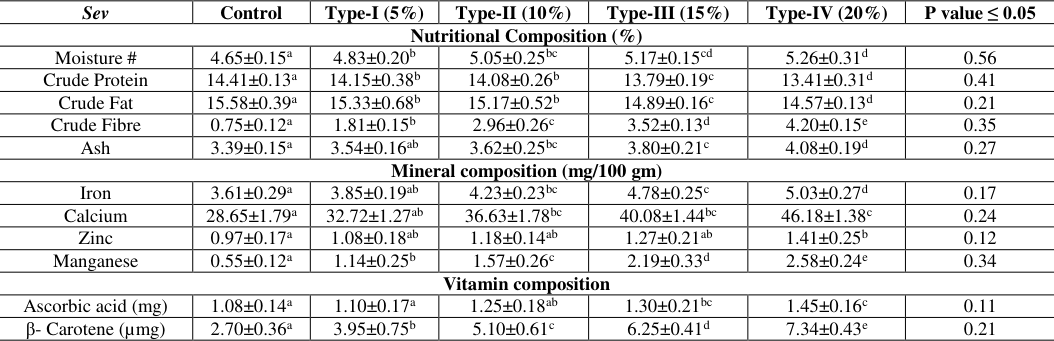 Table 2
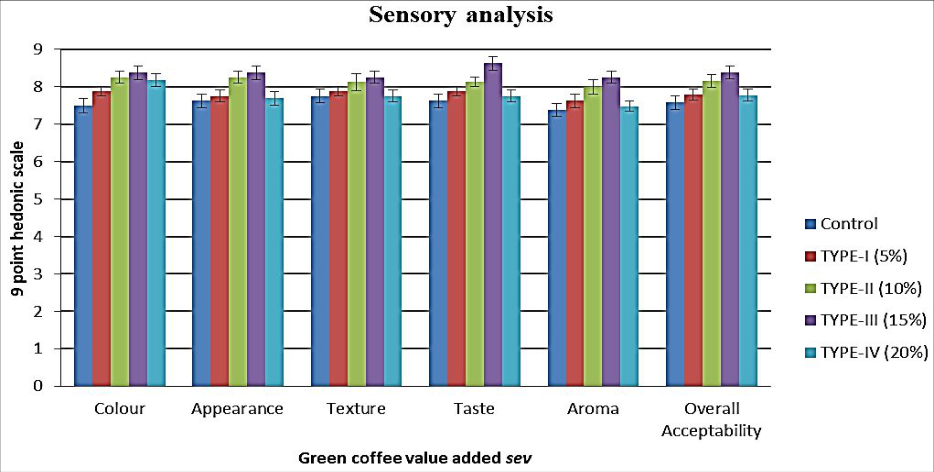 Figure 1
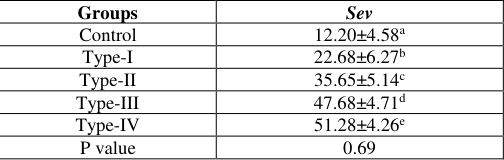 Table 3
 Table 4
 Table 5
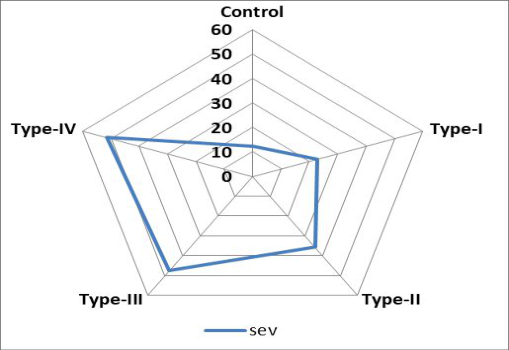 Figure 2
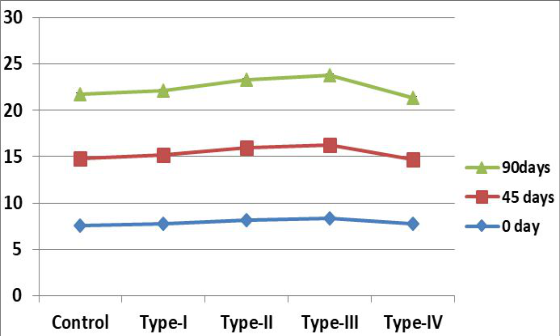 Figure 3
 Table 6
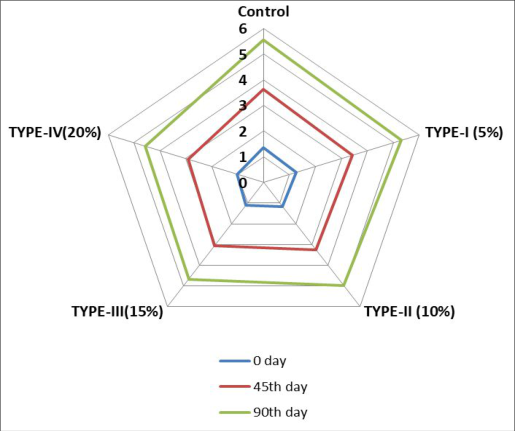 Figure 4
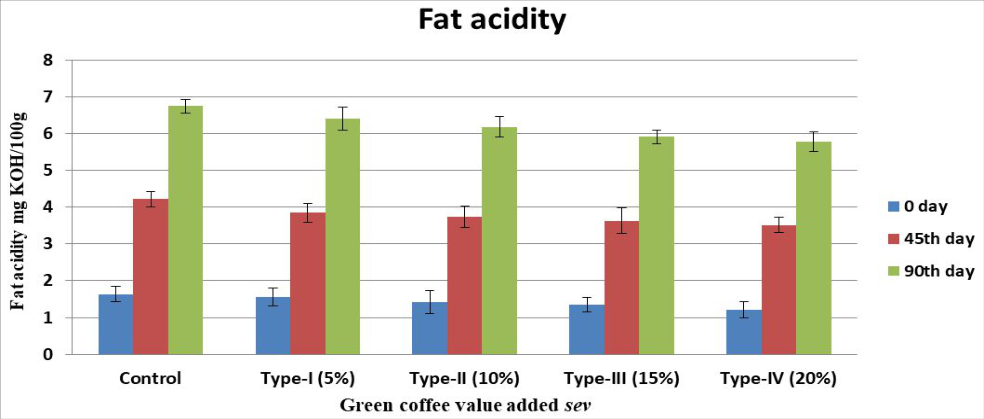 Figure 5
Introduction
Green coffee beans have a very complex matrix of many compounds which can interact with the human body and is beneficial for human health, e.g. improving body antioxidant activity and stimulating the neural system. Many more research reported the health benefits of coffee consumption, ranging from enhancing mental performance to fighting cardiovascular disorders, carcinoma and diabetes, which mainly contribute to the rising global coffee demand (Lim et al., 2012; Qi and Li, 2014; De Oliveira et al., 2016) [10,12,7] . During past few decades, coffee consumption was also shown to be helpful in reducing a risk of social disease, such as Parkinson, diabetes type II, and Alzheimer diseases (Chu, 2012) [10] . Presently after COVID-19 because of a pro-health and pro healing status of antioxidant rich products, another coffee beverage has begun to enjoy a great popularity -mainly infusion, prepared using raw and unroasted green coffee beans. Green coffee is also believed to accelerate metabolism and therefore it can be helpful in reducing weight and preventing overcoming obesity (Stelmach et al., 2015) [17] . Physiological studies made on mice suggest that a green coffee bean extract could be an effective fat absorption inhibitor and a suppressor of its metabolism in liver (Shimoda, et al., 2006) [14] . It has been recognized that benefits of consuming green coffee are mainly related due to the presence of phenolic compounds in it, especially chlorogenic acids, which exhibits an antioxidant activity (Suzuki et al., 2002) [18] . Green coffee beans (GCB) have a mild, green, bean-like aroma; the characteristic aroma of coffee manly develops during the roasting process. The main constituents of GCB are carbohydrates, soluble (galactomannan, arabinogallactan), and insoluble (cellulose), phenolic species, polysaccharides, proteins, polyphenols, melanoids, lipids, and minerals (Stelmach et al., 2015) [17] . Green coffee beans are rich in phenolic acids, especially in chlorogenic acid, and its related compounds that show hypotensive effects (Shimoda et al., 2006) [14] . Chlorogenic and caffeic acids, the main phenolics of green coffee, exhibit antimutagenic, anticarcinogenic and antioxidant activities in vitro, which are linked with the ability to scavenge reactive oxygen species. Additionally, these compounds have been suggested as inhibitors of inflammation and tumor promotion via deactivation of a range of pro-oxidative enzymes such as lipoxygenase -a key enzyme of the arachidonic acid metabolism (Gawlik-Dziki et al., 2013) [9] . During roasting process, there is a progressive destruction and transformation of chlorogenic acids with 8-10% (Clifford, 1999) [5] . Hence, GCB seem to be a better source of these compounds. A few studies have been conducted regarding food supplementation by GCB addition. Our recent study showed that powdered GCB may be used directly, without extract preparation, for sev supplementation obtained from Bengal gram flour. The aim of the present study was to examine the influence of GCB on the nutrition quality and shelf life of sev.
Materials and methods
Materials and methods
Preparation of sev
Green coffee beans were purchased online and grounded and sieved. Green coffee bean powder obtained from grinding was used to make sev. In this study green coffee bean powder and black gram flour was used in the ratio 5:95 (Type-I), 10:90 (Type-II), 15:85 (Type-III), 20:80(Type-IV) and prepared a control sev using 100% bengal gram flour. The sev were developed at Food Laboratory in BPSIHL of BPS Women University, Khanpur Kalan Sonipat. To prepare the sev the dough was prepared using bengal gram flour, green coffee bean powder, salt, cooking oil and water mixed to a homogenous mass. The sev were made using sev making machine by frying in cooking oil. Once fried, the sev were cooled to room temperature and stored in air tight container.
Ingredients
All samples control, Type-I, Type-II, Type-III & Type-IV were pre-dried in an oven for 24 h at 60 0 C, and used for in subsequent analysis. For analysis of total phenolic content, extract were prepared using 5.5% (w/v)of the sample in contact for 5 min with water at 93 0 C (SCAA Protocol).
Analysis of chemical composition
To determine the chemical composition: the moisture content was determined in an oven at 105 ºC until a constant weight was obtained (Viroli et al., 2008) [19] the ash content was determined through muffle furnace incineration at 550 °C for 4 h or until the ash was completely white (SCAA Protocol). The lipids or fat were determined through hot ether extraction in Soxhlet (SCAA Protocol). The proteins were determined using the Kjeldahl method, which was based on the determination of nitrogen and multiplication by the conversion factor (6.25) of nitrogen into protein (Viroli et al., 2008) [19] the total dietary fiber was determined using the enzymatic gravimetric method (Asp et al., 1983) [2] . Vitamin were estimated by acid digestion, sample were determined by Atomic Absorption Spectrophotometer standard method (Lindsey and Norwell, 1969) [11] . Vitamins: Ascorbic acid and β-carotene in the sample were estimated by applying the standard method of analysis given by AOAC (2000). Peroxide value of sorted product at 0, 45 and 90 days were estimated by the method proposed by AOAC (2000).
Analysis of total phenolic compounds
Phenolic compounds were analyzed using the Folin-Ciocalteu method with gallic acid as the analytical standard and spectrophotometric absorbance measurement at 770 nm (Singleton et al., 1999) [15] . The extract aliquot (600 µL) of the diluted sample (1:50 (v/v)) was transferred to a 15 mL Falcon® tube with 3000 µL of 10% (v/v) Folin-Ciocalteu reagent. After 5 min, 2250 µL of 7.5% potassium carbonate solution (w/v) was added. The mixture was stored at room temperature and protected from light for 40 min for subsequent spectrophotometric measurements. In the quantification of total phenolic compounds, the calibration curve was constructed based on the gallic acid standard, with known concentrations, in triplicate, and a linear response was observed in the range of 0.50-40.0 mg L-1 of gallic acid and described by the following equation: A=0.0018+0.0115 C (mg L-1).
Statistical analysis
The content of the investigated compounds (colour, appearance, texture, taste, aroma, overall acceptability, moisture, ash, crude fat, crude proteins, crude fibre, vitamin, mineral, peroxide value and total phenolic compounds) was calculated. The results were statistically analyzed using analysis of variance (ANOVA) values with p≤0.05 were considered statistically significant. The analyses were performed and the results are expressed as the mean±standard deviation.
Result and discussion
Sev prepared using variable percentage of green coffee beans were examine and evaluated at various parameters for judging its acceptance, proximate composition nutritional quality, phenolic content, fat acidity and its keeping quality are as follows.
Sensory evaluation
The mean score of colour, appearance, texture, taste, aroma and overall acceptability of control on day 0 was 1 & Figure 1). It was concluded that on addition of 5%, 10%, 15% the mean score increase after adding green coffee bean powder but it decrease as it was increased upto 20%. The Judges liked the green coffee bean incorporated sev due to its attribute like colour, appearance, texture, taste and, Type-III product was the most liked and acceptable product among all groups. .43 e 0.21 Values are mean ±SE of three independent determinants # As is basis, Values with same superscripts in a column do not differ significantly CD (P≤0.05) Control = 100% BGF Type-I= 95% BGF + 5% GCBP Type-II= 90% BGF + 10% GCBP Type-III= 85% BGF + 15% GCBP Type-IV= 80% BGF + 20% GCBP, Control = 100% BGF, Type-I= 95% BGF + 5% GCBP, Type-II= 90% BGF + 10% GCBP, Type-III= 85% BGF + 15% GCBP, Type-IV= 80% BGF + 20% GCBP Following the addition of green coffee beans, the chemical composition was determined (Table no. 2). Compared to the control group, nutritional profile of the green coffee-based sev had low percentage of crude fat but higher percentage of moisture, ash, crude protein and crude fibre, and the nutritional value improved proportionately to the amount of green coffee beans. Incorporation of green coffee also increased the mineral and vitamin composition i.e. iron, calcium, zinc & manganese and ascorbic acid & β-Carotene.
Chemical composition
Chemical composition
Total phenolic content
Total phenolic content (TPC) in sev ranges from 12.20 to 51.28 g GAE (Gallic Acid Equivalent)/100 gm. It was highest recorded in type IV i.e. 51.28 mg GAE/100 gm and it also differ significantly with control and rest of the treatment groups (Table no
Effect of storage on over all acceptability:
The Green coffee bean base sev were packed in air tight container and then stored at room temperature for another 90 days. The sev were also evaluated for sensory characteristic using 9point hedonic scale on 45 th and 90 th day. The overall acceptability of sev was higher on day 0 then on 45 th day followed by 90 th day depicted in table no. 4 and figure no 3. Fat acidity The prepared green coffee sev were assessed for chemical analysis to evaluate the fat acidity and result is being depicted in table 8 & figure 8. Fat acidity: The fat acidity content of control sev on 0 day was 1.63 mg KOH/100 g while it was slightly lesser in all the four cases of supplemented sev as 5%, 10%, 15% & 20% supplemented sev contained i.e. 1.56, to 1.42, 1.35 & 1.21 mg KOH/100 g fat acidity respectively. Control, 5%, 10%, 15% and 20% of 4.22 mg KOH/100 g, to 3.85, to 3.75, 3.63 and 3.51 mg KOH/100 g respectively on 45 th day of storage. On 90 th day, the fat acidity content of control sev was 6.75 mg KOH/100 g while it was slightly lesser in all the four cases of green coffee supplemented sev as 5%, 10%, 15% and 20% supplemented sev contained 6.75 to, 6.41, 5.91 and 5.78 mg KOH/100 g fat acidity respectively. In the control samples of sev the fat acidity value was higher but after the incorporation of green coffee the value of fat acidity decreases. [6] reported that addition of green coffee beans in bread enhanced antioxidant and antimicrobial properties in GCB incorporated formulations compared to Control. The sensory evaluation showed an enhanced appearance and aroma in treatment groups as compared to others. Overall treatment group showed better physicochemical, biological, and sensory properties than the other formulations. Zain et al. (2018) [20] investigation shows that the benefits of adding different concentrations of grounded green coffee beans (GCB) powder (3%, 5% and 7%) to wheat flour dough prior to baking at 220 °C for 30 min compared to control (0% of GCB) and commercially available bread. Sample was analyzed for total phenolic content (TPC), antioxidant activates (DPPH radical scavenging activity (IC50) and ferrous ion chelating (FIC) ability) and organoleptic properties. The highest TPC was observed in 7% GCB bread (1.61 ± 0.06 mg GAE/g) which also recorded the highest DPPH (2.80 ± 0.06 mg/ml; IC50) and FIC (0.49 ± 0.01 mg EDTA/g). GCB bread (3%) showed the highest organoleptic scores among the GCB bread. In conclusion, GCB may be used in formulating functional bread which impacts high antioxidant content. Budryn, G., & Nebesny, E. (2013) [3] used two extracts with high antioxidant activity were obtained from green and roasted Robusta coffee. These extracts were added (in concentrations of 0.1, 0.5 and 1%) to popular sweets rich in fat and susceptible to oxidation, such as cookies and chocolates. The extent of oxidation of the samples supplemented with antioxidants and their traditional counterparts was compared. The tested samples were stored for 12 weeks and analyzed in terms of physicochemical quality, sensory properties and texture. It was found that supplementation with the coffee extracts limited oxidative changes of fat in the stored confectionery products. It also had beneficial impact on sensory characteristics of the chocolates. The observed increase in the acid value of the fat both in cookies and chocolates did not give rise to the acidic or rancid taste. The most favourable effects were observed when the concentration of the extracts was 0.5%. Desai et al. (2020) [8] reported that green coffee spent (GCS) as a food ingredient and its application in food products. About 70% of GCS was obtained after processing green coffee for Chlorogenic acid. The cookies fortified with roasted green coffee spent (RGCS) and unroasted green coffee spent (UGCS) were evaluated for physicochemical properties and food safety.The cookies formulations of RGCS had better sensory attributes such as colour and aroma. Thus, RGCS enriched with prebiotic oligosaccharide represent novel functional food supplement. Aguilar et al. (2019) [1] found that intensity of specific sensory characteristics in cookies added with SCG was evaluated by 131 consumers using the just-about-right scale. Texture characteristics were not affected by SCG content. Crude fibre, fat, ash and TPC content increased with the increment of SCG in cookies (p<.01). All the cookies added with SCG were pleasant for consumers, although cookies with 17.5 g SCG /100 g were preferred (p<.05). Intensity of coffee flavour and granulosity seemed to determine its acceptance. Adding 17.5 and 25.0 g SCG/100 g in cookies allows obtaining a product acceptable for consumers, considered as dietary fibre source. The effects of adding varying amounts (0%, 1.5%, 3%, 6%, and 12%) of the medium roasted coffee powder on the quality characteristics of rice cookies, which were prepared without wheat flour, were studied. Antioxidant activity of cookies increased with the increase in the amount of coffee powder. Antioxidant activity of the cookies added with 3% coffee powder was significantly higher than that of the cookies added with 1.5% coffee powder. As results of the sensory evaluation, the intensity of darkness, smell, bitterness, hardness of the cookies tended to increase with the increase in the amount of coffee powder. The overall acceptability of the cookies was significantly higher for the cookies containing 1.5~3% coffee powder than for the other samples. These results suggested that coffee powder (approximately 3%) can be utilized as an additive for preparing rice cookies which have simultaneously high antioxidant activity and acceptability (Seong et al., 2014) [13] .
Conclusion
The addition of Green coffee beans can significantly increase the nutritional properties of product by increasing the phenolic content and antioxidant properties compared to control product. Increasing amount of GCB addition resulted in increased phenolic content and antioxidant activity in value added sev. Thus, the present results can be further helpful in the formulation of other value added products which contains high antioxidant values. This can be important in bread as its staple food in many countries and this can be highly game changer for those who are highly health cautious. The green coffee beans products are not only targeting the whole population but also to the consumers who believe in the benefit of merging 'traditional' with pro-health food. In present scenario mainly in metro cities people are having very busy lifestyle and as sitting time of persons has increased a lot due to which physical activities have reduced drastically and specially after COVID-19 people are mainly focusing on healthy food products which are beneficial and good for health and they are certainly helpful in reducing a risk of social disease, so green coffee can be the one of them as it helps in regulating diabetes, blood pressure, prevents cardiovascular disease, obesity etc further more study is needed to estimate the health benefits of green coffee beans value added products.
Figures and tables from the paper
| Groups | Colour | Appearance | Texture | Taste | Aroma | Overall Acceptability |
|---|---|---|---|---|---|---|
| Control | 7.50±0.19a | 7.63±0.18a | 7.75±0.18a | 7.63±0.18a | 7.38±0.18a | 7.58±0.18a |
| TYPE-I (5%) | 7.88±0.13ab | 7.75±0.16a | 7.88±0.13a | 7.88±0.13a | 7.63±0.18a | 7.80±0.15ab |
| TYPE-II (10%) | 8.25±0.16b | 8.25±0.16ab | 8.13±0.23ab | 8.13±0.13ab | 8.00±0.19ab | 8.15±0.17b |
| TYPE-III (15%) | 8.38±0.18b | 8.38±0.18b | 8.25±0.16b | 8.63±0.18b | 8.25±0.16b | 8.38±0.17c |
| TYPE-IV (20%) | 8.18±0.18ab | 7.69±0.18a | 7.75±0.16a | 7.75±0.16a | 7.48±0.13a | 7.77±0.16a |
| P value ≤ 0.05 | 0.32 | 0.61 | 0.44 | 0.54 | 0.28 | 0.37 |
Table text extracted from the original PDF; superscript letters are shown inline. The original table image is below.
View original table image
| Sev | Control | Type-I (5%) | Type-II (10%) | Type-III (15%) | Type-IV (20%) | P value ≤ 0.05 |
|---|---|---|---|---|---|---|
| Nutritional Composition (%) | ||||||
| Moisture # | 4.65±0.15a | 4.83±0.20b | 5.05±0.25bc | 5.17±0.15cd | 5.26±0.31d | 0.56 |
| Crude Protein | 14.41±0.13a | 14.15±0.38b | 14.08±0.26b | 13.79±0.19c | 13.41±0.31d | 0.41 |
| Crude Fat | 15.58±0.39a | 15.33±0.68b | 15.17±0.52b | 14.89±0.16c | 14.57±0.13d | 0.21 |
| Crude Fibre | 0.75±0.12a | 1.81±0.15b | 2.96±0.26c | 3.52±0.13d | 4.20±0.15e | 0.35 |
| Ash | 3.39±0.15a | 3.54±0.16ab | 3.62±0.25bc | 3.80±0.21c | 4.08±0.19d | 0.27 |
| Mineral composition (mg/100 gm) | ||||||
| Iron | 3.61±0.29a | 3.85±0.19ab | 4.23±0.23bc | 4.78±0.25c | 5.03±0.27d | 0.17 |
| Calcium | 28.65±1.79a | 32.72±1.27ab | 36.63±1.78bc | 40.08±1.44bc | 46.18±1.38c | 0.24 |
| Zinc | 0.97±0.17a | 1.08±0.18ab | 1.18±0.14ab | 1.27±0.21ab | 1.41±0.25b | 0.12 |
| Manganese | 0.55±0.12a | 1.14±0.25b | 1.57±0.26c | 2.19±0.33d | 2.58±0.24e | 0.34 |
| Vitamin composition | ||||||
| Ascorbic acid (mg) | 1.08±0.14a | 1.10±0.17a | 1.25±0.18ab | 1.30±0.21bc | 1.45±0.16c | 0.11 |
| β- Carotene (µmg) | 2.70±0.36a | 3.95±0.75b | 5.10±0.61c | 6.25±0.41d | 7.34±0.43e | 0.21 |
Table text extracted from the original PDF; superscript letters are shown inline. The original table image is below.
View original table image
| Groups | Sev |
|---|---|
| Control | 12.20±4.58a |
| Type-I | 22.68±6.27b |
| Type-II | 35.65±5.14c |
| Type-III | 47.68±4.71d |
| Type-IV | 51.28±4.26e |
| P value | 0.69 |
Table text extracted from the original PDF; superscript letters are shown inline. The original table image is below.
View original table image
| Groups | Control | Type-I | Type-II | Type-III | Type-IV |
|---|---|---|---|---|---|
| 0 day | 7.58±0.18a | 7.80±0.15a | 8.15±0.17a | 8.38±0.17a | 7.77±0.16a |
| 45 days | 7.25±0.18ab | 7.35±0.21a | 7.78±0.18ab | 7.93±0.18ab | 6.95±0.16ab |
| 90days | 6.88±0.16b | 7.00±0.20b | 7.35±0.18b | 7.50±0.18b | 6.60±0.20a |
Table text extracted from the original PDF; superscript letters are shown inline. The original table image is below.
View original table image
| Groups | 0 day | 45 day | 90 days |
|---|---|---|---|
| Control | 1.36±0.03a | 3.64±0.03a | 5.56±0.07a |
| Type- I | 1.25±0.01b | 3.42±0.05b | 5.30±0.12b |
| Type- II | 1.18±0.00bc | 3.25±0.03c | 4.97±0.06c |
| Type -III | 1.11±0.03cd | 3.07±0.10d | 4.77±0.08c |
| Type -IV | 1.02±0.08d | 2.91±0.04d | 4.52±0.07d |
| P value | 0.02 | 0.17 | 0.34 |
Table text extracted from the original PDF; superscript letters are shown inline. The original table image is below.
View original table image
| Groups | 0 day | 45th day | 90th day |
|---|---|---|---|
| Control | 1.63+0.21a | 4.22+0.21a | 6.75+0.19a |
| Type-I (5%) | 1.56+0.24a | 3.85+0.25a | 6.41+0.31a |
| Type-II (10%) | 1.42+0.31ab | 3.75+0.29a | 6.18+0.28b |
| Type-III (15%) | 1.35+0.19b | 3.63+0.35ab | 5.91+0.18b |
| Type-IV (20%) | 1.21+0.23c | 3.51+0.21b | 5.78+0.26c |
| P value ≤ 0.05 | 0.21 | 0.35 | 0.29 |
Table text extracted from the original PDF; superscript letters are shown inline. The original table image is below.
View original table image
References
20 in the original paper- Aguilar-Raymundo VG, Sanchez-Paez R, Gutierrez-Salomon AL, Barajas-Ramirez JA. Spent coffee grounds cookies: Sensory and texture characteristics, proximate composition, antioxidant activity, and total phenolic content. J Food Process Preserv. 2019;43(12):e14223.
- Asp NG, Johansson CG, Hallmer H, Siljestroem M. Rapid enzymic assay of insoluble and soluble dietary fiber. J Agric Food Chem. 1983;31(3):476-482.
- Budryn G, Nebesny E. Effect of green and roasted coffee antioxidants on quality and shelf life of cookies and chocolates. J Food Process Preserv. 2013;37(5):835-845.
- Chu YF. Coffee: Emerging health effects and disease prevention. 1st ed. Oxford: Wiley Blackwell; 2012. p. 352.
- Clifford MN. Chlorogenic acids and other cinnamates: nature, occurrence and dietary burden. J Sci Food Agric. 1999;79:362-372.
- Das R, Banerjee D, Sahu D, Tanveer J, Banerjee S, Jarzębski M, et al. Evaluating the impact of green coffee bean powder on the quality of whole wheat bread: A comprehensive analysis. Foods. 2024;13(17):2705.
- De Oliveira LAB, Pacheco HP, Scherer R. Flutriafol and pyraclostrobin residues in Brazilian green coffees. Food Chem. 2016;190:60-63.
- Desai NM, Mallik B, Sakhare SD, Murthy PS. Prebiotic oligosaccharide enriched green coffee spent cookies and their nutritional, physicochemical and sensory properties. LWT. 2020;134:109924.
- Gawlik-Dziki U, Swieca M, Sułkowski M, Dziki D, Baraniak B, Czyz J. Antioxidant and anticancer activities of Chenopodium quinoa leaves extracts -in vitro study. Food Chem Toxicol. 2013;57:154-160.
- Lim D, Kim W, Lee M, Heo HJ, Chun OK, Kim D. Evidence for protective effects of coffees on oxidative stress induced apoptosis through antioxidant capacity of phenolics. Food Sci Biotechnol. 2012;21(6):1735-1744.
- Lindsey WL, Norwell MA. A new DPTA-TEA soil test for zinc and iron. Agron Abstr. 1969;61:84-89.
- Qi H, Li S. Dose-response meta-analysis on coffee, tea and caffeine consumption with risk of Parkinson's disease. Geriatr Gerontol Int. 2014;14(2):430-439.
- Seong JH, Chung HS, Kim HB, Lee JB, Moon KD. Quality characteristics of rice cookies as affected by coffee addition. Korean J Food Preserv. 2014;21(1):4045.
- Shimoda H, Seki E, Aitani M. Inhibitory effect of green coffee bean extract on fat accumulation and body weight gain in mice. BMC Complement Altern Med. 2006;6:9.
- Singleton VL, Orthofer R, Lamuela-Raventos RM. [14] Analysis of total phenols and other oxidation substrates and antioxidants by means of folin-ciocalteu reagent. In: Methods in enzymology. Vol. 299. San Diego: Academic Press; 1999. p. 152-178.
- Specific Coffee Association of America (SCAA). SCAA protocols: Cupping specialty coffee. 2009. p. 17.
- Stelmach E, Pohl P, Szymczycha-Madeja A. The content of Ca, Cu, Fe, Mg and Mn and antioxidant activity of green coffee brews. Food Chem. 2015;182:302-308.
- Suzuki A, Kagawa D, Ochiai R, Tokimitsu I, Saito I. Green coffee bean extract and its metabolites have a hypotensive effect in spontaneously hypertensive rats. Hypertens Res. 2002;25:99-107.
- Viroli SLM, Rodrigues FM, de Sousa PJ, Pereira PVD. Scientific initiation. 2008.
- Zain MZM, Baba AS, Shori AB. Effect of polyphenols enriched from green coffee bean on antioxidant activity and sensory evaluation of bread. J King Saud Univ Sci. 2018;30(2):278-282.