
Research article · 2025 · Full text
International Journal of Geography Geology and EnvironmentExamination of water treatment efficacy of lower Ruvu water quality, at Bagamoyo district, Coast region, Tanzania
Volume 7(7) · Pages 06–12 · DOI: 10.22271/27067483.2025.v7.i7a.378 ↗
Research areasWater Quality and Pollution Assessment
Abstract
Author-writtenAccess to clean and safe drinking water is a fundamental public health requirement, and effective water treatment plays a critical role in safeguarding communities from waterborne diseases. In Tanzania, ensuring the safety and quality of drinking water is primarily overseen by the Water Quality Division of the Ministry of Water, although daily water quality management is decentralized to regional and local water authorities. This study assessed the efficacy of the Lower Ruvu Water Treatment Plant (LRWTP) in Bagamoyo District, Coast Region, Tanzania, which supplies treated water to households across the Coast and Dar es Salaam regions. The investigation involved the collection of ten grab samples—two from the treatment plant and eight from various distribution points—during the dry season (August-September 2024). These samples were analyzed at the Central Water Quality Laboratory. Findings revealed that eight distribution sites (John residence, Mapinga, Boko, Kerege resort, Zinga sokoni, Kiromo Bunju, Ukuni petrol station, and Bunju “B”) recorded substandard residual chlorine levels, with a mean concentration of 0.09 mg/L, below the recommended range of 0.2-0.5 mg/L per WHO (2021) and Tanzanian standards (TZS 789: 2018). Conversely, the treatment plant at Sanzare met acceptable residual chlorine standards (1.0-2.0 mg/L). Microbiological analysis further detected the presence of total coliforms, fecal coliforms, and E. coli at the eight distribution sites, whereas both the treatment plant and the adjacent Sanzare outlet were free of contamination. These results highlight the degradation of water quality along the distribution network. To address this, the study recommends frequent chlorination at booster stations, strategic relocation of the LRWTP booster station closer to the treatment plant (currently situated far away at Ardhi University), and routine monitoring of residual chlorine levels. Timely repair of damaged distribution lines is also essential to prevent recontamination and maintain the microbiological safety of drinking water.
Summary
Source-checkedPlain-language reading of the full paper, prepared with AI and checked against the text. Each point links to the authors' own words.
Why it matters
- Clean and safe drinking water is essential for public health, as effective treatment protects communities from waterborne diseases. View evidence ↗
- Poor water quality and inadequate sanitation are linked to over 80% of human diseases worldwide. View evidence ↗
- Maintaining water safety is complicated by various pollution sources, including industrial discharges, agricultural runoff, and deteriorating distribution infrastructure. View evidence ↗
The question
- The study aimed to evaluate the operational efficiency of the Lower Ruvu Water Treatment Plant (LRWTP), specifically focusing on residual chlorine levels and bacteriological quality across its distribution network. View evidence ↗
What they did
- Ten grab samples were collected during the dry season of August-September 2024, consisting of two from the treatment plant and eight from distribution points. View evidence ↗
- Residual chlorine levels were measured on-site using a MAJI MAX photometer system. View evidence ↗
- Bacteriological quality was tested using the membrane filtration method following APHA 2000 standards. View evidence ↗
What they found
- The treatment plant at Sanzare maintained acceptable residual chlorine levels between 1.0 and 2.0 mg/L. View evidence ↗
- Eight distribution sites had substandard residual chlorine levels, averaging 0.09 mg/L, which is below the recommended 0.2-0.5 mg/L range. View evidence ↗
- While the treatment plant and Sanzare outlet were free of contamination, total coliforms, fecal coliforms, and E. coli were detected at all eight distribution sites. View evidence ↗
- Bacterial counts across the study areas ranged from 0 to 5 CFU/100 mL for E. coli, 0 to 9 CFU/100 mL for fecal coliform, and 0 to 13 CFU/100 mL for total coliform. View evidence ↗
- Residual chlorine levels declined progressively as the distance from the treatment plant increased, falling below acceptable limits at distant distribution points. View evidence ↗
What it means
- The authors concluded that water is safe when leaving the plant, but becomes contaminated within the distribution network before reaching consumers. View evidence ↗
- The authors recommend strategically relocating chlorine booster stations closer to the treatment plant to maintain effective residual chlorine levels. View evidence ↗
- A significant factor in the decline of water quality is the excessive distance between the treatment plant and the existing booster station at Ardhi University. View evidence ↗
Visual summary
2 visualsIllustrations explain the paper; charts are replotted from the paper's own table values.
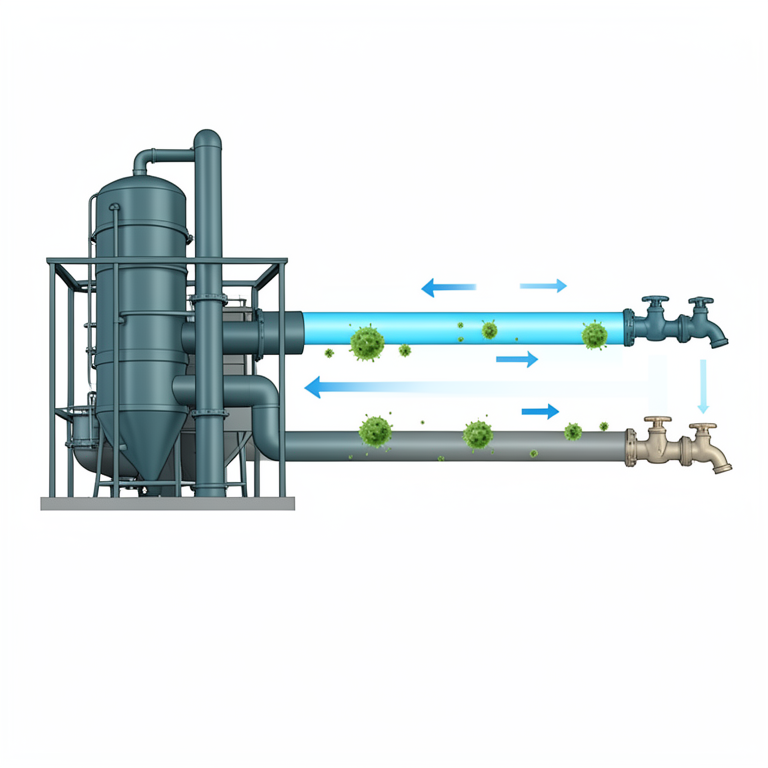
Water Quality Degradation Model
AI-generated conceptual illustration (A municipal water treatment plant and a network of residential water pipes and taps). It explains the idea and does not show study data.
View source evidence ↗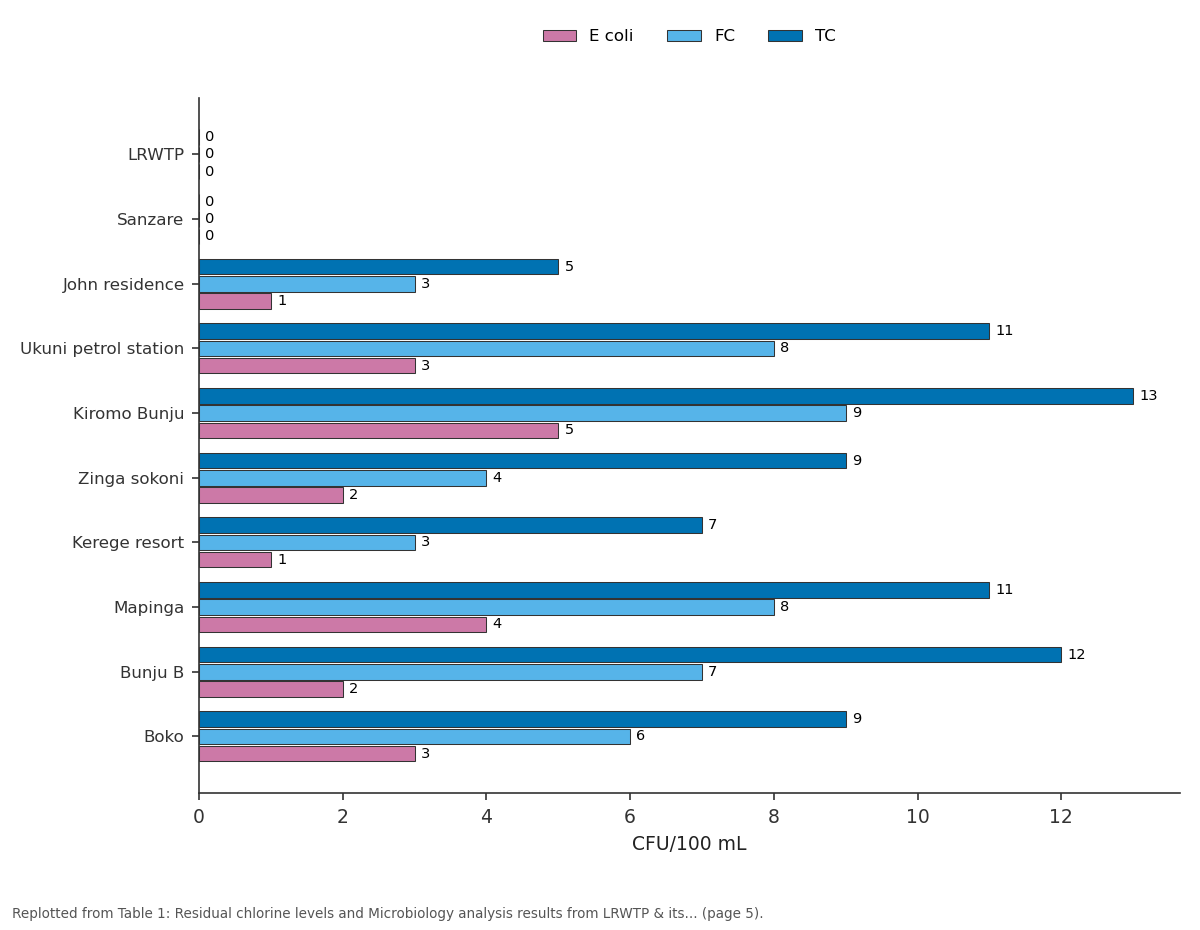
E coli and FC and more: LRWTP vs Sanzare vs John residence vs Ukuni petrol station vs Kiromo Bunju
Replotted from Table 1 (page 5) of the original paper. Every bar is the paper's own table value.
View source evidence ↗Figures & tables
From the original paper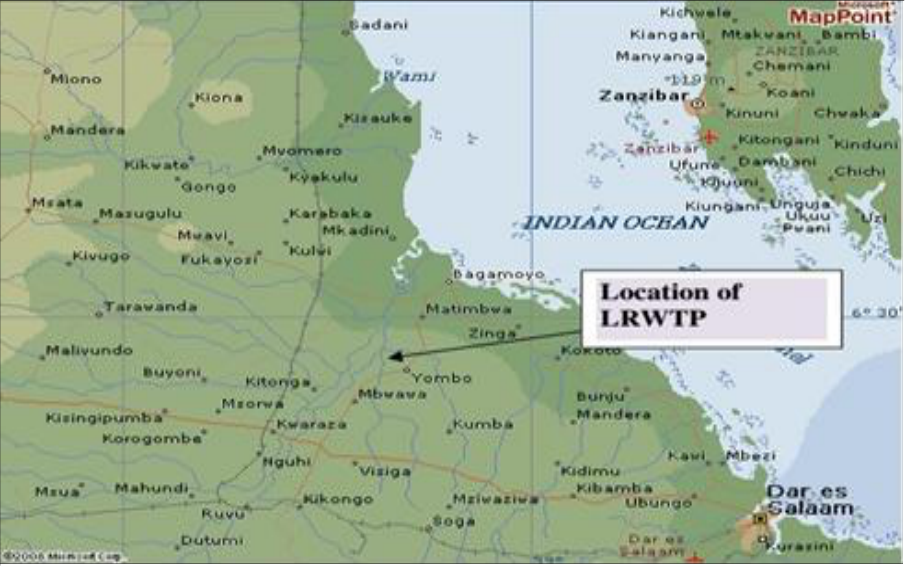 Figure 2
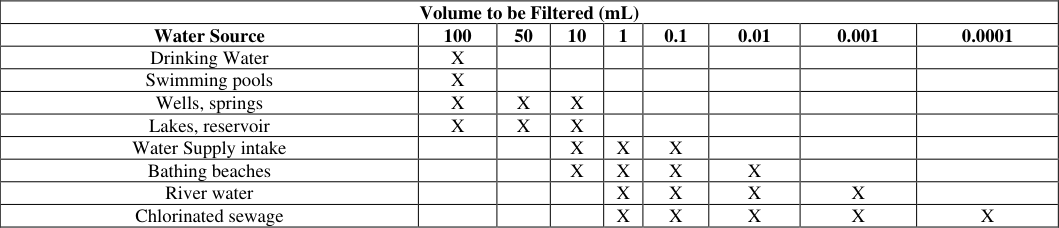 Table 1
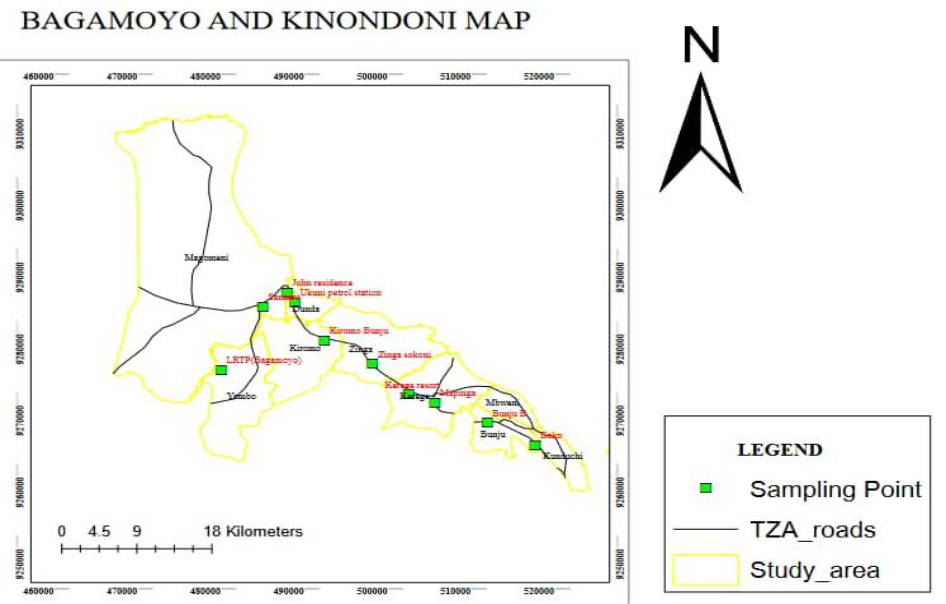 Figure 3
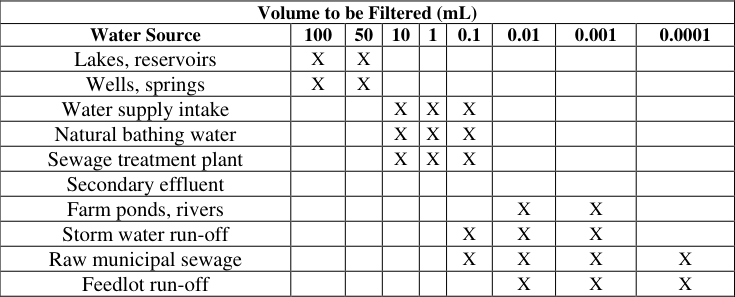 Table 2
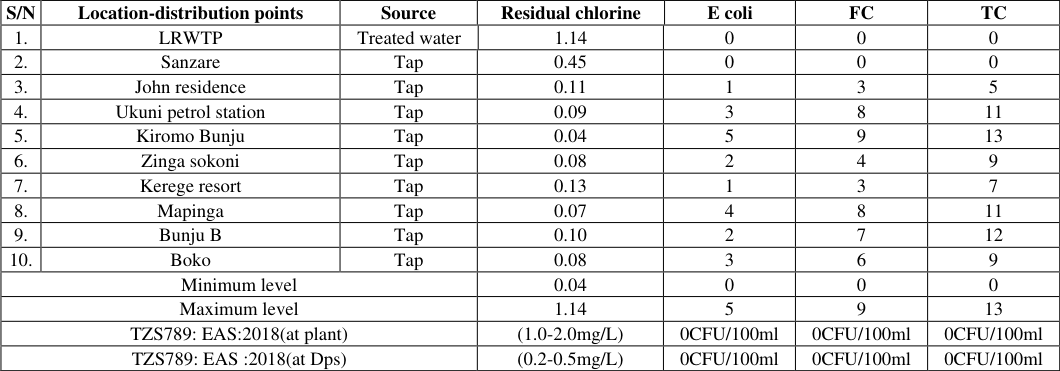 Table 1
Introduction
Access to clean and safe water is a fundamental human right and an essential driver for health, development, and environmental sustainability. In recognition of this, Sustainable Development Goal No. 6 (SDG 6) seeks to ensure universal access to water and sanitation by 2030, with a particular focus on water quality through indicators such as SDG 6.3.2, which emphasizes the importance of maintaining good ambient water quality. The National Water Policy of Tanzania (NAWAPO, 2002) aligns with this vision, prioritizing the protection of water sources, reduction of pollution, and conservation efforts to safeguard public health and support multiple water uses. These priorities are also echoed in broader strategic documents, including Tanzania Vision 2025 and the Five-Year Development Plans, which stress the need for continuous water quality monitoring to assess the effectiveness of interventions and prevent health hazards. Water is an invaluable resource, yet only a fraction is accessible for human consumption. While 2.5% of Earth's water is freshwater, much of it is locked in glaciers and ice caps, leaving only about 0.01% readily available for direct use. This scarcity underscores the urgency of treating and managing available water supplies effectively, particularly in rapidly urbanizing nations like Tanzania, where population growth intensifies the demand for potable water. Unfortunately, many residents, particularly in rural areas, still lack access to clean and safe water.
Urban centers such as Dar es Salaam and surrounding regions continue to grapple with the pressure of supplying safe drinking water, sanitation services, and infrastructure amidst expanding populations (Mahenge, 2022) [7] . The process of water treatment is vital in removing contaminants that pose health risks, with the efficacy of treatment systems heavily dependent on the quality of source water and the performance of treatment technologies. Safe drinking water reduces the transmission of diseases such as cholera, polio, dysentery, and diarrhoea, which remain prevalent in regions with inadequate water and sanitation services. Globally, over 80% of human diseases are attributed to poor water quality and inadequate environmental sanitation. Approximately 2 billion people consume water contaminated with faecal matter, while 4.5 billion lack access to improved sanitation systems (Luvhimbi et al., 2022) [6] . Pollution from agricultural runoff, industrial discharges, leaky pipes, illegal connections, and corroded distribution lines exacerbates the challenge of maintaining water safety throughout the supply chain. In response, the Government of the United Republic of Tanzania (URT) has taken significant steps to enhance water supply and sanitation services. The implementation of the Water Supply and Sanitation Act (URT, 2009) underpins efforts to operationalize the National Water Policy (URT, 2002), aiming to ensure that all citizens have access to sustainable, safe, and affordable water services while simultaneously protecting water resources and promoting public health. One critical component of this infrastructure is the Lower Ruvu Water Treatment Plant (LRWTP), located in Bagamoyo District, which serves as a key water source for Dar es Salaam and the broader Coast Region. However, several communities continue to experience intermittent or unsafe water access, especially those residing further from centralized treatment points (Bemspng & Segerström, 2009) [4] .
This study seeks to evaluate the operational efficiency of the Lower Ruvu Water Treatment Plant with a focus on bacteriological water quality and the sustainability of residual chlorine levels across the distribution network. The findings are intended to guide water authorities and public health stakeholders in improving treatment practices, optimizing chlorine disinfection, and strengthening the monitoring of water quality to prevent disease outbreaks.
Materials and Methods
Materials and Methods
Description of the Study Area
The Ruvu River is a vital water source for households, irrigated farms, and industries in the communities along its banks. It also serves as the primary water source for Dar es Salaam, Tanzania's largest city, located on the coast east of the Ruvu catchment. However, the river faces increasing pollution from untreated household and industrial wastewater discharges. The Lower Ruvu Water Treatment Plant (LRWTP) is situated in the Bagamoyo District, Coast Region, approximately 75 km north of Dar es Salaam City. Bagamoyo is one of the six districts in the Pwani Region of Tanzania. It is bordered to the north by the Tanga Region, to the west by the Morogoro Region, to the east by the Indian Ocean, and to the south by the Kibaha District. The LRWTP lies on the banks of the Ruvu River, which serves as the source for the treatment facility. The Ruvu River is part of the Wami/Ruvu Water Basin, formed by the Wami and Ruvu Rivers, both discharge water into the Indian Ocean north of Bagamoyo Town. The Lower Ruvu Water Treatment Plant site is located in Yombo ward, Bagamoyo District, as illustrated in Figure 2. It experiences a typical coastal climate, with annual rainfall ranging from 800 to 1200 mm. The short rainy season occurs between July and October, while the long rainy season can vary from March to June. Temperatures range from 13 °C to 30 °C.
Water Sample Size
The sample size for bacterial examination is determined by bacterial density and turbidity. The ideal sample volume for total coliform testing yields approximately 20 to 80 coliform colonies and no more than 200 colonies of all types per filter. The ideal sample volume for faecal coliform testing yields approximately 20 to 60 coliform colonies and no more than 200 colonies for all types per filter. Three volumes were filtered for samples with uncertain coliform numbers to achieve these ideal conditions. Tables 1 and2 list the recommended volumes for various types of samples. When the sample is less than 20 mL (diluted or undiluted), 10 mL of sterile dilution water is added to the filter funnel before the vacuum is applied. This aids in the uniform distribution of bacteria over the entire membrane filter as per the Standard Methods for Examination of Water and Wastewater, APHA 23rd Edition ed., page 9-60. Water supply intake
Consultation with treatment plant operators was done, and a site visit of the treatment area to get an overview of their treatment facilities used and to get the trend of the effectiveness of the treatment facilities was conducted by visiting the Lower Ruvu treatment plant at Bagamoyo. Residual chlorine was measured on site, identification of the treatment chemicals used to clean and disinfect before supply was identified by asking the operators the types of chemicals used for water disinfection. The residual chlorine was measured by using the MAJI-meter.
Collection of water samples
The samples were collected in sterilized 400 mL transparent glass bottles. The bottles were washed and rinsed several times with tap water and then with distilled water before being dried thoroughly. The sample bottles were sterilized in an autoclave at 121˚C for 15 minutes to ensure they were free from bacterial contamination. The petri dishes used for bacteria analysis were also washed and rinsed thoroughly, then kept in the oven at 121˚C for fifteen (15) minutes. Additionally, petri dishes were washed and rinsed multiple times with tap water and then with distilled water before being dried thoroughly. The petri dishes were kept in the oven for one (1) Residual chlorine was measured on-site using the MAJI MAX (Photometer system) instrument, which allowed the water to flow for about two minutes. The method used was Chlorine, free with Tablet (0.01-6mg/l Cl2) by the Wagtec photometer system. A clean vial (24mmØ) was filled with 10 ml of the water sample, and the cap was tightly closed. The vial was then placed in the sample chamber, ensuring the marks aligned. The ZERO key was pressed, after which the vial was removed from the sample chamber and emptied, leaving only a few drops inside. One drop of DPD No.1 tablet was added directly from the foil into the vial.
Water was added to the 10 mL mark. The vial was sealed tightly with the cap and swirled several times until the tablet dissolved. It was placed back in the sample chamber, ensuring the marks aligned. The TEST key was pressed, and the results were displayed in mg/l free chlorine, which were recorded in the workbook. Bacteriological quality testing employed membrane filtration as described in the Standard Methods for Examination of Water and Wastewater (APHA 2000).
Water samples for bacteriological analysis were randomly collected in duplicates from both selected strategic locations identified in the study area during the dry season of September 2024. Throughout the sample collection process, utmost care was taken to obtain a well-representative sample. After sterilizing the source and flushing for about two (2) minutes, the sample was collected at a minimum level in the bottle to allow space for bacteria to survive.
A sufficient volume of water for analysis was collected, with at least 100 mL of water samples gathered according to the Standard Methods for the Examination of Water and Wastewater guidelines (APHA 23rd Edition). The samples were collected in sterile glass sample bottles, ensuring the containers were not filled; at least 2.5 cm of air space was maintained to allow adequate room for mixing the sample before analysis. The samples were packed in a freezing container to preserve their integrity and to maintain the temperature between 4•C and 10•C. After collection, the water samples were transported to the Central Water Quality Laboratory for analysis.
Reagent Preparations and Analysis
The procedure for culturing bacteriological parameters involved the membrane filtration method, in which the specific media for culturing bacteria was prepared aseptically and poured into sterilized Petri dishes.
Preparation of EMB Media for culturing E. coli
The required amount of 3.746 grams of dehydrated medium (EMB Agar) was suspended in 100 mL of distilled water. The solution was heated to a boil until the medium dissolved completely. The medium was sterilized in an autoclave at 15 lbs of pressure and 121 ºC for 15 minutes, and then cooled to 47 ºC. The medium was mixed well to oxidize the methylene blue and ensure a homogeneous precipitate suspension. Approximately 2 mL of the medium was poured into sterile petri dishes and left to solidify, ready for E. coli culturing.
Preparation of MFC Media for Culturing Fecal Coliform
The required amount of 5.21 grams of dehydrated medium (MFC Agar) was suspended in 100 mL of distilled water containing 1 mL of 1% rosolic acid. The 1% rosolic acid was prepared by weighing 0.25 g of dehydrated rosolic acid, which was then placed in a 25 mL volumetric flask. The solution was heated to boiling until the medium completely dissolved. The medium was cooled to 47 ºC. Approximately 2 mL of the medium was poured into sterile Petri dishes and allowed to solidify, making it ready for fecal coliform culturing.
Preparation of M Endo Media for culturing Total Coliform
The required amount, 5.209 grams of dehydrated medium (M Endo Agar), was suspended in 100 mL of distilled water. The solution was heated to boil until the medium dissolved completely. Once cooled to 47 ºC, approximately 2 mL of the medium was poured into sterile Petri dishes and allowed to solidify, preparing it for Total coliform culturing.
Data Analysis
Hands were sanitized using ethanol or methylated spirits.
The working bench was cleaned with cotton wool soaked in ethanol or methylated spirits. The filtration unit was assembled, and the vacuum pressure pump was correctly positioned on the working bench and connected to the electric switch. The funnel of the filtration unit was sterilized using a flame fueled by methylated spirits or ethanol to ensure the elimination of microorganisms, and it was then allowed to cool. The twist of the funnel was opened, and the filter package was retrieved. Forceps were used carefully to pick out a sterile 0. 0.45 µm filter from the package. The filter was transferred to the center of the holder base, with the grid side facing up over the filter support area of the holder base. The funnel was placed on the holder base, ensuring that the filter paper was not damaged or dislodged. The funnel was secured to the base with a twist lock. The sample bottles were shaken to ensure an even distribution of bacteria. The stopper was removed, and the required quantity (100 ml or less) was poured into the funnel up to the 100 ml mark. Suction from the vacuum pressure pump was applied until the filter was dry. The funnel was then removed, lifting off the filter with forceps by inserting the tip of one forceps blade under the edge of the membrane filter, grasping it, and pulling it off the support area of the holder base. The funnel was replaced with the holder base. The two halves of the Petri dishes were opened. The filter was drawn along the far rim of the Petri dishes (grid side up) until the far edge of the membrane filter fell on the pad's far edge. The Petri dishes were closed and placed upside down in the incubator to prevent fogging during counting. The required temperature was set to promote bacterial growth. For E. coli, the incubation temperature was 37 ºC; for fecal coliform, it was 44 ºC; and for total coliform, it was also 37 ºC. The incubation time for E. coli was 24 hours, for fecal coliform it was 24 hours, and for total coliform, it was 22 hours, respectively. All analyses performed were verified using internal quality control samples to check the positive and negative control cultures, sterile blanks, replicate analyses (precision), and a known quantitative culture was utilized (APHA, 23 rd Edition).
Results and Discussion
Results and Discussion
Results
This research examined the bacteriological quality of raw and treated water at the Lower Ruvu distribution points. It also evaluated the efficacy of water treatment chemicals used to clean and disinfect water prior to supply at the Lower Ruvu Water Treatment Plant (LRWTP) by assessing the sustainability of residual chlorine, with results detailed in Table 4.1. Concentrations of residual chlorine in the study areas ranged from 0.04 mg/L to 1.14 mg/L, and the bacterial count was E. coli (0 to 5), fecal coliform (0 to 9), and total coliform (0 to 13) CFU/100 mLs.
The results indicated levels of residual chlorine within the acceptable standard limits in LRWTP and Senzare. In the rest of the distribution points (DPs), concentrations of residual chlorine were below the acceptable limits of 0.2 to 0.5 (TZS 789: EAS 2018). The results indicated that the water from LRWTP and Senzare was free from bacterial contamination, whereas water collected from the rest of the DPs was contaminated with bacteria. The acceptable limit for bacteria counts in water is 0/100ml CFU (TZS 789: EAS 2018).
Discussion
The bacteriological quality of drinking water remains a major concern in Tanzania, as evidenced by numerous studies pointing to persistent contamination despite chlorination. In Morogoro Municipality, for instance, an assessment by Katto and Nonga (2017) [13] found that all tested chlorinated water samples contained coliform bacteria, in violation of the WHO guideline of 0 CFU/100 mL. This contamination suggested faecal intrusion and raised concerns about the risk of waterborne disease transmission. Alarmingly, even during both dry and rainy seasons, total coliform counts remained high in chlorinated water, surpassing the maximum permissible limits set by WHO and the Tanzania Bureau of Standards (TBS), which both recommend zero coliform presence in 100 mL of drinking water. This finding was unexpected, as chlorinated water is typically assumed to be free from microbial contamination. These results were corroborated by Shayo et al. (2007) [11] , who observed faecal coliform levels ranging from 95 to 214 CFU/100 mL in Kingolwira village, Morogoro. Possible explanations for these elevated coliform levels in chlorinated water include leakage in the water distribution infrastructure, leading to external contamination, or inefficiencies in the chlorination process itself. Chlorination is typically considered effective when 0.5 mg/L of free chlorine is maintained for at least 30 minutes of contact time. However, suspended particles in water may shield bacteria from chlorine's disinfecting action, allowing microbial survival even in treated water. Katto and Nonga (2017) [13] emphasize the need for authorities like MORUWASA to reevaluate their chlorination protocols and strengthen routine water quality monitoring to ensure public safety.
In the case of the Lower Ruvu Water Treatment Plant (LRWTP), this study found that while residual chlorine concentrations at the treatment site and the nearby Sanzare distribution point were within the acceptable range of 0.2-0.5 mg/L (TZS 789:2018), levels declined progressively at more distant points in the network. These points-such as John's residence, Ukuni petrol station, Kiromo Bunju, Zinga Sokoni, Kerege Resort, Mapinga, Bunju "B," and Bokoexhibited residual chlorine levels below recommended thresholds and were concurrently found to be bacteriologically contaminated. This pattern underscores a critical point: residual chlorine degrades with both time and distance, and when it falls below effective levels, it cannot suppress microbial regrowth or prevent new contamination (Reid et al., 2023) [9] . The observed decline in chlorine effectiveness is likely linked to the long distance between the treatment plant and the chlorine booster station, which is located at Ardhi University in Dar es Salaam-considerably far from Bagamoyo.
Additionally, physical infrastructure vulnerabilities, such as pipeline leakages, may allow external contaminants to enter the water distribution system. These findings align with those from Muller (2018) [8] , who reported similar challenges in the Kigoma water supply network. Using H₂S-producing bacteria as indicators, the study showed that water stagnation and negative pressure in poorly maintained pipes significantly increased the likelihood of contamination. Residual chlorine concentrations of less than 0.1 mg/L were associated with a 77% detection rate for H₂S-producing bacteria, compared to only 7% in samples with higher residual chlorine levels. Similarly, Oberlin and Ntoga (2018) [2] reported high levels of Total Coliforms and Escherichia coli (E. coli) in the Sumve-Kwimba District. Their analysis revealed total coliform counts ranging from 300 to 4,200 CFU/100 mLwell above the WHO limit of 0 CFU/100 mL-and E. coli levels ranging from 10 to 200 CFU/100 mL in distribution point samples. The elevated counts were attributed to stormwater runoff infiltration, pipe leaks, and potential contamination during storage or transportation. These findings confirm that even if the water is treated effectively at the source, contamination is likely to occur downstream due to aging infrastructure and insufficient maintenance. The collective evidence from these studies ( [13,11,8,2] supports a consistent conclusion: residual chlorine levels decline over distribution distance, and this decline compromises the bacteriological integrity of drinking water. Chlorine, while essential, must be maintained at adequate levels throughout the distribution system to prevent pathogen regrowth or recontamination. According to Al-Jasser (2007) [1] , the effectiveness of chlorine is further diminished when bacteria adhere to particles or biofilms within pipes, shielding them from disinfection.
Conclusion
The findings of this study demonstrate that while water leaving the Lower Ruvu Water Treatment Plant meets bacteriological standards, contamination occurs within the distribution network before it reaches end users. The presence of coliform bacteria in several distribution points indicates possible breaches in the integrity of the water supply system, primarily due to declining residual chlorine levels as water travels further from the treatment plant. Although residual chlorine was detected in all sampled locations, concentrations in multiple sites fell below the minimum thresholds recommended by WHO and Tanzanian standards (0.2-0.5 mg/L), compromising the water's disinfection capacity. This reduction in chlorine effectiveness is likely a result of long distances to booster stations, pipe leakages, and microbial regrowth within the distribution system. These challenges suggest that even with adequate treatment at the source, water quality can deteriorate before consumption, posing serious public health risks and emphasizing the need for improved operational strategies along the entire supply chain.
Recommendation
To safeguard public health and maintain the bacteriological safety of drinking water throughout the distribution system, it is recommended that chlorine booster stations be strategically positioned closer to the treatment plant. This will help ensure consistent and effective residual chlorine levels are maintained across the distribution network, thereby minimizing bacterial contamination and reducing the risk of waterborne disease outbreaks.
Acknowledgement
AcknowledgmentThe authors appreciate the data collection and analysis carried out by my Research Assistant, MILLEN MELKIZEDECK MLIGHA, of Lower Ruvu Water Treatment Plant and Maji Laboratory Scientists in Dar es Salaam, Tanzania.
Figures and tables from the paper
| Volume to be Filtered (mL) | — | — | — | — | — | — | — | — |
|---|---|---|---|---|---|---|---|---|
| Water Source | 100 | 50 | 10 | 1 | 0.1 | 0.01 | 0.001 | 0.0001 |
| Drinking Water | X | |||||||
| Swimming pools | X | |||||||
| Wells, springs | X | X | X | |||||
| Lakes, reservoir | X | X | X | |||||
| Water Supply intake | X | X | X | |||||
| Bathing beaches | X | X | X | X | ||||
| River water | X | X | X | X | ||||
| Chlorinated sewage | X | X | X | X | X |
Table text extracted from the original PDF; superscript letters are shown inline. The original table image is below.
View original table image
| S/N | Location-distribution points | Source | Residual chlorine | E coli | FC | TC |
|---|---|---|---|---|---|---|
| 1. | LRWTP | Treated water | 1.14 | 0 | 0 | 0 |
| 2. | Sanzare | Tap | 0.45 | 0 | 0 | 0 |
| 3. | John residence | Tap | 0.11 | 1 | 3 | 5 |
| 4. | Ukuni petrol station | Tap | 0.09 | 3 | 8 | 11 |
| 5. | Kiromo Bunju | Tap | 0.04 | 5 | 9 | 13 |
| 6. | Zinga sokoni | Tap | 0.08 | 2 | 4 | 9 |
| 7. | Kerege resort | Tap | 0.13 | 1 | 3 | 7 |
| 8. | Mapinga | Tap | 0.07 | 4 | 8 | 11 |
| 9. | Bunju B | Tap | 0.10 | 2 | 7 | 12 |
| 10. | Boko | Tap | 0.08 | 3 | 6 | 9 |
| Minimum level | 0.04 | 0 | 0 | 0 | ||
| Maximum level | 1.14 | 5 | 9 | 13 | ||
| TZS789: EAS:2018(at plant) | (1.0-2.0mg/L) | 0CFU/100ml | 0CFU/100ml | 0CFU/100ml | ||
| TZS789: EAS :2018(at Dps) | (0.2-0.5mg/L) | 0CFU/100ml | 0CFU/100ml | 0CFU/100ml |
Table text extracted from the original PDF; superscript letters are shown inline. The original table image is below.
View original table image
References
14 in the original paper- Al-Jasser A. Chlorine decay in drinking water transmission and distribution systems: Pipe service age effect. Water Research. 2007;41(2):387-396.
- Oberlin AS, Ntoga S. Quality assessment of drinking water in Sumve Kwimba District. American Journal of Engineering Research. 2018;7(5):26-33. Available from: https://www.ajer.org/papers/Vol-7-issue-
- American Public Health Association, American Water Works Association. Standard methods for the examination of water and wastewater. 23rd ed. Washington, DC: APHA; 1999.
- Bemspång J, Segerström R. In the way of clean and safe drinking water: Exploring limitations to improvement of the water supply in Bagamoyo District, Tanzania. 2009.
- Energy and Water Utilities Regulatory Authority (EWURA). Water and wastewater quality monitoring guidelines. 2nd ed. Dar es Salaam: EWURA; 2020.
- Luvhimbi N, Tshitangano TG, Mabunda JT, Olaniyi FC, Edokpayi JN. Water quality assessment and evaluation of human health risk of drinking water from source to point of use at Thulamela Municipality, Limpopo Province. Scientific Reports. 2022;12(1):6059.
- Mahenge A, Mato RR. Performance audit in management of Lower Ruvu Water Treatment Plant in Dar es Salaam, Tanzania. Applied Journal of Environmental Engineering Science. 2022;8(2).
- Muller P. An examination of microbiological water quality in Kigoma, Tanzania using a test for the presence of H2S-producing bacteria [Internet]. 2018 [cited 2025 Jul 9]. Available from: https://www.geo.arizona.edu/nyanza/pdf/Muller.pdf
- Reid E, Igou T, Zhao Y, Crittenden J, Huang CH, Westerhoff P, et al. The minus approach can redefine the standard of practice of drinking water treatment. Environmental Science & Technology. 2023;57(18):7150-7161.
- Seureca. Activity report under Water Utilities Performance Review Report for FY 2017/18 [Internet]. 2018 [cited 2025 Jul 9]. Available from: https://www.seureca.veolia.com/sites/g/files/dvc2556/fi les/document/2019/08/RA_2018_SEURECA
- Shayo NB, Chove BE, Gidamis AB, Ngoma OB. The quality of water in small community supplies of Kingolwira village, Morogoro, Tanzania. Tanzania Health Research Bulletin. 2007;9:56-60.
- Tanzania Bureau of Standards. Potable water specification-TZS 789:2016. Dar es Salaam: TBS; 2016.
- Katto TM, Nonga HE. Bacteriological assessment of chlorinated and non-chlorinated water in Morogoro Municipality, Tanzania. Tanzania Veterinary Association Proceedings. 2017;35. Available from: https://www.cabidigitallibrary.org/doi/pdf/10.5555/201 83195437
- United Republic of Tanzania. Rapid water resources assessment. Vol. 1: Main report. Ministry of Water, Energy and Minerals; 2009. p. 1-35.