
Research article · 2025 · Full text
International Journal of Agriculture and Food ScienceConsumer buying behavior of different packaged milk brands in Prayagraj district, Uttar Pradesh
Volume 7(7) · Pages 50–52 · DOI: 10.33545/2664844x.2025.v7.i7a.497 ↗
Research areasAgricultural Economics and PracticesBusiness Strategies and Innovation
Abstract
Author-writtenThis research study analyzes the marketing and consumer buying behavior of various packaged milk brands in Prayagraj district, Uttar Pradesh. The aim is to explore consumer preferences, evaluate existing marketing channels, and identify the factors influencing consumer decisions in selecting packaged milk. A structured questionnaire was used to collect data from 100 consumers across urban and semi-urban areas. The study utilized statistical tools like percentage analysis and Garrett's Ranking Technique to understand consumer preferences and the major constraints faced by them. The findings revealed that Amul and Sudha are the most preferred brands due to their availability, perceived quality, and reasonable pricing. The majority of respondents purchase milk from retail outlets due to accessibility and trust in the brand. Quality, brand image, packaging, and price are the most critical factors influencing consumer choice. Constraints such as adulteration fears, irregular supply, and lack of proper labeling were identified as major issues by respondents. The study recommends that companies invest in enhancing supply chain efficiency, build brand trust through transparent practices, and educate consumers on milk safety standards. These steps would help improve consumer satisfaction and loyalty in the competitive packaged milk market of Prayagraj.
Summary
Source-checkedPlain-language reading of the full paper, prepared with AI and checked against the text. Each point links to the authors' own words.
Why it matters
- Milk is a fundamental part of the Indian diet, and increasing urbanization has driven a higher demand for packaged milk that is processed hygienically. View evidence ↗
- Even with growing demand, consumers encounter problems such as concerns over product authenticity, inconsistent pricing, and irregular supply. View evidence ↗
The question
- The study aims to identify the factors that influence consumer decisions when selecting packaged milk, as well as to evaluate marketing channels and consumer preferences. View evidence ↗
What they did
- Data was collected from 100 consumers in urban and semi-urban areas using a structured questionnaire. View evidence ↗
- The researchers used percentage analysis and Garrett's Ranking Technique to analyze consumer preferences and constraints. View evidence ↗
What they found
- Amul is the most preferred brand among consumers at 42%, followed by Sudha at 25%. View evidence ↗
- Milk quality is the most influential factor in buying decisions, receiving the highest Garrett score of 75.6. View evidence ↗
- Price is the second most important factor influencing consumers, with a Garrett score of 66.8. View evidence ↗
- The majority of consumers (58%) purchase their packaged milk from local retail shops. View evidence ↗
- Most respondents (65%) purchase milk on a daily basis. View evidence ↗
- The primary constraint faced by consumers is the fear of adulteration, which ranked first with a Garrett score of 70.2. View evidence ↗
- Irregular supply is the second most significant constraint, with a Garrett score of 62.4. View evidence ↗
What it means
- The authors conclude that dairy companies should focus on educating consumers about safety standards and investing in efficient, transparent supply chains. View evidence ↗
- The study recommends implementing strict quality control measures to address the issue of adulteration. View evidence ↗
Visual summary
2 visualsIllustrations explain the paper; charts are replotted from the paper's own table values.
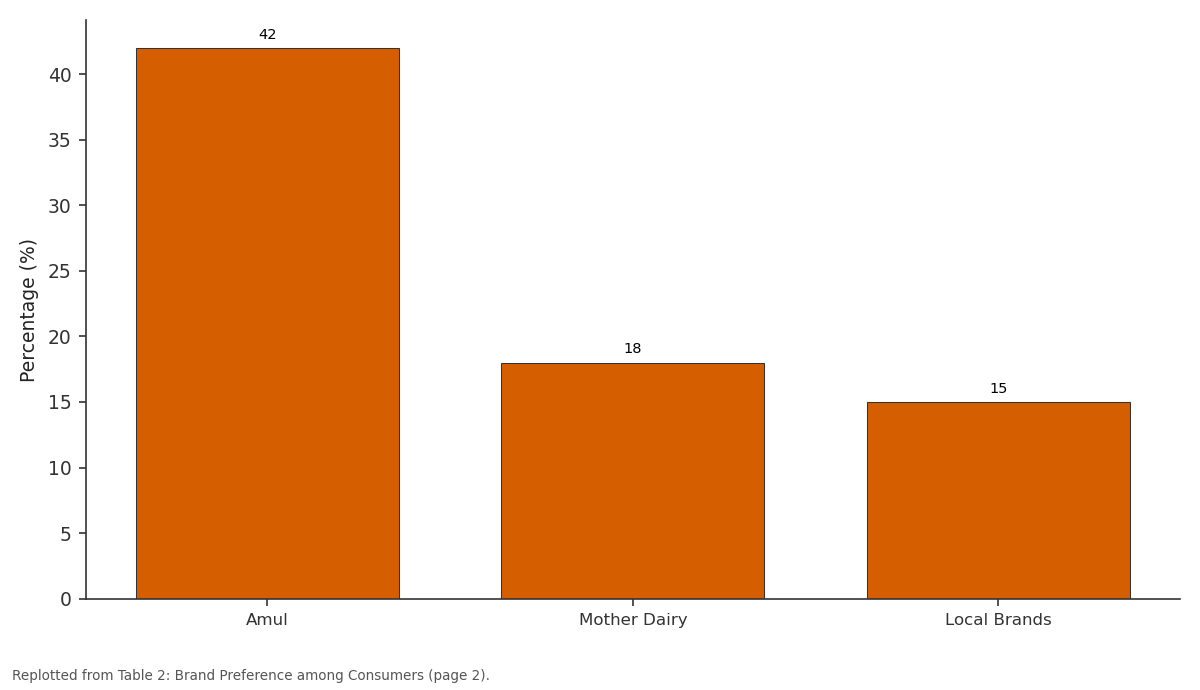
Percentage (%): Amul vs Mother Dairy vs Local Brands
Replotted from Table 2 (page 2) of the original paper. Every bar is the paper's own table value.
View source evidence ↗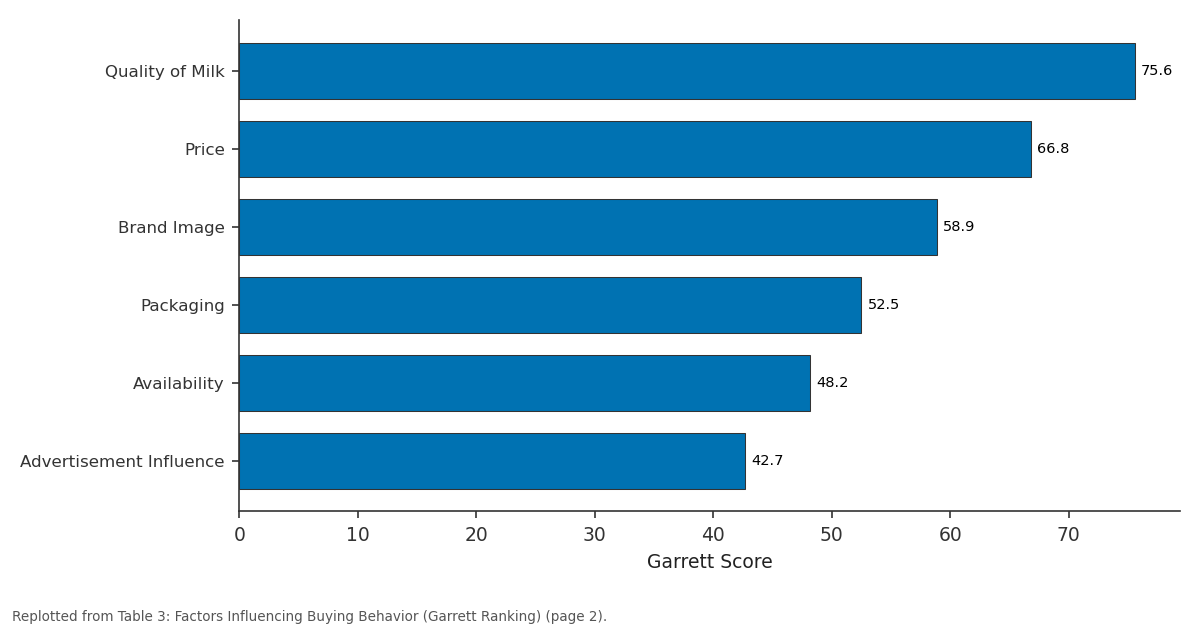
Garrett Score: Quality of Milk vs Price vs Brand Image vs Packaging vs Availability
Replotted from Table 3 (page 2) of the original paper. Every bar is the paper's own table value.
View source evidence ↗Figures & tables
From the original paper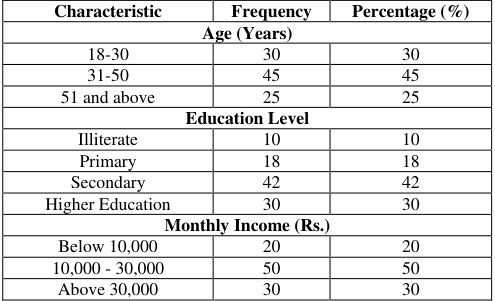 Table 1
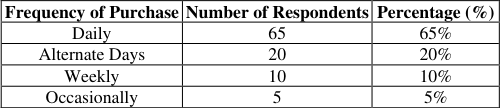 Table 4
 Table 2
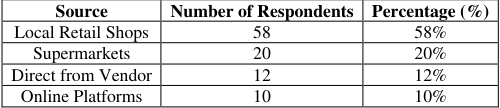 Table 5
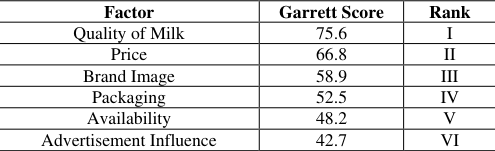 Table 3
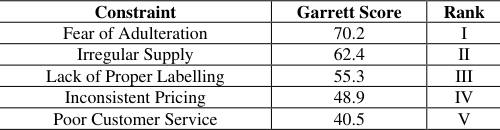 Table 6
Introduction
Milk is one of the most essential components of the Indian diet, and with growing urbanization, the demand for hygienically processed and conveniently packaged milk has significantly increased. In districts like Prayagraj, packaged milk consumption is on the rise, influenced by factors such as lifestyle changes, awareness of health and hygiene, and increasing disposable incomes. Multiple brands such as Amul, Sudha, Mother Dairy, and local brands compete to capture the growing consumer base. Despite the rising demand, consumers often face challenges related to product authenticity, pricing, regularity of supply, and misinformation regarding nutritional content. Additionally, brand switching is commonly observed due to changes in product quality or marketing strategies. Therefore, understanding consumer buying behavior becomes essential to design effective marketing strategies and enhance brand loyalty. This study investigates the socio-economic profile of consumers, their brand preferences, the marketing channels they rely on, and the constraints they face. The insights gained from this research aim to guide dairy companies and policymakers to improve product accessibility, pricing strategies, and quality control, ultimately benefiting both producers and consumers.
Materials and Methods
The study was conducted in Prayagraj district of Uttar Pradesh. A sample of 100 consumers was selected randomly from both urban and semi-urban areas. Data was collected using a structured interview schedule comprising questions on socio-economic status, brand preference, frequency of purchase, mode of purchase, and constraints faced. Analytical Tools Used: Discussion: Amul is the most preferred brand (42%) followed by Sudha (25%), indicating strong consumer trust and consistent product quality. Local brands are less preferred due to issues related to quality and trust. The factors influencing buying behavior toward milk products in Jaunpur district highlight the significant role that quality plays in consumer decisions, with a Garrett score of 75.6, ranking it as the most influential factor. Consumers prioritize the quality of milk above all else, indicating that milk's freshness, taste, and nutritional value are critical to purchasing decisions. Price follows as the second most important factor, with a score of 66.8, suggesting that while quality is paramount, affordability remains a key consideration for consumers. Brand image ranks third, with a score of 58.9, signifying that consumers are also influenced by the reputation and trustworthiness of the milk brands they purchase. Packaging, with a score of 52.5, indicates that the visual appeal and convenience of packaging contribute to consumer preferences, though it is less influential than the above factors. Availability (48.2) is ranked fifth, which reflects the importance of easy access to milk, but it is not as decisive as quality or price. Lastly, advertisement influence (42.7) ranks the lowest, indicating that promotional campaigns have the least impact on consumers' milk purchasing decisions, suggesting that word-of-mouth, trust, and personal experience play a more significant role. These rankings underscore the need for milk producers and marketers to focus on maintaining high quality, competitive pricing, and strong brand presence to effectively cater to consumer preferences.
Results and Discussion
Results and Discussion
Discussion
The majority of respondents (65%) purchase milk daily, which aligns with the staple nature of milk in the Indian diet. This frequency highlights the need for reliable supply and product availability. Consumers purchasing on alternate days (20%) or weekly (10%) likely have storage capacities or variable consumption needs. Only 5% purchase milk occasionally, suggesting they may substitute with other dairy or non-dairy products. Ensuring daily availability and freshness is therefore crucial for brand loyalty.
Discussion
Local retail shops are the most common purchase point for consumers (58%), indicating their convenience and accessibility. Supermarkets (20%) cater to consumers preferring bulk buying or branded options. A smaller proportion (12%) rely on direct vendors, possibly for perceived freshness or affordability. Online purchases remain low (10%), reflecting either limited digital adoption or concerns about freshness in online delivery. These insights emphasize the importance of maintaining strong supply chains through local retail and exploring trustbuilding in online platforms.
Figures and tables from the paper
| Characteristic | Frequency | Percentage (%) |
|---|---|---|
| Age (Years) | ||
| 18-30 | 30 | 30 |
| 31-50 | 45 | 45 |
| 51 and above | 25 | 25 |
| Education Level | ||
| Illiterate | 10 | 10 |
| Primary | 18 | 18 |
| Secondary | 42 | 42 |
| Higher Education | 30 | 30 |
| Monthly Income (Rs.) | ||
| Below 10,000 | 20 | 20 |
| 10,000 - 30,000 | 50 | 50 |
| Above 30,000 | 30 | 30 |
Table text extracted from the original PDF; superscript letters are shown inline. The original table image is below.
View original table image
| Frequency of Purchase | Number of Respondents | Percentage (%) |
|---|---|---|
| Daily | 65 | 65% |
| Alternate Days | 20 | 20% |
| Weekly | 10 | 10% |
| Occasionally | 5 | 5% |
Table text extracted from the original PDF; superscript letters are shown inline. The original table image is below.
View original table image
| Brand | Frequency | Percentage (%) |
|---|---|---|
| Amul | 42 | 42 |
| Mother Dairy | 18 | 18 |
| Local Brands | 15 | 15 |
Table text extracted from the original PDF; superscript letters are shown inline. The original table image is below.
View original table image
| Source | Number of Respondents | Percentage (%) |
|---|---|---|
| Local Retail Shops | 58 | 58% |
| Supermarkets | 20 | 20% |
| Direct from Vendor | 12 | 12% |
| Online Platforms | 10 | 10% |
Table text extracted from the original PDF; superscript letters are shown inline. The original table image is below.
View original table image
| Factor | Garrett Score | Rank |
|---|---|---|
| Quality of Milk | 75.6 | I |
| Price | 66.8 | II |
| Brand Image | 58.9 | III |
| Packaging | 52.5 | IV |
| Availability | 48.2 | V |
| Advertisement Influence | 42.7 | VI |
Table text extracted from the original PDF; superscript letters are shown inline. The original table image is below.
View original table image
| Constraint | Garrett Score | Rank |
|---|---|---|
| Fear of Adulteration | 70.2 | I |
| Irregular Supply | 62.4 | II |
| Lack of Proper Labelling | 55.3 | III |
| Inconsistent Pricing | 48.9 | IV |
| Poor Customer Service | 40.5 | V |
Table text extracted from the original PDF; superscript letters are shown inline. The original table image is below.
View original table image
References
5 in the original paper- Singh R, Kumar A. Consumer preferences for packaged milk in Uttar Pradesh. Indian J Mark. 2020;50(2):18-26.
- Verma S, Sharma P. Milk marketing channels and consumer behavior. J Dairy Econ. 2019;35(1):56-64.
- Chaudhary N. Brand loyalty in dairy sector: a case of packaged milk. Rural Mark Rev. 2021;41(3):102-110.
- Government of Uttar Pradesh. Dairy Development Department annual report. 2023.
- Sharma M. Challenges in packaged milk supply chains. Indian J Agribusiness. 2018;33(4):70-78.
Cited by 1
From OpenAlex, OpenCitations and reference lists read by Scinovex
- Consumer preference and dealer perception towards Amar dairy products in Akola city of Maharashtra
NR Shingne, MS More, AS Tingre, SV Warade, VJ Rathod · International Journal of Agriculture and Food Science · 2026
The present study was undertaken to identify the consumer preference towards Amar Dairy products and to study the advantages of selling Amar Dairy products in Akola city of Maharashtra state. The study is based on primary data collected from 90 selected consumers and 10 Amar Dairy dealers in Akola city through a well-structured schedule using the survey method during the academic year 2025-26. Frequency and percentage analysis was used to identify consumer preference, reasons for preference and purchase frequency, while mean score and simple ranking technique was used to identify the advantage