
Research article · 2025 · Full text
International Journal of Agriculture and Food ScienceCorporate governance model for improved performance in Zimbabwe smallholder banana farmers’ cooperatives
Volume 7(6) · Pages 365–375 · DOI: 10.33545/2664844x.2025.v7.i6e.479 ↗
Research areasCooperative Studies and Economics
Abstract
Author-writtenThis article details a sustainable corporate governance framework for smallholder banana farmers in the Mutasa District of Zimbabwe. This analysis was motivated by the fact that there were 14 fully operational banana cooperatives in the Mutasa area of Zimbabwe in 1998, but by 2025 only 2 were operational and the rest were mostly dysfunctional due to chronic conflict between members. In addition, output production from such cooperatives continued to dwindle, raising fears about their sustainability and that of the smallholder farmers connected with them. This underlined the urgent need for comprehensive assessment of governance processes, particularly under the purview of principles of corporate governance. The main objectives of the study were to analyse transparency, accountability, care of stakeholders and long-term orientation in these cooperatives. Two central theories were applied for the study namely the Stakeholder Theory, which emphasizes the importance of delivering value for all stakeholders to achieve long-term success, and the Bottom-Line Theory which argues for a balanced approach to financial, social and environmental duties. The study used a positivist research philosophy as well as an explanatory research design, selecting 140 farmers from the Pahasha and Murara Cooperatives. Based on Slovin's Formula the sample size was decided as 104, and a stratified random sampling was used to ensure proportional representation. Primary data was collected using a closed ended questionnaire. The study found that cooperatives were grappling with declining production output, financial ill-health and low personal profits While members saw some transparency in financial reporting, major gaps remain in record access and communication. There were unclear leadership positions and roles. There was lack of stakeholder involvement. Additionally, the cooperatives were focused primarily on short-term profits over long-term sustainability, showing the need for a strategy focus. A sustainable governance model for smallholder banana farmers cooperatives was supposed to be based on diverse stakeholders including cooperative members, cultural, environmental, private sector, government-supporting, and NGO stakeholders. The model fosters participation, transparency, and accountability among members, leading to improved decision-making and operational effectiveness. The model adopts sustainable means of production to enhance economic feasibility and sustainability of the cooperative in the long term. Future studies are needed to address appropriate governance structures to empower members and ensure sustainability in other fruits.
Summary
Source-checkedPlain-language reading of the full paper, prepared with AI and checked against the text. Each point links to the authors' own words.
Why it matters
- Banana cooperatives in Zimbabwe's Mutasa area have seen a drastic decline, dropping from 14 operational cooperatives in 1998 to only 2 by 2025, largely due to internal conflicts. View evidence ↗
- Dwindling production output in these cooperatives has created concerns regarding the long-term sustainability of both the organizations and the smallholder farmers who rely on them. View evidence ↗
- Poor corporate governance is identified as a primary reason why many agricultural cooperatives fail to achieve their intended purposes. View evidence ↗
The question
- The study aimed to analyze four key governance pillars in banana cooperatives: transparency, accountability, stakeholder care, and long-term orientation. View evidence ↗
- The researchers sought to develop a specific governance model for banana cooperatives in the Mutasa District to improve their overall performance. View evidence ↗
What they did
- The study collected data from 140 smallholder banana farmer household heads from the Pahasha and Murara cooperatives in Zimbabwe's Mutasa district. View evidence ↗
- Using Slovin's Formula, the researchers determined a final sample size of 104 participants from the total population of 140. View evidence ↗
- Quantitative primary data was gathered using a structured questionnaire administered to the farmers. View evidence ↗
- The data was analyzed using SPSS version 23, employing both descriptive and inferential statistical methods. View evidence ↗
What they found
- Most members perceived a decrease in production output over the past year, with a mean score of 1.1184 and a mode of 1. View evidence ↗
- The cooperatives were viewed as financially unhealthy by most members, indicated by a mean score of 1.2763 and a mode of 1.00. View evidence ↗
- Personal profits were low, with a mean score of 1.1184 and a mode of 1.00, representing earnings between $0 and $500 per full season. View evidence ↗
- Leadership roles and duties were perceived as ambiguous, with an average score of 2.5395. View evidence ↗
- Stakeholder involvement was poor across most metrics, including opportunities to express concerns (mean=1.1974), meeting frequency (mean=1.2368), and contribution recognition (mean=1.3289), despite a moderate score for decision fairness (mean=3.4342). View evidence ↗
- Sustainability efforts were rated very low, with mean scores for member education (1.5263), resource management (1.7368), environmental protection (1.6447), and long-term planning (1.2237) all showing a mode of 1.00. View evidence ↗
- Cooperatives lacked long-term orientation, with low mean scores for prioritizing sustainability (1.2763), member strategy participation (1.1447), objective transparency (1.1974), and performance assessment (1.1974). View evidence ↗
What it means
- The authors conclude that improving transparency, accountability, stakeholder engagement, and long-term orientation are essential for enhancing the performance of smallholder banana cooperatives. View evidence ↗
- The authors recommend focusing on leadership to establish strong governance that empowers members and ensures sustainability. View evidence ↗
- The authors state that future research is required to determine appropriate governance structures for other fruit-growing cooperatives to ensure member empowerment and sustainability. View evidence ↗
Visual summary
1 visualsIllustrations explain the paper; they do not show study data.
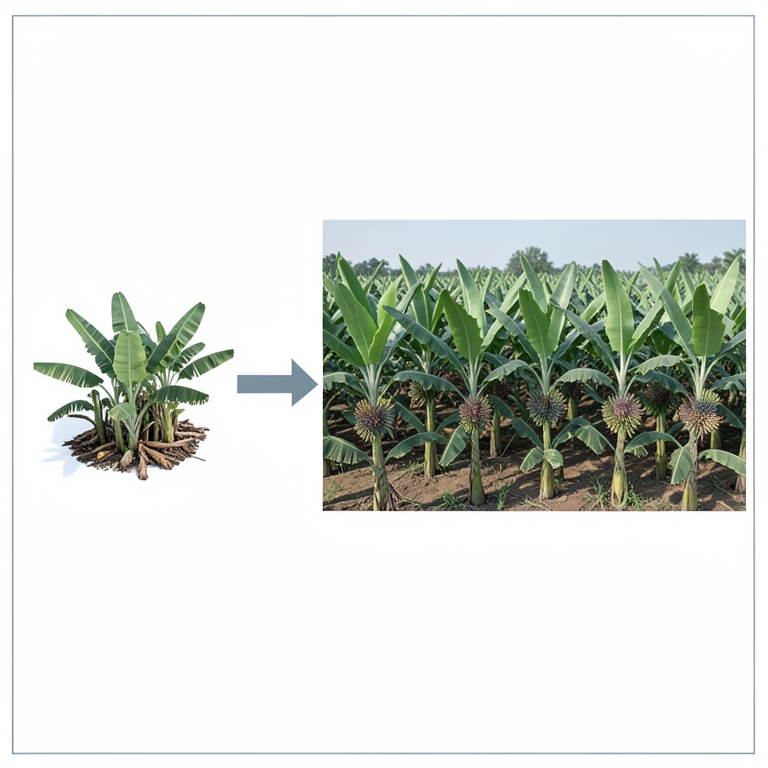
Governance Improvement Framework
AI-generated conceptual illustration (smallholder banana plants in a cooperative farm setting). It explains the idea and does not show study data.
View source evidence ↗Figures & tables
From the original paper Table 1
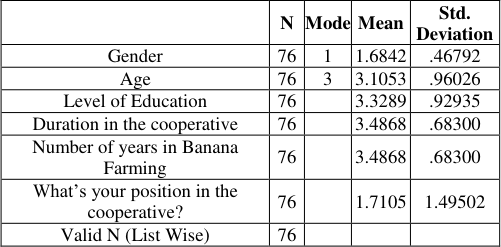 Table 2
 Table 3
 Table 4
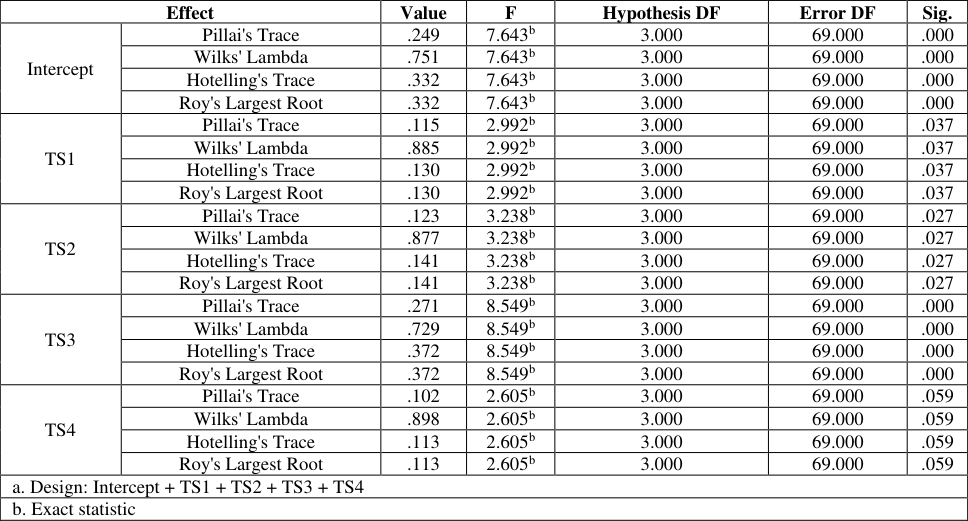 Table 5
 Table 6
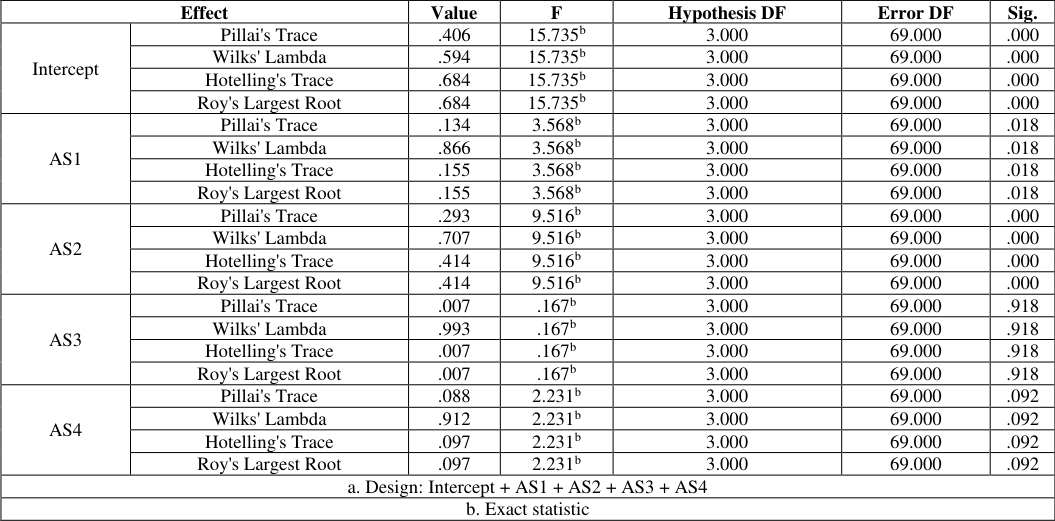 Table 7
 Table 8
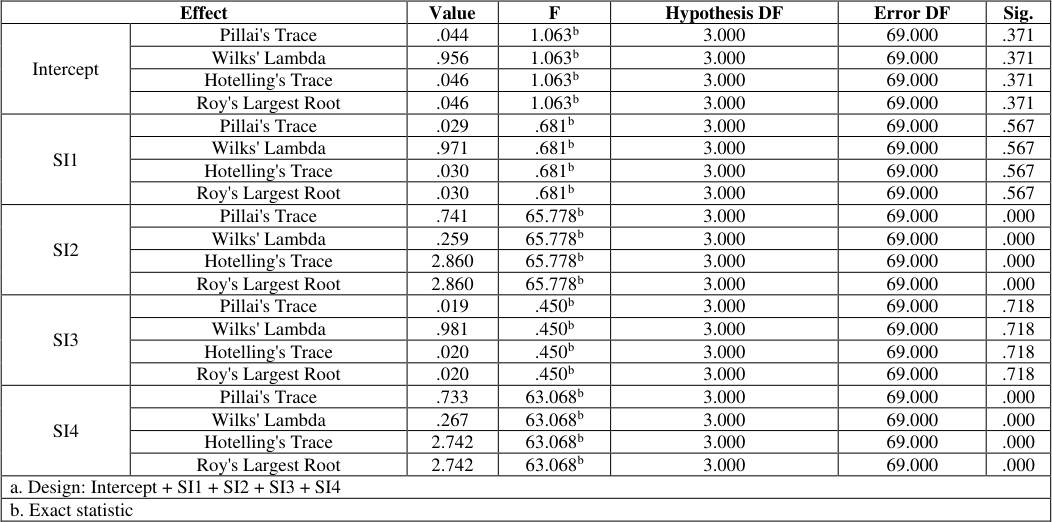 Table 9
 Table 10
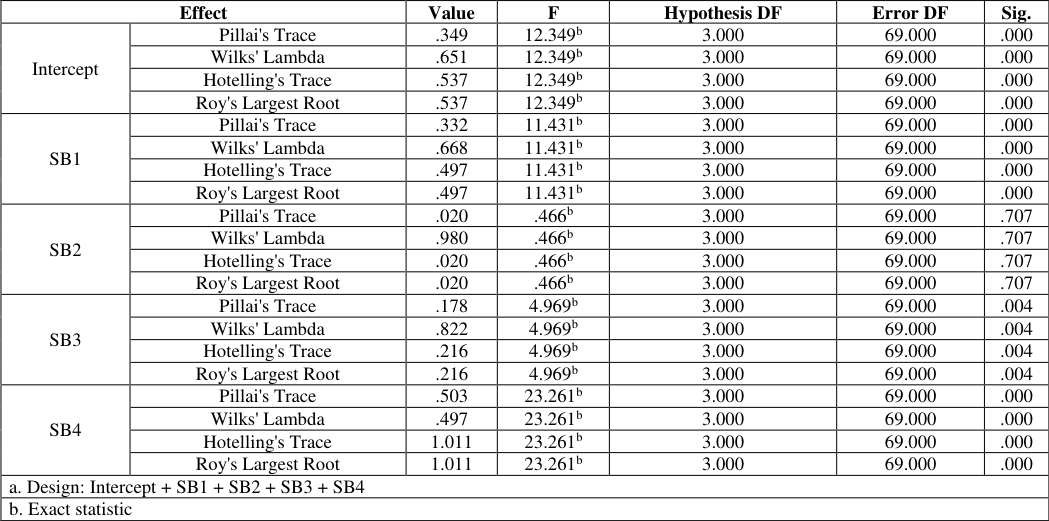 Table 11
 Table 12
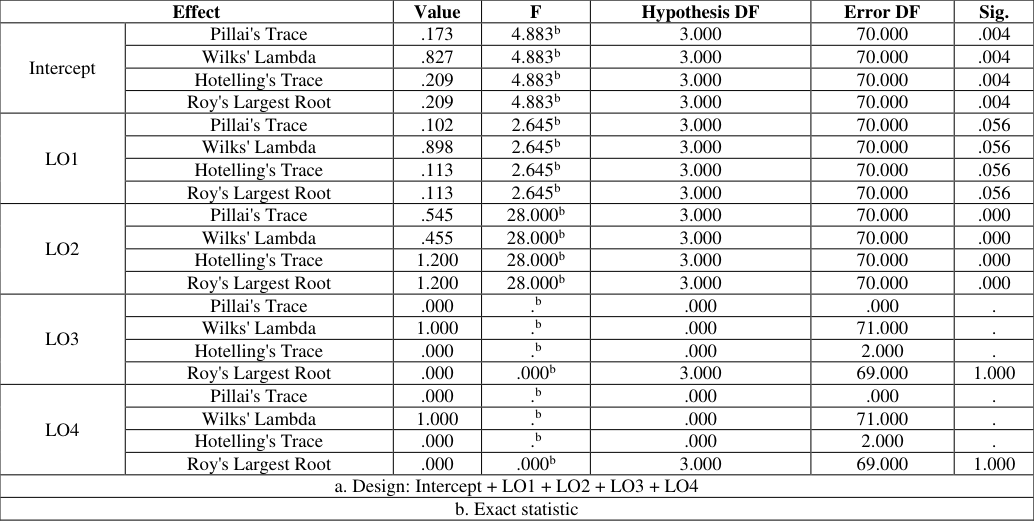 Table 13
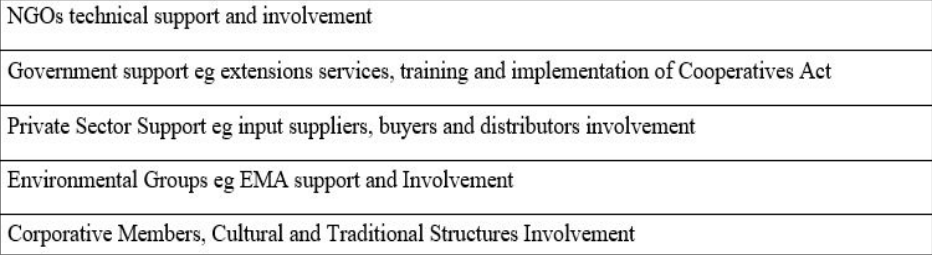 Figure 1
Introduction
Scholars such as Chikozho (2020) [8] , Munyai and Ramokhantsho (2021) [26] , Addai, Temoso, and Ng'ombe (2022) [1] and Matangaidze, Musara, Chapwanya and Nyamushamba (2022) [22] , highlight opportunities for cooperatives to improve the voice, capacity, resources, and power of smallholder farmers in their respective value chains. However, there is no corporate governance framework addressing banana smallholder farming tailored to the problems they face. Addai, Temoso & Ng'ombe (2022) [1] further describes cooperatives as Principles of accountability, participation, sustainability, transparency, fairness, responsibility, integrity, and professionalism are applied to ensure the effectiveness of corporate governance, hence, ensuring that cooperatives operate efficiently and sustainably (Di Marcantonio, Havari, Colenm & Ciaian, 2022) [14] . This is in line with the stakeholder theory, where it emphasizes the importance of protecting the interests of stakeholders. These principles have dual objectives of protecting members' interests, while also promoting the cooperative's credibility and performance in the larger market (Adekoya et al., 2023) [3] . The cooperative movement has had mixed success internationally. Independent of the cooperative identification at the level of the geographical or cultural typologies, in Europe and North America, cooperative governance has often been aided by the availability of robust governance frameworks, associated with higher performance metrics and satisfaction among members (Gava, Ardakani, Delalić, Azzi & Bartolini, 2021) [16] . On the other hand, cooperatives in the developing areas continue to face challenges related to mismanagement, lack of transparency, and poor membership involvement. Contexts of broad global dynamics are critical to this understanding in analysis of the specific challenges cooperatives face in Africa (Munyai & Ramokhantsho, 2022) [27] . The cooperative movement in Africa has a deep-rooted history, initially formed to address economic issues faced by rural communities and promote self-sufficiency. As such, the failure of corporate governance greatly limits the role and effectiveness of many African cooperatives. For example, studies indicate poor governance is a major barrier to the success of agricultural cooperatives across Africa (International Labour Organization (ILO), 2022) [18] . Studies indicate that African cooperatives grapple with factors like poor training, marginal funding, and government meddling. Many cooperatives lack organized systems of governance, resulting in poor performance and a lack of member satisfaction (ILO, 2022) [18] . Moreover, the lack of participation, transparency, and accountability has led to the misuse of funds and resources, which undermines the cooperative's objective (Liang, Bai, Jin & Fu, 2023). Such evidence points towards the need to place corporate governance practices more firmly on the agenda toward improving cooperative performance in Africa. In the context of political and economic instability, the cooperative movement in Zimbabwe has seen several transformations. The agricultural cooperatives have been deeply impacted, including through land reform and persistent economic crises (Mavhunga, 2023) [23] . Evidence suggests a powerful connection exists between governance functions and the efficiency of these cooperatives (Adedeji, Adedeji, Ong, Uzir, 2020, Boateng, Boateng, Wang, Ntim, 2021 [5] , Dak-Adzaklo, Dak-Adzaklo, & Wong, 2024) [12] . Yet, according to the Zimbabwe National Statistics Agency (ZIMSTAT, 2023) more than 60% of agricultural cooperatives were characterised by low productivity levels partly as a result of poor governance. Moreover, many cooperatives are financially unsustainable, with a significant proportion in loss (Nyanguru, 2022) [29] . Approximately 90% of cooperatives are failing to carry out their financial obligations which has reduced the trust and participation in the cooperative system as highlighted by the Zimbabwe Farmers Union (2023).
Banana is produced in most parts of Zimbabwe; however, the majority comes from the Manicaland region (70% of total output in Mutasa District). There were 14 fully operational banana cooperatives in Mutasa in 1998, but only 2 still exist today and they are mostly operating in name only as disputes among members remain (Munyai & Ramokhantsho, 2021) [26] . This consequently led to a steady decline in banana production (Munyai & Ramokhantsho, 2021) [26] . This scenario highlights the importance of conducting a comprehensive review of governance practices (Chikozho, 2020). The Cooperatives Act of Zimbabwe is important for the governance of Cooperatives but has several shortcomings which impede the effective running of cooperatives (Matangaidze, Musara, Chapwanya, & Nyamushamba, 2022) [22] . Enforcement has been a major issue, as weak provisions often result in cooperatives just ignoring the regulations altogether while excessively prescriptive guidelines do not allow cooperatives the necessary flexibility (Chikozho, 2020) [8] . Moreover, poor training and capacity building render the members less able for effective management. In addition, the Act is commonly not successful at guaranteeing fair representation of marginalized groups, which foils power dynamics (Matangaidze, Musara, Chapwanya, & Nyamushamba, 2022) [22] . Moreover, it does not necessarily promote sustainability, while its complex registration process is a barrier for new cooperatives (Munyai & Ramokhantsho, 2021) [26] . Similarly, existing cooperatives are challenged in attaining economic sustainability due to a lack of financial support systems. Together, these weaknesses erode the potential of the cooperative movement in empowering members and building communities in Zimbabwe (Matangaidze, Musara, Chapwanya & Nyamushamba, 2022), [22] . This research is guided by the Triple Bottom Line Theory and Stakeholder Theory. The Triple Bottom Line Theory emphasizes the need for a balance of economic, social and environmental outcomes, which is critical in the sustainability of cooperatives (Addai, Temoso & Ng'ombe, 2022) [1] . This theory can be applied to evaluate whether banana cooperatives have a level of economic empowerment but still must be measured against social and environmental impact (Di Marcantonio, Havari, Colenm and Ciaian, 2022) [14] . Stakeholder Theory, in contrast, requires stakeholder involvement in governance processes. This theory underpins exploring how effective stakeholder engagement can improve governance practices and cooperative performance (Gava, Ardakani, Delalić, Azzi & Bartolini, 2021) [16] . Although there is a vast existing body of literature on cooperative governance, there are still substantial gaps, especially in the case of Zimbabwean cooperatives. In Mutasa District, there are no empirical studies that specifically considered governance challenges facing banana cooperatives. Moreover, the dynamics between governance practices and the sustainability of functioning cooperatives remains to be explored. This study, therefore, sought to fill these gaps through a governance model in banana cooperatives in Mutasa District in Zimbabwe for enhanced performance.
The following hypothesis were formulated; H1: Transparency in smallholder banana cooperatives significantly impact their performance H2: Accountability in smallholder banana cooperatives significantly impact their performance. H3: Stakeholder involvement in smallholder banana cooperatives significantly impact their performance. H4: Sustainability in smallholder banana cooperatives significantly impact their performance. H5: Longterm orientation in smallholder banana cooperatives significantly impact their performance.
Research Methodology
The research philosophy used in this study was epistemology focusing on the positivism research paradigm as it concentrated on the usage of quantitative data.
Deductive research philosophy was used as the study was underpinned on existing theories that include Triple Bottom Line Theory and Stakeholder Theory. A mono research method was adopted focusing on the questionnaire survey.
The explanatory research design helped to inform the study on how the intricacies of governance practices within the banana value chain affect cooperatives' performance. Data from 140 heads of households of smallholder banana farmers was collected. Selected farmers were drawn from the Pahasha and Murara cooperatives from the Mutasa district of Zimbabwe. Slovin's Formula was then used to calculate the sample size for which the population of 140 population elements was then reduced to 104 sample elements. This formula was especially useful because it considered the required level of precision and the size of the population (Creswell, 2009) [9] . Pahasha and Murara Cooperatives members formed the study. A stratified random sampling methodology was used to enable proportional representation from the two cooperatives (Bryman, 2006) [7] . Primary data was collected from a structured questionnaire. Data were collected from farmers using a structured questionnaire which enabled quantitative data collection for statistical analysis. Additional data were collected from secondary sources, such as government, cooperatives and NGO reports.
Quantitative data was analysed with the IBM Statistical Package for Social Sciences (SPSS) version 23 using descriptive and inferential statistics. This provided a statistical approach to finding trends and relationships in the data (Engel & Schutt, 2014) [15] . The study was conducted according to ethical principles including informed consent, voluntary participation, ensuring protection against any harm, confidentiality and data security. All participants were fully informed of the nature and procedures of the study prior to consent to participate in order to ensure informed decision making (Creswell, 2013) [10] . Additionally, participation was completely voluntary, and not coercive; participants were not subject to any physical or psychological harm. Information about participants were treated confidentially, and arrangements were made to protect the information collected in the study (Gibbs, 2001) [17] .
Data Presentation and Findings
The reliability of the questionnaire used in this study was assessed using Cronbach's Alpha, which yielded a value of 0.891 as presented on Of the 76 participants, there was a slight male predominance with overall mean gender score of 1.6842 and mode of 1. This is consistent with the literature that documents gender differences in agricultural cooperatives, where men tend to have more favorable work positions than women. Gender imbalances in cooperatives can impact decision-making processes and the distribution of resources, which in turn may constrain women's engagement in agricultural practices. With a mode of 3 and mean score of 3.1053, it shows that most participants were in the 31-40 years age range group. This demographic observation is a clear sign of relatively younger membership of cooperatives. The youth membership was essential for the sustainability of agricultural practices. Many studies indicate that youth are more willing to embrace new farming practices and technologies, which could lead to higher productivity and adaptability to climate change. In terms of educational attainment, the mode was 3 and mean value was 3.3289. This means that majority of respondents had secondary qualifications. Limited number of respondents had tertiary qualifications. In general, it is assumed that higher educational levels among the cooperative members can contribute to improved agricultural practices, access to information and output, hence increased income (Mugwisi et al., 2014) [25] . Looking at the members in the cooperative, the average time spent in a cooperative was much longer with a mean score of 3.4868 and mode of 3. This means that respondents have been in excursion of banana farming for relatively longer period of time, often 5-10 years. This helps them to better understand the cooperative and its requirements in terms of the agricultural practices, which can be another step towards making the cooperative a success (Toringepi, 2016) [30] . Finally, the mean score for position in the cooperative is 1.7105 and the mode was 1, showing that most respondents were cooperative members rather than those in leadership roles. This distribution shows that there was a need for capacity-building efforts that would enable more members to assume leadership roles, thereby enhancing governance and operational effectiveness within the cooperatives (Majoma, 2016) [21] .
Performance of smallholder's banana farmer's cooperatives: Insights into smallholder banana farmer's perceptions of the cooperatives' performance are shown in Table 3. The table shows a lot of important things about cooperative performance such as output, financial status, and satisfaction from product quality, and personal profit from banana planting. Table 3 presents respondents' perception of performance of their cooperatives. The average score for the question, 'Has the cooperative's production output increased, decreased, or remained the same over the past year'? is 1.1184. The mode was 1 which meant majority of respondents perceived production output as decreasing. Such perception is worrying as an increase in production is key to enhancing the livelihoods of smallholder farmers and achieving food. With the standard deviation of 0.32525, the responses have little variability, suggesting the agreement among members regarding the declining production level. When it came to financial condition, the mean score stood at 1.2763 and mode was 1.00 which means that most members saw their cooperative as financially unhealthy. This situation changes how members view their involvement in the cooperative. This impacts their trust and investment in its activities and interactions, considering that a lack of financial stability signifies limited access to resources, support and opportunities (Mugwisi et al., 2014) [25] . While 0.45015 indicates some variance in perception, the general trend suggests general unease with the cooperative's financial viability. With regard to perception on quality of bananas produced by cooperative members, the average score was 2.6711, which was a better comparative perception against previous indicators. Yet given the mode of 1.00 it was noted that many of the respondents have yet to feel satisfied with the quality of the bananas. A standard deviation of 1.41787 indicates a greater level of variance in terms of satisfaction levels, as such one group of members may be satisfied while another group is not. This signals the varying backgrounds, experiences and expectations of product quality (Moyo & Salawu, 2018) [24] . The mean score for individual profit gained from banana farming was 1.1184, which confirms the perception of production output. The low score means the respondents think they had not earned much profit from banana farming under cooperation. While the mode of 1.00 ($0-$500 per full season) further vindicates this feeling, as it indicates that many are not achieving financial benefits from their membership in the cooperative. Such non-profitability can cause disillusion among members and negatively affect their will to engage in cooperative activities (Toringepi, 2016) [30] .
| — | Has the cooperative's production output increased, decreased, or remained the same over the past year? | How would you rate the financial health of your cooperative? | How satisfied are you with the quality of bananas produced by your cooperative? | At personal level, how much profit have you made from banana farming in the past year working in a cooperative? |
|---|---|---|---|---|
| Mean | 1.1184 | 1.2763 | 2.6711 | 1.1184 |
| Mode | 1.00 | 1.00 | 1.00 | 1.00 |
| Std. Deviation | .32525 | .45015 | 1.41787 | .32525 |
Table text extracted from the original PDF; superscript letters are shown inline. The original table image is below.
View original table image
Assessing transparency in smallholder banana cooperatives
This section evaluates respondents' perception on transparency in cooperatives focusing the sharing of roles, decision making process, records management and information management. Table 4 presents the descriptive statistics. Results for the smallholder banana cooperatives uncovered key findings about transparency. The mean scores for the transparency-imputing questions were as follows, the report of financial disclosure (mean=3.7368 & mode=4), transparency in decision-making (mean=3.9079, mode=4), access to records (mean=1.8421, & mode 1) and number of updates sent about the cooperative (mean=1.3158, mode=1). The mean scores for sharing financial reports and clarity of decision-making, are relatively high, suggesting that members feel relatively well informed of the cooperative's activities. Nevertheless, the low mean scores for record accessibility and updates highlight considerable communication and transparency gaps that coincide with findings from prior studies that suggest that transparency is critical in facilitating enhanced cooperative performance (Di Marcantonio et al., 2022) [14] . Multivariate tests are identified in Table 5. Significant results were found on the multivariate tests in the analysis of how transparency affect performance of cooperatives. For the Pillai's Trace statistic for the intercept, the value was 0.249 with significance level of 0.000, which showed a strong overall effect. In particular, the TS1, TS2, TS3, and TS4 transparency items were found to be statistically significant, where TS1 (the ability to share financial reports) and TS2 (transparency in decisionmaking) reached the p<0.05 level. This indicates that these components of transparency were necessary to improve performance of smallholder banana cooperatives. These findings align with the literature which suggest that transparency creates trust and engagement among members of a cooperative, ultimately leading to improved operational efficiency (Adekoya et al., 2023) [3] .
| Effect | — | Value | F | Hypothesis DF | Error DF | Sig. |
|---|---|---|---|---|---|---|
| Intercept | Pillai's Trace | .249 | 7.643b | 3.000 | 69.000 | .000 |
| Wilks' Lambda | .751 | 7.643b | 3.000 | 69.000 | .000 | |
| Hotelling's Trace | .332 | 7.643b | 3.000 | 69.000 | .000 | |
| Roy's Largest Root | .332 | 7.643b | 3.000 | 69.000 | .000 | |
| TS1 | Pillai's Trace | .115 | 2.992b | 3.000 | 69.000 | .037 |
| Wilks' Lambda | .885 | 2.992b | 3.000 | 69.000 | .037 | |
| Hotelling's Trace | .130 | 2.992b | 3.000 | 69.000 | .037 | |
| Roy's Largest Root | .130 | 2.992b | 3.000 | 69.000 | .037 | |
| TS2 | Pillai's Trace | .123 | 3.238b | 3.000 | 69.000 | .027 |
| Wilks' Lambda | .877 | 3.238b | 3.000 | 69.000 | .027 | |
| Hotelling's Trace | .141 | 3.238b | 3.000 | 69.000 | .027 | |
| Roy's Largest Root | .141 | 3.238b | 3.000 | 69.000 | .027 | |
| TS3 | Pillai's Trace | .271 | 8.549b | 3.000 | 69.000 | .000 |
| Wilks' Lambda | .729 | 8.549b | 3.000 | 69.000 | .000 | |
| Hotelling's Trace | .372 | 8.549b | 3.000 | 69.000 | .000 | |
| Roy's Largest Root | .372 | 8.549b | 3.000 | 69.000 | .000 | |
| TS4 | Pillai's Trace | .102 | 2.605b | 3.000 | 69.000 | .059 |
| Wilks' Lambda | .898 | 2.605b | 3.000 | 69.000 | .059 | |
| Hotelling's Trace | .113 | 2.605b | 3.000 | 69.000 | .059 | |
| Roy's Largest Root | .113 | 2.605b | 3.000 | 69.000 | .059 | |
| a. Design: Intercept + TS1 + TS2 + TS3 + TS4 | ||||||
| b. Exact statistic |
Table text extracted from the original PDF; superscript letters are shown inline. The original table image is below.
View original table image
| — | How often does your cooperative share financial reports with members? | Do you feel that the decision- making processes within your cooperative are transparent? | How accessible are the cooperative's records to members? | How often do you receive updates about the cooperative's activities? |
|---|---|---|---|---|
| Mean | 3.7368 | 3.9079 | 1.8421 | 1.3158 |
| Mode | 4.00 | 4.00 | 1.00 | 1.00 |
| Std. Deviation | 1.19296 | 1.15675 | 1.12015 | .46792 |
Table text extracted from the original PDF; superscript letters are shown inline. The original table image is below.
View original table image
Transparency is therefore key to the governance of smallholder banana cooperatives in Zimbabwe. The questionnaire has strong reliability, but findings show there is room for improvement, particularly with regards to how accessible records are and how updates are communicated. This knowledge is fundamental for creating a corporate governance model that can provide better performance and sustainability for these cooperatives.
Assessing accountability in smallholder banana cooperatives
The analysis of mechanisms of accountability in smallholder banana cooperatives offer valuable insights for their governance and performance. Descriptive statistics are provided in Table 6. The average score of cooperative leaders' clarity of roles and duties was 2.5395; the frequency with which leaders were held accountable was 3.5789; the average score of whether members could question decisions made by leaders was 3.9474; the average score of whether leaders effectively addressed grievances was 4.0132. These scores reveal an important discrepancy in governance. The average score for clarity of roles (2.5395) implies that members find leadership role definitions to be somewhat ambiguous, but accountability (3.5789) and grievance handling (4.0132) have relatively good scores.
| — | How clearly are the roles and responsibilities of cooperative leaders defined? | How often are cooperative leaders held accountable for their actions and decisions? | Do you believe that members can question the decisions made by cooperative leadership? | How effectively does your cooperative address grievances or complaints from members? |
|---|---|---|---|---|
| Mean | 2.5395 | 3.5789 | 3.9474 | 4.0132 |
| Mode | 2.00 | 5.00 | 4.00 | 4.00 |
| Std. Deviation | .94433 | 1.50787 | .90767 | .87168 |
Table text extracted from the original PDF; superscript letters are shown inline. The original table image is below.
View original table image
The mode values provide useful contextual information, especially for accountability and grievance areas where responses were 5.00 (high accountability) and 4.00 (effective grievance handling), with this mode being very useful information for this study. Now while there is an acknowledgement of accountability mechanisms, clarity in leadership role is seen as a major concern. Furthermore, the wide variations are indicated by standard deviations and, for the question on whether the leaders are accountable standard deviation of 1.50787 show members' views differ on this aspect of governance, Table 7 shows Multivariate Tests. The multivariate tests offer further insights into the interrelationships among the accountability factors. The aggregate intercept has a substantial Pillai's Trace value of 0.406 with a significance level of 0.000, signifying pronounced impacts across the accountability components. The research indicates that the clarity of responsibilities (AS1) and the frequency of leader responsibility (AS2) are statistically significant factors influencing cooperative performance, with significance values of 0.018 and 0.000, respectively. The capacity of members to challenge decisions (AS3) did not provide significant findings (P=0.918), indicating that respondents may not regard this as a crucial element of accountability. The efficacy of grievance addressing (AS4) neared significant (P=0.092) but did not attain conventional standards. This discovery corresponds with prior work, which underscores the significance of defined roles and accountability systems in improving cooperative governance and member satisfaction (Gava et al., 2021) [16] . The results of this analysis resonate with existing research that underscores the necessity for clear governance frameworks in cooperatives. According to Di Marcantonio et al. (2022) [14] , clarity in roles within cooperative leadership is fundamental to fostering accountability and reducing conflicts among members. Moreover, effective grievance mechanisms are critical for maintaining member engagement and trust (Adekoya et al., 2023) [3] . The findings suggest that while cooperative members feel that their leaders are generally held accountable and that grievances are addressed, there remains a crucial gap in clarity regarding leadership roles. The assessment of accountability in smallholder banana cooperatives reveals both strengths and weaknesses in governance practices. While there is a positive perception of accountability and grievance handling, the lack of clarity in leadership roles poses a challenge that could hinder cooperative effectiveness. Addressing this gap is essential for enhancing the overall governance framework, fostering member engagement, and ultimately improving the performance of these cooperatives.
| Effect | — | Value | F | Hypothesis DF | Error DF | Sig. |
|---|---|---|---|---|---|---|
| Intercept | Pillai's Trace | .406 | 15.735b | 3.000 | 69.000 | .000 |
| Wilks' Lambda | .594 | 15.735b | 3.000 | 69.000 | .000 | |
| Hotelling's Trace | .684 | 15.735b | 3.000 | 69.000 | .000 | |
| Roy's Largest Root | .684 | 15.735b | 3.000 | 69.000 | .000 | |
| AS1 | Pillai's Trace | .134 | 3.568b | 3.000 | 69.000 | .018 |
| Wilks' Lambda | .866 | 3.568b | 3.000 | 69.000 | .018 | |
| Hotelling's Trace | .155 | 3.568b | 3.000 | 69.000 | .018 | |
| Roy's Largest Root | .155 | 3.568b | 3.000 | 69.000 | .018 | |
| AS2 | Pillai's Trace | .293 | 9.516b | 3.000 | 69.000 | .000 |
| Wilks' Lambda | .707 | 9.516b | 3.000 | 69.000 | .000 | |
| Hotelling's Trace | .414 | 9.516b | 3.000 | 69.000 | .000 | |
| Roy's Largest Root | .414 | 9.516b | 3.000 | 69.000 | .000 | |
| AS3 | Pillai's Trace | .007 | .167b | 3.000 | 69.000 | .918 |
| Wilks' Lambda | .993 | .167b | 3.000 | 69.000 | .918 | |
| Hotelling's Trace | .007 | .167b | 3.000 | 69.000 | .918 | |
| Roy's Largest Root | .007 | .167b | 3.000 | 69.000 | .918 | |
| AS4 | Pillai's Trace | .088 | 2.231b | 3.000 | 69.000 | .092 |
| Wilks' Lambda | .912 | 2.231b | 3.000 | 69.000 | .092 | |
| Hotelling's Trace | .097 | 2.231b | 3.000 | 69.000 | .092 | |
| Roy's Largest Root | .097 | 2.231b | 3.000 | 69.000 | .092 | |
| a. Design: Intercept + AS1 + AS2 + AS3 + AS4 | ||||||
| b. Exact statistic |
Table text extracted from the original PDF; superscript letters are shown inline. The original table image is below.
View original table image
Assessing stakeholder involvement in smallholder banana cooperatives
This section presents stakeholder involvement in banana cooperatives. The descriptive statistics indicate varied perceptions among members regarding the fairness of decisions, stakeholders highlighting their concerns, stakeholder involvement in meetings and contribution of stakeholders. Table 7 presents descriptive statistics. The average scores for questions pertaining to stakeholder involvement were as follows: fairness in decision-making (mean=3.4342), opportunities for stakeholders to express concerns (mean=1.1974), frequency of stakeholder meetings (mean=1.2368), and acknowledgement of stakeholder contributions (mean=1.3289). The average score of 3.4342 for perceived fairness of choices signifies a modest degree of satisfaction among members. The markedly low ratings on opportunities to express issues and the frequency of stakeholder meetings indicate substantial deficiencies in engagement methods. The median values 3.00 for decisionmaking fairness and 1.00 for the remaining three items underscore that the majority of members perceive dissatisfaction with the existing methods for stakeholder engagement. Standard deviations show the variation in answers across members, especially regarding whether decisions were fair (1.06252), showing differences in opinions among members. Whereas the low standard deviations of stakeholder opportunities (0.40066) and meeting frequency (0.51299) point to an agreement regarding their insufficiencies. This coincides with literature that emphasizes effective stakeholder engagement as a determining factor in the sustainability and success of cooperatives (Gava et al., 2021) [16] . The overall intercept reveals a non-significant Pillai's Trace value of 0.044 (P=0.371), signifying an absence of a substantial overall influence across the constructs. Nonetheless, several items have substantial correlations. For example, the chances for stakeholders to express concerns (SI2) produced a Pillai's Trace value of 0.741, with a significance level of 0.000, signifying that this factor significantly influences cooperative performance. The acknowledgement of stakeholder contributions (SI4) demonstrated a substantial Pillai's Trace value of 0.733 (P=0.000). Conversely, the equity of decision-making (SI1) and the frequency of stakeholder meetings (SI3) had insignificant outcomes (P=0.567 and P=0.718, respectively). This indicates that although avenues for expressing concerns and acknowledging contributions are essential for stakeholder participation, the perceived equity and frequency of meetings require significant enhancement to increase overall engagement. These findings align with existing literature highlighting the significance of stakeholder involvement in cooperative mechanisms. Di Marcantonio et al. (2022) [14] states that active leading of the stakeholders in the decision-making process is important for the confidence and credibility of the cooperative. Moreover, Adekoya et al. (2023) [3] emphasises that this approach promotes a sense of ownership and commitment among members, which is crucial for success.
Assessing sustainability in smallholder banana cooperatives
This section presents findings on sustainability of smallholder banana cooperatives. The focus was on whether members were educated on sustainable farming practices, management of resources, practices to protect the environment and existence of long-term sustainability plans. The average score for the member education on sustainable farming practices question was 1.5263. The mode value from responses was 1.00, which indicated that they believed that there was a lack of sustainable education among cooperative members. A high standard deviation of 1.06425 suggests a wide range of responses, indicating that while some members received education, many remained unaware. Without sustainable practices taught through appropriate outreach, agricultural improvements will not be realized (Mugwisi et al., 2014) [25] .
Cooperative effectiveness in managing resources had mean value of 1.7368 The fact that the mode was 1.00 also suggests that respondents widely perceived that their cooperatives were not satisfactorily managing any of the resources such as water, soil-type and agricultural inputs. A standard deviation of 1.39875 also indicates a considerable variance in the responses with a considerable need for improving management practices for better sustainability in shorter and longer run.
The mean score was 1.6447, showing a negative attitude in terms of how cooperatives took part in self-protective practices for the environment. The mode was 1.00, indicating that many respondents felt their cooperatives did mot emphasize environmental protection. However, the standard deviation was 1.29310 indicating a diverse range of responses. While it was evident that other members were acknowledging positive practices, the overall rating demonstrated that the cooperatives needed to improve on their environmental stewardship (Moyo & Salawu, 2018) [24] . The mean score for the question regarding whether the cooperative had a long-term sustainability plan stood at 1.2237, indicating that this issue was also of a great concern among members. A low mean score and mode value of 1.00 suggest that most respondents felt that their cooperatives did not have coherent sustainability strategies. The standard deviation of 0.41948 indicates relatively little variability between responses compared to the other indicators, emphasizing that the majority believe that members were illequipped to face future issues regarding sustainability. The intercept values provide a very significant outcome (p<0.001), suggesting that the overall model accounts for a substantial portion of variance in sustainability judgements. Stakeholder Indicator 3 (environmental protection practices) and Stakeholder Indicator 4 (long-term sustainability plans) provide significant findings (p<0.004 and p<0.001, respectively), underscoring their essential roles in influencing perceptions of sustainability inside cooperatives. These findings underscore the necessity of deploying effective solutions for environmental conservation and formulating explicit sustainability goals to improve collaborative performance (Toringepi, 2016) [30] . The examination of Tables 10 and11 highlights considerable obstacles encountered by smallholder banana cooperatives in advancing sustainability. The respondents' perspectives reveal an urgent necessity for more education on sustainable agricultural techniques, improved resource management, and a dedication to environmental conservation. The lack of long-term sustainability planning raises worries over the cooperatives' readiness for future problems. Resolving these concerns is crucial for promoting sustainable farming practices that can improve the resilience and productivity of smallholder cooperatives.
Assessing long-term orientation in smallholder banana cooperatives
The Table 12 presents descriptive statistics on long-term orientation in smallholder banana cooperatives. The focus was on prioritising long-term sustainability over short term gains, strategising for the future, establishment of longterm goals and existence of longterm vision. The average scores for the long-term orientation-related enquiries were significantly low: emphasis on long-term sustainability over short-term benefits (mean=1.2763), member participation in formulating future strategies (mean=1.1447), transparency in articulating long-term objectives (mean=1.1974), and consistent assessment of performance relative to long-term vision (mean=1.1974). The persistently low averages suggest a widespread belief among members that cooperatives are insufficiently orientated towards long-term planning and sustainability. The median values of 1.00 for all questions further substantiate this conclusion, indicating that most respondents perceive an absence of commitment to longterm goals. The standard deviations were modest, varying from 0.35417 to 0.45015, suggesting an agreement among respondents on the insufficiency of long-term orientation in their cooperatives. This corresponds with current work emphasising the need of long-term strategic planning in improving the sustainability of agricultural cooperatives (Adekoya et al., 2023) [3] . The multivariate tests conducted offer meaningful insights in understanding the relationships between long-term orientation variables. The final results for long-term orientation also seem significant (Pillai's Trace=0.173, P=0.004, medium effect across the different constructs). Particularly, the involvement of members in developing strategies for future growth (LO2) resulted in a high Pillai's Trace of.545 and significant p-value (.000), indicating that this dimension is important for improving the long-term orientation of companies. In contrast, no significant results were found for the other constructs such as prioritisation of long-term sustainability (LO1) and communication of goals (LO3 and LO4) (P=0.056 and P=1.000, respectively). While there is progress so far towards member involvement in strategy which recognizes its importance, other important variables associated with long-term orientation remains with no significant impact at all. Findings of this study add to literature by reaffirming the imperative of long-term orientation for cooperatives governance. Di Marcantonio et al. [14] As noted in (2022), a long-term orientation is necessary to enable stability and sustainability when working in cooperatives across changing market circumstances. Involving members in the strategic planning process is also essential for ensuring ownership and commitment to the process (Gava et al., 2021) [16] . The evaluation of long-term orientation in smallholder banana cooperatives indicates considerable shortcomings in emphasising sustainability and including members in strategic planning. Despite some acknowledgement of the necessity for member engagement, the consistently poor ratings across all metrics highlight a significant deficiency in long-term strategic emphasis. Rectifying these International Journal of Agriculture and Food Science https://www.agriculturaljournals.com deficiencies is crucial for improving the sustainability and efficacy of these cooperatives moving forward.
| — | The cooperative prioritizes long-term sustainability over short-term gains | Members are actively involved in developing strategies for the future growth of the cooperative | Long-term goals and objectives are clearly communicated to all members of the cooperative | The cooperative regularly evaluates its performance in relation to its long-term vision |
|---|---|---|---|---|
| Mean | 1.2763 | 1.1447 | 1.1974 | 1.1974 |
| Mode | 1.00 | 1.00 | 1.00 | 1.00 |
| Std. Deviation | .45015 | .35417 | .40066 | .40066 |
Table text extracted from the original PDF; superscript letters are shown inline. The original table image is below.
View original table image
Conclusions
The perception of declining production output and financial health, with low expectations of personal profit, means that these cooperatives seem to fail at catering to their members' needs and expectations. Although there is a relatively better opinion regarding product quality, the returning response still points towards an urgent need for improvements in both cooperative management as well as support systems.
Findings of the study underscore the relevance of corporate governance practices in the context of smallholder banana cooperatives in Zimbabwe. The findings indicate that while members believe some financial reporting transparency exists, major gaps remain in record accessibility and communication. Research on accountability outcomes shows unclear boundaries of decision-making, hindering responsiveness and governance. This lack of stakeholder involvement confirms the hypothesis that active stakeholder involvement is key to cooperative success. In addition, the cooperatives tend to focus on short-term benefits rather than long-term objectives, highlighting the importance of strategic orientation. Sustainability plans were not longterm, there were no environmental protection practices. This study concludes that improving transparency, accountability, stakeholder engagement, and long-term orientation of cooperative members are reliable indicators of improving cooperative performance. By addressing these gaps, it will build trust and engagement among members and ensure the presence and sustainability of cooperatives in competitive conditions. Efforts going forth need to emphasize leadership for strong governance enabling member empowerment and sustainability. The proposed corporate governance model for smallholder banana farmers' cooperatives is shown in Figure 1. For a successful sustainable governance model for smallholder banana farmers' cooperatives, many stakeholders provide a solid foundation. At the very heart of the model are cooperative members themselves, who actively participate to ensure the cooperative is working towards their goals. This creates ownership and commitment that is necessary for the success of the cooperative. The cooperative is also influenced by cultural and traditional structures, which are critical to the cooperative's practices. Integration of local customs and values in the process creates a sense of belonging; resulting in higher participation and adherence to the principles of the cooperative. Cooperatives need to cooperate with the relevant government departments, environmental organizations including EMA, and the other societal actors in this governance framework. This process contributes to the longterm sustainability of the cooperative, as their advocacy for sustainability practices also integrates environmental considerations into the cooperative operations. The cooperative cannot afford to neglect the interests of its suppliers, its buyers, and its distributors. This can drive International Journal of Agriculture and Food Science https://www.agriculturaljournals.com supply chain efficiency and market access that all members in the economy can benefit from, providing better economic opportunity for the members themselves. Extension services, training, and other services offered by government significantly fortifies the cooperative. The government then advises the cooperative in legal matters and agriculture, thereby enhancing legitimacy within its operating practices. Additionally, NGOs contribute technical assistance and funding that allow cooperatives build capacity and implement sustainable practices more effectively. These basic building blocks shape how governance is carried out cooperatives. The inclusion of a variety of stakeholders in a cooperative lead to transparency, accountability, stakeholder involvement and long-term orientation which in turn creates trust between members and external partners ultimately leading to increased performance. Additionally, this necessitates transparent decision-making processes that reflect the interests of all stakeholders involved in order to strengthen accountability. However, having very well-defined roles for a leader and a member, rules that need to be followed, an understanding of what everyone will be doing, which conflicts can arise, how they will be resolved etc. help a lot in maximising the efficiency of a cooperative. Involving stakeholders in decision-making promotes collaboration and brings together varied viewpoints, allowing for more well-rounded and representative results. Input from environmental groups also allows the cooperative to embrace sustainable practices, which are increasingly valued in the marketplace today. By holding space for long-term sustainability, cooperatives forge pathways that meet immediate needs while creating a sustainable organisation for generations to come.
In the end, having these things together means good governance which has always been about transparency, accountability, and inclusivity. This sound governance framework is essential to engendering trust and collaboration amongst members and stakeholders. This enhances the performance of the cooperatives. In general, cooperatives are more resilient and able to respond to challenges, take advantage of opportunities and fulfill their economic objectives when their members are engaged, their decisions are transparent and when they prioritize sustainability.
Figures and tables from the paper
| — | N | Mode | Mean | Std. Deviation |
|---|---|---|---|---|
| Gender | 76 | 1 | 1.6842 | .46792 |
| Age | 76 | 3 | 3.1053 | .96026 |
| Level of Education | 76 | 3.3289 | .92935 | |
| Duration in the cooperative | 76 | 3.4868 | .68300 | |
| Number of years in Banana Farming | 76 | 3.4868 | .68300 | |
| What’s your position in the cooperative? | 76 | 1.7105 | 1.49502 | |
| Valid N (List Wise) | 76 |
Table text extracted from the original PDF; superscript letters are shown inline. The original table image is below.
View original table image
| — | How fairly do you believe decisions are made within your cooperative? | The cooperative provides adequate opportunities for stakeholders to voice their concerns and suggestions | Stakeholder meetings are held regularly, and attendance is encouraged and facilitated. | Stakeholders feel that their contributions are valued and recognized by the cooperative |
|---|---|---|---|---|
| Mean | 3.4342 | 1.1974 | 1.2368 | 1.3289 |
| Mode | 3.00 | 1.00 | 1.00 | 1.00 |
| Std. Deviation | 1.06252 | .40066 | .51299 | .78974 |
Table text extracted from the original PDF; superscript letters are shown inline. The original table image is below.
View original table image
| Effect | — | Value | F | Hypothesis DF | Error DF | Sig. |
|---|---|---|---|---|---|---|
| Intercept | Pillai's Trace | .044 | 1.063b | 3.000 | 69.000 | .371 |
| Wilks' Lambda | .956 | 1.063b | 3.000 | 69.000 | .371 | |
| Hotelling's Trace | .046 | 1.063b | 3.000 | 69.000 | .371 | |
| Roy's Largest Root | .046 | 1.063b | 3.000 | 69.000 | .371 | |
| SI1 | Pillai's Trace | .029 | .681b | 3.000 | 69.000 | .567 |
| Wilks' Lambda | .971 | .681b | 3.000 | 69.000 | .567 | |
| Hotelling's Trace | .030 | .681b | 3.000 | 69.000 | .567 | |
| Roy's Largest Root | .030 | .681b | 3.000 | 69.000 | .567 | |
| SI2 | Pillai's Trace | .741 | 65.778b | 3.000 | 69.000 | .000 |
| Wilks' Lambda | .259 | 65.778b | 3.000 | 69.000 | .000 | |
| Hotelling's Trace | 2.860 | 65.778b | 3.000 | 69.000 | .000 | |
| Roy's Largest Root | 2.860 | 65.778b | 3.000 | 69.000 | .000 | |
| SI3 | Pillai's Trace | .019 | .450b | 3.000 | 69.000 | .718 |
| Wilks' Lambda | .981 | .450b | 3.000 | 69.000 | .718 | |
| Hotelling's Trace | .020 | .450b | 3.000 | 69.000 | .718 | |
| Roy's Largest Root | .020 | .450b | 3.000 | 69.000 | .718 | |
| SI4 | Pillai's Trace | .733 | 63.068b | 3.000 | 69.000 | .000 |
| Wilks' Lambda | .267 | 63.068b | 3.000 | 69.000 | .000 | |
| Hotelling's Trace | 2.742 | 63.068b | 3.000 | 69.000 | .000 | |
| Roy's Largest Root | 2.742 | 63.068b | 3.000 | 69.000 | .000 | |
| a. Design: Intercept + SI1 + SI2 + SI3 + SI4 | ||||||
| b. Exact statistic |
Table text extracted from the original PDF; superscript letters are shown inline. The original table image is below.
View original table image
| — | Are members educated about sustainable farming practices? | How effectively does your cooperative manage its resources (e.g., water, soil, inputs) to ensure long-term sustainability? | To what extent does your cooperative engage in practices that protect the environment? | Do you believe that your cooperative has a long- term sustainability plan? |
|---|---|---|---|---|
| Mean | 1.5263 | 1.7368 | 1.6447 | 1.2237 |
| Mode | 1.00 | 1.00 | 1.00 | 1.00 |
| Std. Deviation | 1.06425 | 1.39875 | 1.29310 | .41948 |
Table text extracted from the original PDF; superscript letters are shown inline. The original table image is below.
View original table image
| Effect | — | Value | F | Hypothesis DF | Error DF | Sig. |
|---|---|---|---|---|---|---|
| Intercept | Pillai's Trace | .349 | 12.349b | 3.000 | 69.000 | .000 |
| Wilks' Lambda | .651 | 12.349b | 3.000 | 69.000 | .000 | |
| Hotelling's Trace | .537 | 12.349b | 3.000 | 69.000 | .000 | |
| Roy's Largest Root | .537 | 12.349b | 3.000 | 69.000 | .000 | |
| SB1 | Pillai's Trace | .332 | 11.431b | 3.000 | 69.000 | .000 |
| Wilks' Lambda | .668 | 11.431b | 3.000 | 69.000 | .000 | |
| Hotelling's Trace | .497 | 11.431b | 3.000 | 69.000 | .000 | |
| Roy's Largest Root | .497 | 11.431b | 3.000 | 69.000 | .000 | |
| SB2 | Pillai's Trace | .020 | .466b | 3.000 | 69.000 | .707 |
| Wilks' Lambda | .980 | .466b | 3.000 | 69.000 | .707 | |
| Hotelling's Trace | .020 | .466b | 3.000 | 69.000 | .707 | |
| Roy's Largest Root | .020 | .466b | 3.000 | 69.000 | .707 | |
| SB3 | Pillai's Trace | .178 | 4.969b | 3.000 | 69.000 | .004 |
| Wilks' Lambda | .822 | 4.969b | 3.000 | 69.000 | .004 | |
| Hotelling's Trace | .216 | 4.969b | 3.000 | 69.000 | .004 | |
| Roy's Largest Root | .216 | 4.969b | 3.000 | 69.000 | .004 | |
| SB4 | Pillai's Trace | .503 | 23.261b | 3.000 | 69.000 | .000 |
| Wilks' Lambda | .497 | 23.261b | 3.000 | 69.000 | .000 | |
| Hotelling's Trace | 1.011 | 23.261b | 3.000 | 69.000 | .000 | |
| Roy's Largest Root | 1.011 | 23.261b | 3.000 | 69.000 | .000 | |
| a. Design: Intercept + SB1 + SB2 + SB3 + SB4 | ||||||
| b. Exact statistic |
Table text extracted from the original PDF; superscript letters are shown inline. The original table image is below.
View original table image
| Effect | — | Value | F | Hypothesis DF | Error DF | Sig. |
|---|---|---|---|---|---|---|
| Intercept | Pillai's Trace | .173 | 4.883b | 3.000 | 70.000 | .004 |
| Wilks' Lambda | .827 | 4.883b | 3.000 | 70.000 | .004 | |
| Hotelling's Trace | .209 | 4.883b | 3.000 | 70.000 | .004 | |
| Roy's Largest Root | .209 | 4.883b | 3.000 | 70.000 | .004 | |
| LO1 | Pillai's Trace | .102 | 2.645b | 3.000 | 70.000 | .056 |
| Wilks' Lambda | .898 | 2.645b | 3.000 | 70.000 | .056 | |
| Hotelling's Trace | .113 | 2.645b | 3.000 | 70.000 | .056 | |
| Roy's Largest Root | .113 | 2.645b | 3.000 | 70.000 | .056 | |
| LO2 | Pillai's Trace | .545 | 28.000b | 3.000 | 70.000 | .000 |
| Wilks' Lambda | .455 | 28.000b | 3.000 | 70.000 | .000 | |
| Hotelling's Trace | 1.200 | 28.000b | 3.000 | 70.000 | .000 | |
| Roy's Largest Root | 1.200 | 28.000b | 3.000 | 70.000 | .000 | |
| LO3 | Pillai's Trace | .000 | .b | .000 | .000 | . |
| Wilks' Lambda | 1.000 | .b | .000 | 71.000 | . | |
| Hotelling's Trace | .000 | .b | .000 | 2.000 | . | |
| Roy's Largest Root | .000 | .000b | 3.000 | 69.000 | 1.000 | |
| LO4 | Pillai's Trace | .000 | .b | .000 | .000 | . |
| Wilks' Lambda | 1.000 | .b | .000 | 71.000 | . | |
| Hotelling's Trace | .000 | .b | .000 | 2.000 | . | |
| Roy's Largest Root | .000 | .000b | 3.000 | 69.000 | 1.000 | |
| a. Design: Intercept + LO1 + LO2 + LO3 + LO4 | ||||||
| b. Exact statistic |
Table text extracted from the original PDF; superscript letters are shown inline. The original table image is below.
View original table image
References
33 in the original paper- Addai KN, Temoso O, Ng'ombe JN. Participation in farmer organizations and adoption of farming technologies among rice farmers in Ghana. International Journal of Social Economics. 2022;49(4):529-545.
- Adedeji BS, Ong TS, Uzir MH, Abdul Hamid. Corporate governance and performance of medium sized firms in Nigeria: Does sustainability initiative matter? Corporate Governance: The International Journal of Business in Society. 2020;20(3):401-427.
- Adekoya A, Adebayo J, Okunoye A. Corporate governance in agricultural cooperatives: Enhancing performance through accountability and transparency. International Journal of Cooperative Management. 2023;45(2):102-118.
- Biesta G. Pragmatism and the philosophical foundations of education. Educational Philosophy and Theory. 2010;42(1):1-18.
- Boateng E, Boateng Y, Wang C, Ntim KW. National culture, corporate governance and corruption: A cross country analysis. International Journal of Finance & Economics. 2021;26:3852-3874.
- Braun V, Clarke V. Using thematic analysis in psychology. Qualitative Research in Psychology. 2006;3(2):77-101.
- Bryman A. Social research methods, 2 nd Ed. Oxford: Oxford University Press, 2006.
- Chikozho C. The role of corporate governance in the performance of smallholder agricultural cooperatives in Zimbabwe. African Journal of Agricultural Research. 2020;15(4):123-35.
- Creswell JW. Research design: Qualitative, quantitative, and mixed methods approaches. 3 rd Ed. Thousand Oaks (CA): Sage Publications, 2009.
- Creswell JW. Qualitative inquiry and research design: Choosing among five approaches. 3 rd Ed. Thousand Oaks (CA): Sage Publications, 2013.
- Creswell JW, Plano Clark VL. Designing and conducting mixed methods research. 2 nd Ed. Thousand Oaks (CA): Sage Publications, 2011.
- Adzaklo DW, Adzaklo DCSP, Wong RM. Corporate governance reforms, societal trusts, and corporate financial policies. Journal of Corporate Finance. 2024;84:102507.
- Dewey J. Experience and education. New York: Macmillan, 1938.
- Marcantonio DF, Havari E, Colen L, Ciaian P. Do producer organizations improve trading practices and negotiation power for dairy farms? Evidence from selected EU countries. Agricultural Economics. 2022;53(S1):121-137.
- Engel G, Schutt RK. The practice of research in social work. 3 rd Ed. Thousand Oaks (CA): Sage Publications, 2014.
- Gava O, Ardakani Z, Delalić A, Azzi N, Bartolini F. Agricultural cooperatives contributing to the alleviation of rural poverty: The case of Konjic (Bosnia and Herzegovina). Journal of Rural Studies. 2021;82:328339.
- Gibbs GR. Analyzing qualitative data. London: Sage Publications, 2001.
- International Labour Organization. Cooperative governance in Africa: Challenges and opportunities. Geneva: ILO, 2022.
- Kumar R, Reddy K. Governance principles and their impact on cooperative performance. Journal of Cooperative Studies. 2021;54(1):30-45.
- Liang Q, Bai R, Jin Z, Fu L. Big and strong or small and beautiful: Effects of organization size on the performance of farmer cooperatives in China. Agribusiness. 2023;39(1):196-213.
- Majoma M. Capacity building for cooperative leadership in Zimbabwe: Challenges and opportunities. African Journal of Business Management. 2016;10(3):45-52.
- Matangaidze R, Musara JP, Chapwanya A, Nyamushamba G. An analysis of governance factors influencing performance of selected smallholder dairy International Journal of Agriculture and Food Science https://www.agriculturaljournals.com cooperatives in Zimbabwe. Journal of Tropical Animal Health and Production. 2022;5:12-25.
- Mavhunga E. Strengthening governance in smallholder cooperatives: Challenges and strategies. Zimbabwe Journal of Business Management. 2023;12(1):45-60.
- Moyo S, Salawu A. Gender dynamics in agricultural cooperatives: A case study of Zimbabwe. Journal of Gender Studies. 2018;27(5):1-15.
- Mugwisi M, Chikozho C, Mavhunga E. The role of education in enhancing agricultural productivity among smallholder farmers in Zimbabwe. International Journal of Agricultural Economics and Extension. 2014;2(2):110.
- Munyai T, Ramokhantsho M. Governance structures in smallholder agricultural cooperatives: A case study of Zimbabwe. Journal of Cooperative Studies. 2021;54(1):30-45.
- Munyai T, Ramokhantsho M. Assessing governance structures in cooperatives: A comparative study. African Journal of Business Management. 2022;16(5):89-101.
- Novkovic S. Professionalism in cooperative governance. Journal of Cooperative Studies. 2020;53(2):12-25.
- Nyanguru A. Corporate governance and sustainability in smallholder farming: Evidence from Zimbabwe. International Journal of Sustainable Development. 2022;10(2):78-92.
- Toringepi W. Understanding the dynamics of cooperative membership and its impact on agricultural productivity in Zimbabwe. Journal of Cooperative Studies. 2016;49(1):23-30.
- Zhou G, Ndlela B. Impact of governance on agricultural productivity: A case of smallholder farmers in Zimbabwe. Journal of Agricultural Economics. 2021;14(3):200-15.
- Zimbabwe Farmers Union. Annual report on the state of cooperatives in Zimbabwe. Harare: ZFU, 2023.
- Zimbabwe National Statistics Agency (ZIMSTAT). Agricultural cooperatives performance report. Harare: ZIMSTAT, 2023.
Cited by 1
From OpenAlex, OpenCitations and reference lists read by Scinovex
- Corporate Financial Literacy as an organizational capability in worker cooperatives: evidence from MONDRAGON ↗
Oier Onaindia-Romero, Mónica Gago, Beñat Herce-Lezeta · International Review of Applied Economics · 2026
This study examines Corporate Financial Literacy in worker cooperatives, a business context in which democratic governance and collective ownership shape financial decision-making. Whilst prior research suggests that individual-level financial literacy and external contextual factors affect cooperatives in ways similar to other organizational forms, this study shows that substantial differences emerge at the corporate level. Through 22 semi-structured interviews, this research…
❝ 0PDF