
Research article · 2025 · Full text
International Journal of Biology SciencesA study on the accessibility and utilization of diverse mass media platforms by farmers in the District Lucknow (U.P.)
Volume 7(6) · Pages 385–386 · DOI: 10.33545/26649926.2025.v7.i6f.403 ↗
Research areasICT Impact and PoliciesMicrofinance and Financial InclusionCOVID-19 Pandemic Impacts
Abstract
Author-writtenThe purpose of this study was to ascertain how easily available and how farmers in the Uttar Pradesh, India, district of Lucknow used different mass media platforms. A representative sample of 100 farmers was surveyed, and they were split equally among 10 villages in the five blocks that were chosen (Malihabad, Mohanlalganj, Kakori, Gosainganj, and Sarojini Nagar). We collected data on their usage of agricultural information, including how frequently and for what purposes, as well as their availability of newspapers, radio, television, mobile apps, and the Internet. Despite the fact that nearly everyone had a cell phone, the findings indicated that conventional media like radio and television were still used significantly more frequently for agricultural information than digital platforms, particularly among older and less educated farmers. The utilization of digital media was hindered by limited internet connection and a lack of digital literacy. As to the results of the study, effective agricultural extension in Lucknow areas necessitates a comprehensive communication plan that tackles the digital divide and leverages the benefits of both conventional and digital media. These results have ramifications for extension organizations and legislators who want to maximize the dissemination of information to the farming community.
Summary
Source-checkedPlain-language reading of the full paper, prepared with AI and checked against the text. Each point links to the authors' own words.
Why it matters
- Agriculture serves as the primary industry in countries such as India. View evidence ↗
- Mass media is an effective tool for reducing information gaps by disseminating education and knowledge to large audiences. View evidence ↗
- Mass media helps rural residents and farmers solve problems, make decisions, and improve their overall standing. View evidence ↗
The question
- The study aimed to determine the availability and utilization of various mass media platforms by farmers in the Lucknow district of Uttar Pradesh, India. View evidence ↗
- The research sought to identify if media actively drives behavioral and economic changes in farming or if farmers are merely passive consumers. View evidence ↗
What they did
- The study initially surveyed 100 farmers distributed equally across 10 villages in five blocks: Malihabad, Mohanlalganj, Kakori, Gosainganj, and Sarojini Nagar. View evidence ↗
- The final investigation sample consisted of 120 respondents, selected randomly from four villages, specifically targeting those who owned smartphones. View evidence ↗
- Data collection focused on the availability and frequency of use of the internet, mobile apps, television, radio, and newspapers for agricultural information. View evidence ↗
What they found
- Mobile phone ownership was universal among the respondents, reaching 100%. View evidence ↗
- Television ownership was very high, reported at 97.5% of the respondents. View evidence ↗
- Other media ownership was lower: D.T.H. services (76.66%), newspapers (17.5%), radio (15.00%), computers (13.33%), agricultural books (8.33%), and magazines (1.66%). View evidence ↗
- Among digital platforms, WhatsApp was used occasionally by 51.66% of respondents and regularly by 34.16%. View evidence ↗
- Facebook was used occasionally by 45.83% of respondents and regularly by 31.66%. View evidence ↗
- Conventional media, such as television and radio, were used more frequently for agricultural information than digital platforms, especially by less educated and older farmers. View evidence ↗
What it means
- The authors conclude that comprehensive training is necessary to provide farmers with the skills to use mass media and design user-friendly agricultural content. View evidence ↗
- The authors recommend a communication plan for agricultural extension in Lucknow that addresses the digital divide by combining conventional and digital media. View evidence ↗
Visual summary
1 visualsIllustrations explain the paper; charts are replotted from the paper's own table values.
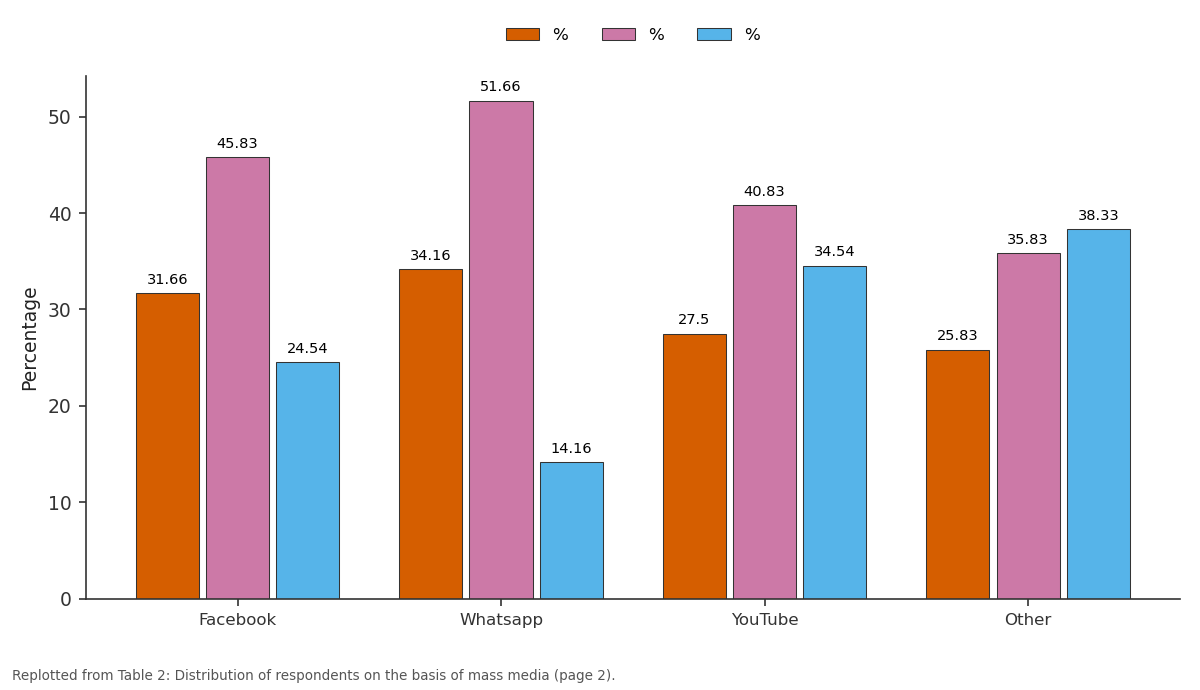
% and % and more: Facebook vs Whatsapp vs YouTube vs Other
Replotted from Table 2 (page 2) of the original paper. Every bar is the paper's own table value.
View source evidence ↗Figures & tables
From the original paper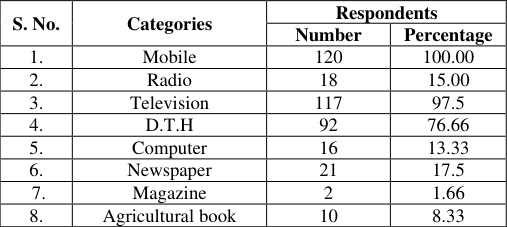 Table 1
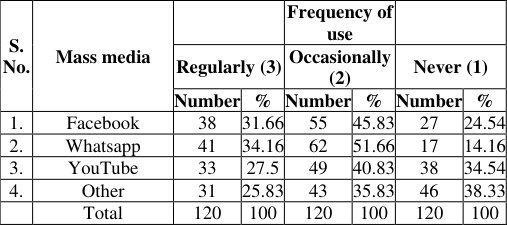 Table 2
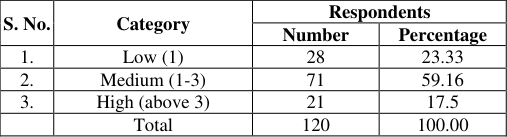 Table 2
Introduction
In nations like India, agriculture is the main industry. The mass media also has a significant impact on how people’s socioeconomic standing changes. The advent of digital technology has led to an increase in the activity of mass media. The most well-known source of news, opinions, and views with the ability to reach a large audience and disseminate knowledge and education, the mass media has become an effective weapon for closing the information gap.
It can also influence behavior, especially in rural areas where access to information is limited. Mass media includes several factors in which farmers and people are directly and indirectly influenced. It aids in decision-making, solves issues that farmers experience, and advances the standing of farmers and rural residents. This study examines how farmers’ socioeconomic status and mass media consumption relate to one another, as well as how various media platforms influence people’s socioeconomic situations.
The Lucknow district in Uttar Pradesh, one of the most agriculturally important states in India, makes for an interesting case study. The purpose of this study is to investigate the ways in which media affects farmers’ knowledge levels, adoption of contemporary techniques, and access to resources, which in turn affects their standard of living, income, education, and health. It aims to determine if farmers are only media consumers or whether the media actively influences the economic and behavioral changes that occur in their industries.
Materials And Methods
One of the 75 districts in Uttar Pradesh would host the study. The study was carried out along the banks of the Gomati River in the Lucknow District, which is in the central region of Uttar Pradesh in northern India. Malihabad, Gosainganj, Mohanlalganj, Sarojini Nagar, and Kakori are among the agriculturally active rural blocks that make up a sizable chunk of the district, despite its reputation as an urban center. These locations were picked because of their diverse populations, agricultural patterns, and diversified media exposure. https://www.biologyjournal.net Sampling of respondents A list of the respondents in each of the four villages was made, and thirty smartphone-wielding respondents were selected at random from each village for the study.
Thus, a total of 120 respondents were selected for the investigation.
Result And Discussion
Table 1: Distribution of the respondents on the basis of communication media: N=120 S. No. Categories Respondents Number Percentage 1. Mobile 120 100.00 2.
| S. No. | Categories | Respondents | — |
|---|---|---|---|
| Number | Percentage | ||
| 1. | Mobile | 120 | 100.00 |
| 2. | Radio | 18 | 15.00 |
| 3. | Television | 117 | 97.5 |
| 4. | D.T.H | 92 | 76.66 |
| 5. | Computer | 16 | 13.33 |
| 6. | Newspaper | 21 | 17.5 |
| 7. | Magazine | 2 | 1.66 |
| 8. | Agricultural book | 10 | 8.33 |
Table text extracted from the original PDF; superscript letters are shown inline. The original table image is below.
View original table image
Radio 18 15.00 3. Television 117 97.5 4. D.T.H 92 76.66 5. Computer 16 13.33 6.
Newspaper 21 17.5 7. Magazine 2 1.66 8. Agricultural book 10 8.33 Most people have a mobile phone, with everyone (100%) owning one. Almost everyone also has a television, with about 97.5% of people.
Many people have a D.T.H. service (about 76.66%), Fewer people have newspapers (17.5%),and a little farmer had radio(15.00%), computers (13.33%), agricultural books (8.33%), and magazines (1.66%). Table 2: Distribution of respondents on the basis of mass media exposure: N=120 Frequency of use S. No. Mass media Regularly (3) Occasionally (2) Never (1) network costs.
| S. No. | Category | Respondents | — |
|---|---|---|---|
| Number | Percentage | ||
| 1. | Low (1) | 28 | 23.33 |
| 2. | Medium (1-3) | 71 | 59.16 |
| 3. | High (above 3) | 21 | 17.5 |
| Total | 120 | 100.00 |
Table text extracted from the original PDF; superscript letters are shown inline. The original table image is below.
View original table image
| S. No. | Mass media | — | — | Frequency of use | — | — | — |
|---|---|---|---|---|---|---|---|
| Regularly (3) | Occasionally (2) | Never (1) | |||||
| Number | % | Number | % | Number | % | ||
| 1. | 38 | 31.66 | 55 | 45.83 | 27 | 24.54 | |
| 2. | 41 | 34.16 | 62 | 51.66 | 17 | 14.16 | |
| 3. | YouTube | 33 | 27.5 | 49 | 40.83 | 38 | 34.54 |
| 4. | Other | 31 | 25.83 | 43 | 35.83 | 46 | 38.33 |
| Total | 120 | 100 | 120 | 100 | 120 | 100 |
Table text extracted from the original PDF; superscript letters are shown inline. The original table image is below.
View original table image
The use of mass media tools can be implemented in different locations at the micro-level.
Conclusion
Based on the results of the current study and the logical interpretation of the findings and experience, told that Since most respondents feel they lack training and education on the use of mass media, comprehensive training is needed to equip them with the skills to design user-friendly agricultural information content in an efficient and understandable manner.A majority of respondents agreed that poor network connectivity and slow data network connectivity are the main concerns, followed by language barriers and high data
References
16 in the original paper- Swanson BE, Rajalahti R. Strengthening agricultural extension and advisory systems: Procedures for assessing, transforming, and evaluating extension systems. Washington (DC): World Bank; 2010.
- Rao DS. Role of mass media in agricultural development: A study of farmers in Andhra Pradesh. J Commun Media Stud. 2013;5(2):115-23.
- Mittal S, Mehar M. How mobile phones contribute to growth of small farmers: Evidence from India. Q J Int Agric. 2012;51(3):227-44.
- Kumar A, Choudhary P. Digital media and rural development: An Indian perspective. New Delhi: Concept Publishing Company; 2021.
- Government of India. Annual report - Ministry of Agriculture & Farmers’ Welfare. New Delhi: GOI Publications; 2023.
- National Sample Survey Office (NSSO). Key indicators of household social consumption on education and communication in India. Ministry of Statistics and Programme Implementation; 2022.
- Yadav R, Singh S. Impact of mass media on farmers' knowledge and adoption behavior. Indian Res J Ext Educ. 2018;18(1):45-50.
- Food and Agriculture Organization (FAO). Digital agriculture: Supporting farmers in the digital era. Rome: Food and Agriculture Organization of the United Nations; 2020.
- Bhattacharya S. Role of ICT in agriculture: Policy brief. New Delhi: Indian Council for Research on International Economic Relations (ICRIER); 2017.
- Lucknow District Agricultural Office. District agricultural statistics and communication strategy reports. Lucknow: Lucknow DAO; 2023. Number % Number % Number %
- Facebook 38 31.66 55 45.83 27 24.54
- Whatsapp 41 34.16 62 51.66 17 14.16
- YouTube 33 27.5 49 40.83 38 34.54
- Other 31 25.83 43 35.83 46 38.33 Total 120 100 120 100 120 100 Most people, about 59 out of 100, had a medium amount of exposure to things like TV, radio, or the internet. A smaller group, around 23 out of 100, had a little exposure, and a small number, about 18 out of 100, saw or heard a lot of media. Table 2: Distribution of the respondent on the basis of mass media exposure: N=120 S. No. Category Respondents Number Percentage
- Medium (1-3) 71 59.16
- High (above 3) 21 17.5 Total 120 100.00