
Research article · 2025 · Full text
International Journal of Horticulture and Food ScienceCorrelation and path analysis of yield contributing characters in fifteen strawberry genotypes under Mid-Hill conditions of Himachal Pradesh
Volume 7(6) · Pages 82–86 · DOI: 10.33545/26631067.2025.v7.i6b.322 ↗
Research areasBerry genetics and cultivation researchBanana Cultivation and ResearchGenetics and Plant Breeding
Abstract
Author-writtenA comprehensive evaluation of fifteen strawberry genotypes was conducted over two consecutive growing seasons (2015-16 and 2016-17) at the experimental field, Department of Fruit Science, Dr. YS Parmar University of Horticulture and Forestry, Nauni, Solan, Himachal Pradesh. The experiment was laid out in a Randomized Complete Block Design with three replications. Correlation and path analysis studies in fifteen strawberry cultivars namely Addie, Belrubi, Brighton, Chandler, Confectura, Douglas, Etna, Fern, Gorella, Elyana, Selva, Shasta, Sweet Charlie, Tioga, and Torrey were carried out. Number of fruits/plant, average berry weight and leaf number/plant had high positive direct effect on yield/plant during first year of study while during 2016-17, days to flowering had maximum positive direct effect on fruit yield.
Summary
Source-checkedPlain-language reading of the full paper, prepared with AI and checked against the text. Each point links to the authors' own words.
Why it matters
- The cultivated strawberry is one of the most economically important horticultural crops globally. View evidence ↗
- Improving strawberry yield is difficult because it is a complex trait influenced by many biological components and environmental factors, making direct selection inefficient. View evidence ↗
The question
- The study aimed to evaluate phenotypic and genotypic variations and use correlation and path coefficient analysis to understand how different traits directly and indirectly affect strawberry fruit yield. View evidence ↗
What they did
- Fifteen strawberry genotypes were evaluated over two growing seasons (2015-16 and 2016-17) in Solan, Himachal Pradesh. View evidence ↗
- The researchers used a Randomized Complete Block Design with three replications for the experiment. View evidence ↗
- The study analyzed fifteen specific cultivars, including Addie, Chandler, and Torrey, among others. View evidence ↗
What they found
- In the first year, yield per plant was positively and significantly correlated with several traits, most strongly with the number of achenes per fruit (0.54) and number of flowers per plant (0.47). View evidence ↗
- In the second year, yield per plot showed positive significant correlations with traits such as number of flowers (0.56) and days to flowering (0.45). View evidence ↗
- Genotypic correlation coefficients were generally higher than phenotypic ones, suggesting that environmental factors suppressed the phenotypic relationships between traits. View evidence ↗
- During the first year, leaf area (0.56), number of fruits (0.56 and 0.68), and achene number (0.54) had high positive direct effects on yield. View evidence ↗
- In the second year, the highest direct effects on yield per plant were from duration of flowering, followed by fruit breadth (0.80) and average berry weight (0.68). View evidence ↗
What it means
- The authors concluded that while genetic factors primarily control the relationship between traits and yield, environmental factors cause the importance of specific traits to vary from year to year. View evidence ↗
- The identified traits are recommended as reliable indices for selection in breeding programs to develop high-yielding strawberry cultivars. View evidence ↗
Visual summary
1 visualsIllustrations explain the paper; they do not show study data.
Conceptual Path Analysis Flow
AI-generated conceptual illustration (strawberry plants). It explains the idea and does not show study data.
View source evidence ↗Figures & tables
From the original paper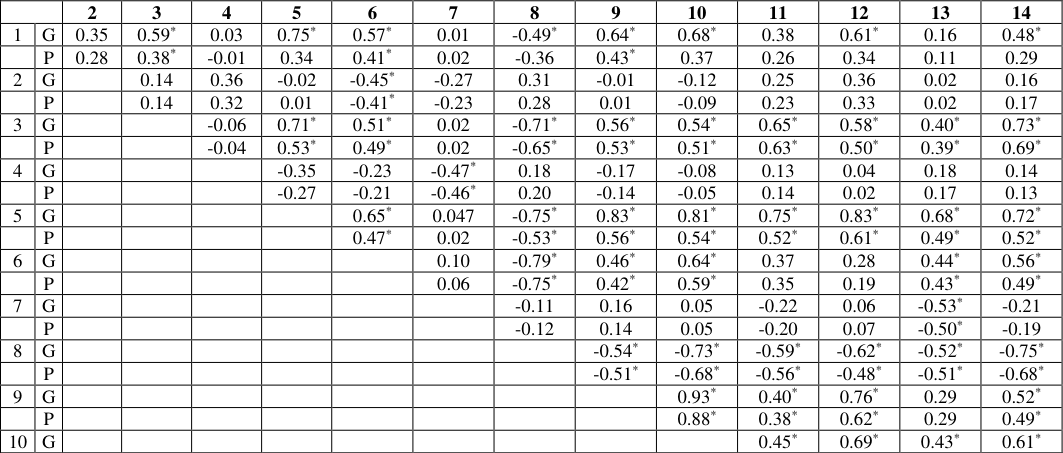 Table 1
 Table 2
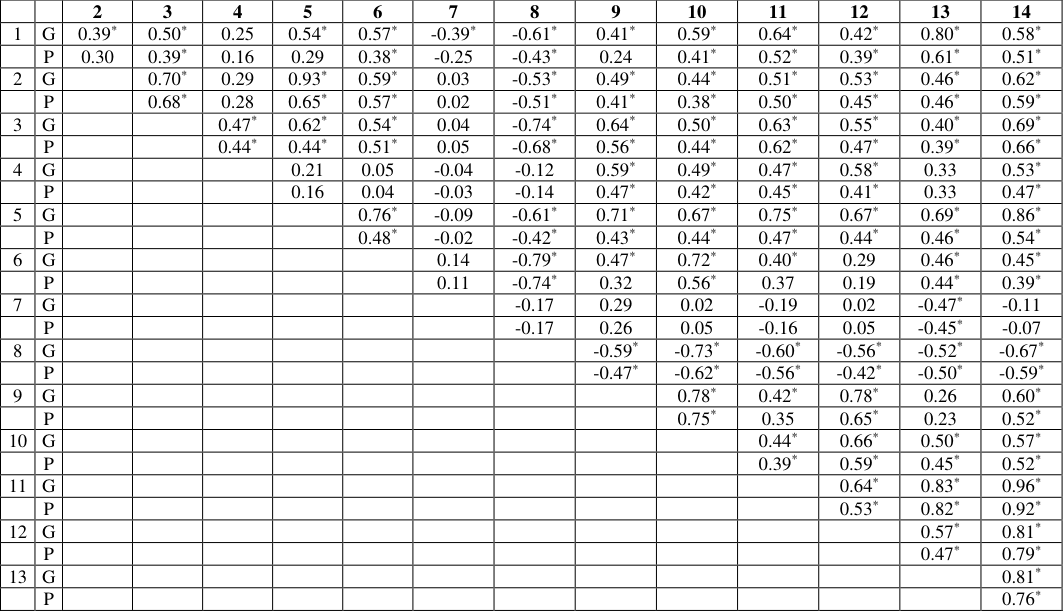 Table 2
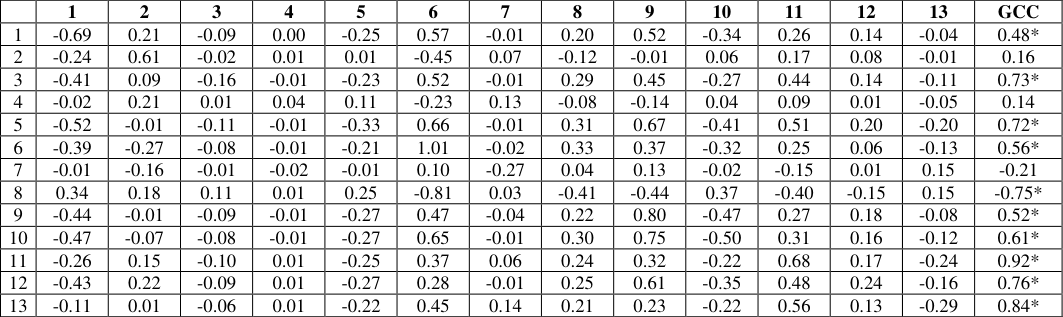 Table 3
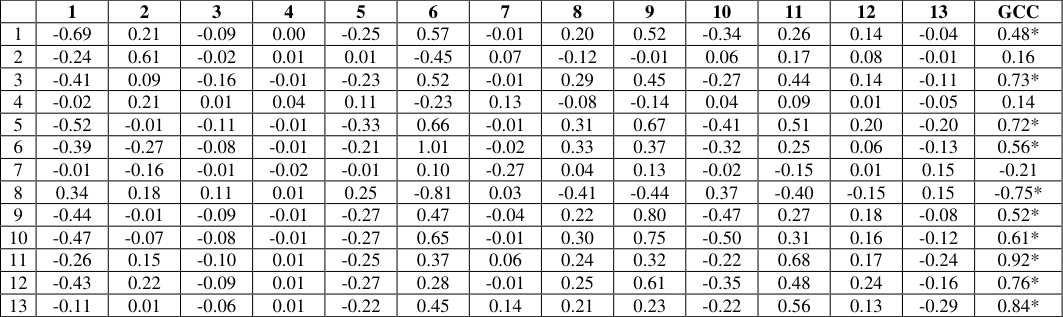 Table 4
 Table 5
Introduction
The cultivated strawberry (Fragaria × ananassa Duch.) stands as one of the most economically significant horticultural crops worldwide, belonging to the family Rosaceae. This octaploid species (2n=8x=56) represents a remarkable example of interspecific hybridization. The maternal parent, Fragaria chiloensis L., contributed large fruit size characteristics from its Chilean origin, while the paternal parent, Fragaria virginiana Duch., from eastern North America, provided essential vigor and adaptability traits that established the foundation of modern strawberry cultivation. Contemporary strawberry breeding programs face the perpetual challenge of enhancing fruit yield while maintaining quality attributes. Yield, being a complex quantitative trait, results from the intricate interaction of multiple morphological, physiological, and biochemical components, further modulated by environmental factors. This complexity renders direct selection for yield improvement challenging and often inefficient. Consequently, understanding the genetic architecture underlying yield components and their interrelationships becomes paramount for developing effective breeding strategies. Given the complex genetic architecture of strawberry and the multifaceted nature of yield components, the present investigation was undertaken to evaluate the extent and magnitude of variability in vegetative and reproductive traits within strawberry germplasm. The primary objectives include assessing phenotypic and genotypic variations, determining correlation coefficients among various morphological and yield-related characters, and conducting path coefficient analysis to elucidate the direct and indirect effects of component traits on fruit yield. This comprehensive approach will provide valuable insights for developing efficient selection criteria and breeding strategies for strawberry improvement programs.
Methodology
The present investigation entitled "Evaluation of strawberry genotypes through morphological and molecular markers" was conducted at the Department of Fruit Science, Dr. Y.S. Parmar University of Horticulture and Forestry, Nauni, Solan, Himachal Pradesh, India during 2015-16 and 2016-17 for fifteen genotypes. The statistical analysis was performed using MS-Excel and OPSTAT software packages. The significance of differences between cultivars was tested at 5% level of probability (P≤0.05). Critical Difference (CD)
values were calculated at 0.05 % level of significance to compare the means of different treatments. The pooled analysis was conducted by combining the data from both experimental years to obtain overall performance estimates for each cultivar. Standard statistical procedures were followed to ensure the validity and reliability of the results obtained from the morphological evaluation of strawberry genotypes.
Results and Discussion
Results and Discussion
Correlation Studies
The simple correlations among fruit yield per plot and other vegetative, flowering, fruit yield characters were worked out and are presented in Table 1 (2015-16) and in Table 2 for (2016-17). During the first year yield per plant had positive and significant correlation with characters like leaf area (0.23), flower size (0.07), fruit breadth (0.24), number of flowers per plant (0.47), average berry weight (0.08), number of achene per fruit (0.54) during the first year of evaluation whereas trait namely plant height (-0.21), number of leaves(-0.51), number of runners (-0.10) days to flowering (-0.10) duration of flowering (-0.11), days to maturity (-0.23), and fruit length (-0.01) days to flowering (-0.57) showed negative significant correlation with yield per plant. During the second year number of leaves (0.01), number of runners (0.01), days to flowering (0.45), duration of flowering (0.14), days to maturity (0.21), fruit length (0.23) number of flowers (0.56) and average berry weight (0.13) showed positive and significant correlation whereas plant height (-0.11), leaf area (-0.06), flower size (-0.23), fruit breadth (-0.22) and number of achene per fruit (-0.29) showed negative and significant correlation with yield per plot.
| — | — | 2 | 3 | 4 | 5 | 6 | 7 | 8 | 9 | 10 | 11 | 12 | 13 | 14 |
|---|---|---|---|---|---|---|---|---|---|---|---|---|---|---|
| 1 | G | 0.39* | 0.50* | 0.25 | 0.54* | 0.57* | -0.39* | -0.61* | 0.41* | 0.59* | 0.64* | 0.42* | 0.80* | 0.58* |
| P | 0.30 | 0.39* | 0.16 | 0.29 | 0.38* | -0.25 | -0.43* | 0.24 | 0.41* | 0.52* | 0.39* | 0.61* | 0.51* | |
| 2 | G | 0.70* | 0.29 | 0.93* | 0.59* | 0.03 | -0.53* | 0.49* | 0.44* | 0.51* | 0.53* | 0.46* | 0.62* | |
| P | 0.68* | 0.28 | 0.65* | 0.57* | 0.02 | -0.51* | 0.41* | 0.38* | 0.50* | 0.45* | 0.46* | 0.59* | ||
| 3 | G | 0.47* | 0.62* | 0.54* | 0.04 | -0.74* | 0.64* | 0.50* | 0.63* | 0.55* | 0.40* | 0.69* | ||
| P | 0.44* | 0.44* | 0.51* | 0.05 | -0.68* | 0.56* | 0.44* | 0.62* | 0.47* | 0.39* | 0.66* | |||
| 4 | G | 0.21 | 0.05 | -0.04 | -0.12 | 0.59* | 0.49* | 0.47* | 0.58* | 0.33 | 0.53* | |||
| P | 0.16 | 0.04 | -0.03 | -0.14 | 0.47* | 0.42* | 0.45* | 0.41* | 0.33 | 0.47* | ||||
| 5 | G | 0.76* | -0.09 | -0.61* | 0.71* | 0.67* | 0.75* | 0.67* | 0.69* | 0.86* | ||||
| P | 0.48* | -0.02 | -0.42* | 0.43* | 0.44* | 0.47* | 0.44* | 0.46* | 0.54* | |||||
| 6 | G | 0.14 | -0.79* | 0.47* | 0.72* | 0.40* | 0.29 | 0.46* | 0.45* | |||||
| P | 0.11 | -0.74* | 0.32 | 0.56* | 0.37 | 0.19 | 0.44* | 0.39* | ||||||
| 7 | G | -0.17 | 0.29 | 0.02 | -0.19 | 0.02 | -0.47* | -0.11 | ||||||
| P | -0.17 | 0.26 | 0.05 | -0.16 | 0.05 | -0.45* | -0.07 | |||||||
| 8 | G | -0.59* | -0.73* | -0.60* | -0.56* | -0.52* | -0.67* | |||||||
| P | -0.47* | -0.62* | -0.56* | -0.42* | -0.50* | -0.59* | ||||||||
| 9 | G | 0.78* | 0.42* | 0.78* | 0.26 | 0.60* | ||||||||
| P | 0.75* | 0.35 | 0.65* | 0.23 | 0.52* | |||||||||
| 10 | G | 0.44* | 0.66* | 0.50* | 0.57* | |||||||||
| P | 0.39* | 0.59* | 0.45* | 0.52* | ||||||||||
| 11 | G | 0.64* | 0.83* | 0.96* | ||||||||||
| P | 0.53* | 0.82* | 0.92* | |||||||||||
| 12 | G | 0.57* | 0.81* | |||||||||||
| P | 0.47* | 0.79* | ||||||||||||
| 13 | G | 0.81* | ||||||||||||
| P | 0.76* |
Table text extracted from the original PDF; superscript letters are shown inline. The original table image is below.
View original table image
| — | — | 2 | 3 | 4 | 5 | 6 | 7 | 8 | 9 | 10 | 11 | 12 | 13 | 14 |
|---|---|---|---|---|---|---|---|---|---|---|---|---|---|---|
| 1 | G | 0.35 | 0.59* | 0.03 | 0.75* | 0.57* | 0.01 | -0.49* | 0.64* | 0.68* | 0.38 | 0.61* | 0.16 | 0.48* |
| P | 0.28 | 0.38* | -0.01 | 0.34 | 0.41* | 0.02 | -0.36 | 0.43* | 0.37 | 0.26 | 0.34 | 0.11 | 0.29 | |
| 2 | G | 0.14 | 0.36 | -0.02 | -0.45* | -0.27 | 0.31 | -0.01 | -0.12 | 0.25 | 0.36 | 0.02 | 0.16 | |
| P | 0.14 | 0.32 | 0.01 | -0.41* | -0.23 | 0.28 | 0.01 | -0.09 | 0.23 | 0.33 | 0.02 | 0.17 | ||
| 3 | G | -0.06 | 0.71* | 0.51* | 0.02 | -0.71* | 0.56* | 0.54* | 0.65* | 0.58* | 0.40* | 0.73* | ||
| P | -0.04 | 0.53* | 0.49* | 0.02 | -0.65* | 0.53* | 0.51* | 0.63* | 0.50* | 0.39* | 0.69* | |||
| 4 | G | -0.35 | -0.23 | -0.47* | 0.18 | -0.17 | -0.08 | 0.13 | 0.04 | 0.18 | 0.14 | |||
| P | -0.27 | -0.21 | -0.46* | 0.20 | -0.14 | -0.05 | 0.14 | 0.02 | 0.17 | 0.13 | ||||
| 5 | G | 0.65* | 0.047 | -0.75* | 0.83* | 0.81* | 0.75* | 0.83* | 0.68* | 0.72* | ||||
| P | 0.47* | 0.02 | -0.53* | 0.56* | 0.54* | 0.52* | 0.61* | 0.49* | 0.52* | |||||
| 6 | G | 0.10 | -0.79* | 0.46* | 0.64* | 0.37 | 0.28 | 0.44* | 0.56* | |||||
| P | 0.06 | -0.75* | 0.42* | 0.59* | 0.35 | 0.19 | 0.43* | 0.49* | ||||||
| 7 | G | -0.11 | 0.16 | 0.05 | -0.22 | 0.06 | -0.53* | -0.21 | ||||||
| P | -0.12 | 0.14 | 0.05 | -0.20 | 0.07 | -0.50* | -0.19 | |||||||
| 8 | G | -0.54* | -0.73* | -0.59* | -0.62* | -0.52* | -0.75* | |||||||
| P | -0.51* | -0.68* | -0.56* | -0.48* | -0.51* | -0.68* | ||||||||
| 9 | G | 0.93* | 0.40* | 0.76* | 0.29 | 0.52* | ||||||||
| P | 0.88* | 0.38* | 0.62* | 0.29 | 0.49* | |||||||||
| 10 | G | 0.45* | 0.69* | 0.43* | 0.61* |
Table text extracted from the original PDF; superscript letters are shown inline. The original table image is below.
View original table image
Genotypic and Phenotypic Correlation
The correlation coefficient among the different characters was worked out at genotypic and phenotypic levels. In general, the genotypic correlation coefficient was higher in magnitude than phenotypic correlation coefficients. The association was found to be positive and significant between yield per plot and, leaf area (0.73 and 0.69), fruit size (0.72 and 0.52), days to flower (0.56 and 0.49) fruit length (0.52 and 0.49), fruit breadth (0.61 and 0.58), number of fruits per plant (0.92 and (0.89), and berry weight (0.76 and 0.66) achene number (0.84 and 0.80) except leaf number (0.16 and 0.17), number of runners per plant ( 0.14 and 0.13) which shows positive and non-significant association both at genotypic and phenotypic level during the year 2015-16. Plant height shows positive and significant association at genotypic level (0.483) and positive and non significant association at phenotypic level (0.52). While significant and negative correlations at both genotypic and phenotypic levels was observed with days maturity (-0.75 and -0.68). Non-significant and negative association was observed for days to flowering after planting (-0.21 and -0.19). In the year 2016-17 plant height (0.58 and 0.51), leaf number (0.62 and 0.59), leaf area (0.69 and 0.66), number of runners per plant (0.53 and 0.47), flower size (0.86 and (0.54), days to flower (0.45 and 0.39), fruit length (0.60 and 0.52), fruit breadth (0.57 and (0.52), number of fruits per plant (0.96 and 0.92) and berry weight (0.81 and 0.79) had significant and positive correlation with yield per plant both at genotypic and phenotypic levels. The characters days to flower (-0.11 and -0.07) showed non-significant and negative whereas days to maturity (-0.75 and -0.68) shows significant and negative correlation both at genotypic and phenotypic level. The genotypic correlation coefficients of fruit yield per plant and yield-contributing characters were higher than phenotypic correlation coefficients in most cases, indicating that the effects of environment suppressed the phenotypic relationship between these characters. Similar correlations of yield with various other horticultural traits had also been reported by Sharma and Suman (2006) [10] and yield per plant was significantly and positively associated with achene number per berry, fruit number, fruit length, fruit breadth and plant spread. Mir et al. (2009) [6] Garg et al. (2014) [2] also observed positive significant genotypic and phenotypic correlation for yield with number of fruits followed by fruit length which is found in agreement with the present findings. Similar reports were also suggested by Chaubey and Singh (1994) [1] and Ojo et al. (2006) [7] . Fruit yield showed strong positive and significant correlations with most of the characters. [5,12,4,8,11] , whereas findings of Gawronski and Hortynski (2011) are in disagreement with the present investigation who recorded negative correlation between the number of flowers per inflorescence and fruit weight. In a few cases, phenotypic correlation coefficients were the same as or higher than the genotypic correlation coefficients, indicating that both environmental and genotypic correlations in these cases acted in the same direction and finally maximized their expression at the phenotypic level.
Path Coefficient Analysis
Although correlation studies are helpful in determining the components of yield but it does not provide a clear picture of nature and extent of contributions made by number of independent traits. Path co-efficient analysis depicts the effects of different independent characters individually and in combination with other characters on the expression of different characters on yield. The data on path co-efficient level showing the direct and indirect effects of significant characters over fruit yield per plant are presented in Table 18 and 19. The data revealed that leaf area (0.56) flower size (0.09) duration of flowering, fruit length (0.23), fruit length (0.03), fruit breadth (0.38), number of fruits (0.56 and 0.68), average berry weight (0.14) and number of achene per fruit (0.54) had positive direct effect, while negative direct effect of characters plant height (-0.26), leaf number (-0.11), number of runners (-0.30), days to flower (-0.23), days to maturity (-0.32) on yield per plot during first year of study. Maximum positive direct effect on yield per plot was shown by leaf area and average berry weight (0.56) whereas maximum positive indirect effects were observed for fruit length (0.48), average berry weight (0.45) via fruit breadth and number of achene respectively. Highest negative indirect effects were recorded by number of runners (-0.32) via days to maturity followed by fruit breadth (-0.28) via number of achene during first year. During the second year the maximum direct effect on yield per plant was shown by duration of flowering followed by fruits breadth (0.80) average berry weight (0.68), leaf area (0.61), number of achenes per fruit (0.24) and flower size (0.04). The negative direct effect on yield per plant was observed by number of leaves (-0.69), runner number (-0.16), days to flowering (-0.33), days to maturity (-0.27), fruit length (-0.41) flower number (-0.50) achene number (-0.48) fruit breadth followed by (-0.18) and leaf area (-0.18) on yield per plot. The highest positive indirect effect on yield per plant were exhibited by plant height (0.50) via number of runners per plant followed by leaf area (0.50) via number of fruits per plant, plant spread (0.49) via number of runners per plant and fruit length (0.47), plant height (0.39), fruit weight (0.36) and leaf area (0.35) via number of fruits per plant., the characters number of leaves (-0.69), runner number (-0.16), days to flower (-0.33), days to maturity (-0.27), fruit length (-0.41) and flower number (-0.50) shows negative direct effect on yield per plot during second year of study. The indirect positive effects were maximum in case of flower number (0.75) followed by fruit length (0.67) via fruit length. Rao and Lal (2010) [9] also recorded similar observations as that of present investigation that maximum positive significant correlation of yield recorded with berry width followed by number of achenes per fruit, berry length and number of flowers per plant. Path coefficient analysis revealed that fruit width had highest direct positive contribution towards fruit yield per plant. These important traits may be considered in selection programme for the further improvement of yield in strawberry.
Figures and tables from the paper
| — | 1 | 2 | 3 | 4 | 5 | 6 | 7 | 8 | 9 | 10 | 11 | 12 | 13 | GCC |
|---|---|---|---|---|---|---|---|---|---|---|---|---|---|---|
| 1 | -0.69 | 0.21 | -0.09 | 0.00 | -0.25 | 0.57 | -0.01 | 0.20 | 0.52 | -0.34 | 0.26 | 0.14 | -0.04 | 0.48* |
| 2 | -0.24 | 0.61 | -0.02 | 0.01 | 0.01 | -0.45 | 0.07 | -0.12 | -0.01 | 0.06 | 0.17 | 0.08 | -0.01 | 0.16 |
| 3 | -0.41 | 0.09 | -0.16 | -0.01 | -0.23 | 0.52 | -0.01 | 0.29 | 0.45 | -0.27 | 0.44 | 0.14 | -0.11 | 0.73* |
| 4 | -0.02 | 0.21 | 0.01 | 0.04 | 0.11 | -0.23 | 0.13 | -0.08 | -0.14 | 0.04 | 0.09 | 0.01 | -0.05 | 0.14 |
| 5 | -0.52 | -0.01 | -0.11 | -0.01 | -0.33 | 0.66 | -0.01 | 0.31 | 0.67 | -0.41 | 0.51 | 0.20 | -0.20 | 0.72* |
| 6 | -0.39 | -0.27 | -0.08 | -0.01 | -0.21 | 1.01 | -0.02 | 0.33 | 0.37 | -0.32 | 0.25 | 0.06 | -0.13 | 0.56* |
| 7 | -0.01 | -0.16 | -0.01 | -0.02 | -0.01 | 0.10 | -0.27 | 0.04 | 0.13 | -0.02 | -0.15 | 0.01 | 0.15 | -0.21 |
| 8 | 0.34 | 0.18 | 0.11 | 0.01 | 0.25 | -0.81 | 0.03 | -0.41 | -0.44 | 0.37 | -0.40 | -0.15 | 0.15 | -0.75* |
| 9 | -0.44 | -0.01 | -0.09 | -0.01 | -0.27 | 0.47 | -0.04 | 0.22 | 0.80 | -0.47 | 0.27 | 0.18 | -0.08 | 0.52* |
| 10 | -0.47 | -0.07 | -0.08 | -0.01 | -0.27 | 0.65 | -0.01 | 0.30 | 0.75 | -0.50 | 0.31 | 0.16 | -0.12 | 0.61* |
| 11 | -0.26 | 0.15 | -0.10 | 0.01 | -0.25 | 0.37 | 0.06 | 0.24 | 0.32 | -0.22 | 0.68 | 0.17 | -0.24 | 0.92* |
| 12 | -0.43 | 0.22 | -0.09 | 0.01 | -0.27 | 0.28 | -0.01 | 0.25 | 0.61 | -0.35 | 0.48 | 0.24 | -0.16 | 0.76* |
| 13 | -0.11 | 0.01 | -0.06 | 0.01 | -0.22 | 0.45 | 0.14 | 0.21 | 0.23 | -0.22 | 0.56 | 0.13 | -0.29 | 0.84* |
Table text extracted from the original PDF; superscript letters are shown inline. The original table image is below.
View original table image
| — | 1 | 2 | 3 | 4 | 5 | 6 | 7 | 8 | 9 | 10 | 11 | 12 | 13 | GCC |
|---|---|---|---|---|---|---|---|---|---|---|---|---|---|---|
| 1 | -0.26 | -0.04 | 0.28 | -0.08 | 0.05 | -0.13 | -0.09 | -0.27 | -0.02 | 0.28 | 0.36 | 0.06 | 0.44 | 0.58* |
| 2 | -0.10 | -0.11 | 0.39 | -0.09 | 0.09 | -0.13 | 0.00 | -0.23 | -0.02 | 0.21 | 0.29 | 0.07 | 0.25 | 0.62* |
| 3 | -0.13 | -0.07 | 0.56 | -0.15 | 0.06 | -0.12 | 0.01 | -0.32 | -0.03 | 0.24 | 0.36 | 0.08 | 0.22 | 0.69* |
| 4 | -0.06 | -0.03 | 0.26 | -0.32 | 0.02 | -0.01 | -0.01 | -0.05 | -0.03 | 0.24 | 0.26 | 0.08 | 0.18 | 0.53* |
| 5 | -0.14 | -0.10 | 0.356 | -0.07 | 0.09 | -0.17 | -0.02 | -0.27 | -0.04 | 0.32 | 0.43 | 0.10 | 0.37 | 0.86* |
| 6 | -0.15 | -0.06 | 0.30 | -0.01 | 0.07 | -0.23 | 0.03 | -0.34 | -0.02 | 0.34 | 0.23 | 0.04 | 0.25 | 0.45* |
| 7 | 0.10 | -0.01 | 0.02 | 0.01 | -0.01 | -0.03 | 0.23 | -0.07 | -0.01 | 0.01 | -0.10 | 0.01 | -0.25 | -0.11 |
Table text extracted from the original PDF; superscript letters are shown inline. The original table image is below.
View original table image
References
12 in the original paper- Chaubey PK, Singh RP. Genetic variability, correlation and path analysis of filled components in rice. Madras Agricultural Journal. 1994;81:438-470.
- Garg S, Sharma G, Lata S. Correlation and path analysis among different vegetative, floral and fruit characters in strawberry (Fragaria × ananassa Duch.). The Ecoscan. 2014:379-384.
- Gawronski J, Hortynski J. Hierarchical crossing design in estimation genetic quantitative traits of strawberry (Fragaria × ananassa Duch.). Acta Scientiarum Polonorum Hortorum Cultus. 2011;10:77-82.
- Guttridge CG, Anderson HM. Assessing fruit yield characteristics and potential in strawberry. Horticulture Research. 1981;21:83-98.
- Lacey CN. Phenotypic correlations between vegetative characters and yield components in strawberry. Euphytica. 1973;22:546-554.
- Mir MM, Neelofar, Bisati IA. Path coefficient analysis in pomegranate (Punica granatum L.). Advances in Plant Sciences. 2009;22:269-271.
- Ojo DK, Omikunle OA, Ajala MO, Ogunbayo SA. Heritability, character correlation and path coefficient analysis among six lines of maize. World Journal of Agricultural Sciences. 2006;2:352-358.
- Olsen JL, Martin LW, Breen PJ. Yield component analysis of Benton and OR US 4356 strawberries. Horticulture Science. 1985;20:74-75.
- Rao VK, Lal B. Evaluation of promising strawberry genotypes under Garhwal Himalayan conditions. Indian Journal of Horticulture. 2010;67:470-474.
- Sharma G, Suman DK. Studies on genetic variability for various horticultural traits in strawberry (Fragaria × ananassa Duch.). Progressive Horticulture. 2006;37(3):323-327.
- Strik BC, Proctor JTA. Yield component analysis of strawberry genotypes differing in productivity. Journal of the American Society for Horticultural Science. 1988;113:124-129.
- Webb RA, Purves JV, White BA, Ellis R. A critical path analysis of fruit production in strawberry. Scientia Horticulturae. 1974;2:175-184.