
Research article · 2025 · Full text
International Journal of Biology SciencesMultiple Linear Regression Water Quality Index (MLRWQI) used for Groundwater of Baramati Tehsil using R Tool
Volume 7(6) · Pages 112–116 · DOI: 10.33545/26649926.2025.v7.i6b.365 ↗
Research areasWater Quality and Pollution AssessmentHydrological Forecasting Using AIGroundwater and Watershed Analysis
Abstract
Author-writtenClean water is essential for life, health, and the environment. It plays a critical role in human survival, economic development, and ecological balance. In this study, multiple linear regressions are used for water quality index. The Water Quality Index (WQI) serves as a comprehensive measure to evaluate the overall quality of water based on various physicochemical parameters. This study employs multiple regression analysis to model the relationship between WQI and key water quality indicators such as pH, EC, TH, Ca, Na and other paramenters. The objective is to develop a predictive model that quantifies the impact of these independent variables on WQI and identifies the most significant contributors to water quality degradation. The Multiple Linear Regression Water Quality Index (MLRWQI) is fastest tool used for detection of water quality using mathematical expression so accuracy of this model is increased. In this model 12 parameters are considered for water quality index calculation. Determined regression value is considered with correlation values of each and every variable. The result of MLRWQI, residual standard error is 6.333, Multiple R2 is 1, adjusted R2 is 1 and p-value is 2.2e-16 received.
Summary
Source-checkedPlain-language reading of the full paper, prepared with AI and checked against the text. Each point links to the authors' own words.
Why it matters
- Clean water is fundamental for human survival, ecological balance, and economic development. View evidence ↗
- The usability of groundwater supplies can be limited by contamination resulting from natural geological layouts or human activities. View evidence ↗
- Traditional groundwater quality assessment methods often rely on mathematical models that assume linear relationships, which can lead to poor overall model quality. View evidence ↗
The question
- The study aims to create a predictive model to quantify how specific independent variables impact the Water Quality Index (WQI) and identify the primary drivers of water quality degradation. View evidence ↗
What they did
- The researchers analyzed 30 distinct groundwater samples collected from various districts surrounding Baramati. View evidence ↗
- Sampling was conducted during the 2023 pre-monsoon (April-May) and monsoon (June-July) seasons. View evidence ↗
- The Multiple Linear Regression Water Quality Index (MLRWQI) model utilized 12 physicochemical parameters for its calculations. View evidence ↗
- Statistical computations and multiple linear regression were performed using R 2023 software in R Studio. View evidence ↗
What they found
- The MLRWQI model demonstrated high statistical fit with a Multiple R² of 1, an adjusted R² of 1, a p-value of 2.2e-16, and a residual standard error of 6.333. View evidence ↗
- Of the samples tested, 20 were categorized as 'Acceptable with caution' and 3 were categorized as having 'good' water quality. View evidence ↗
- None of the 30 groundwater samples tested were classified as having 'excellent' water quality. View evidence ↗
- Residual analysis indicated that the model has minimal error, as residuals were small and centered around zero. View evidence ↗
What it means
- The authors conclude that the MLRWQI model provides a more accurate analysis of groundwater and is faster to implement than the standard WQI. View evidence ↗
- The primary advantage of the MLRWQI approach is its ability to handle multiple water quality parameters while reducing overall calculation time. View evidence ↗
Visual summary
1 visualsIllustrations explain the paper; charts are replotted from the paper's own table values.
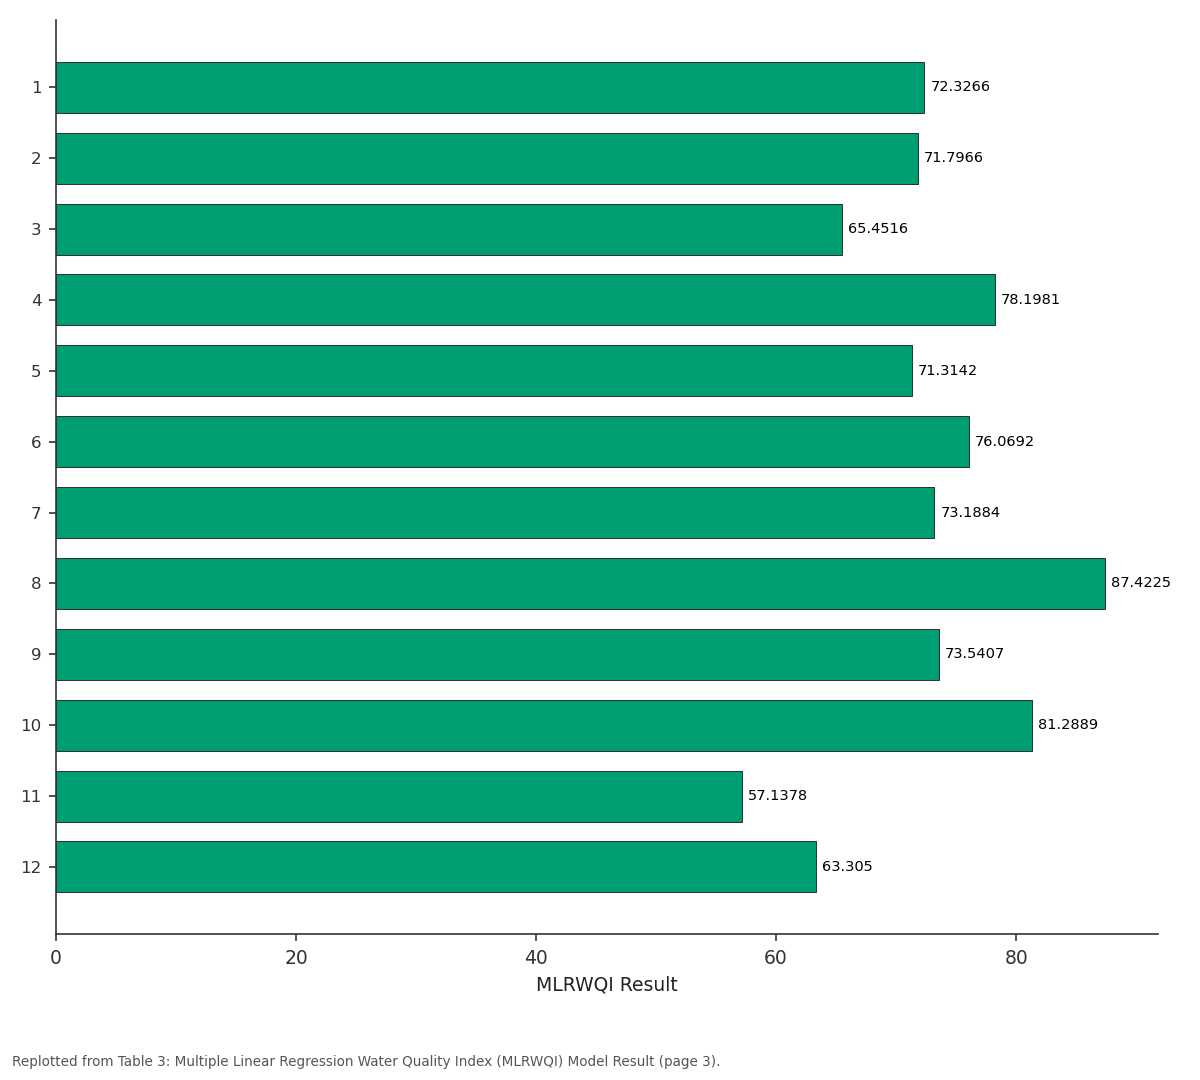
MLRWQI Result: 1 vs 2 vs 3 vs 4 vs 5
Replotted from Table 3 (page 3) of the original paper. Every bar is the paper's own table value.
View source evidence ↗Figures & tables
From the original paper Table 1
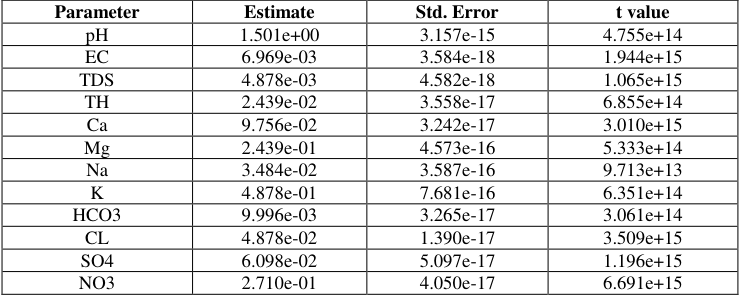 Table 2
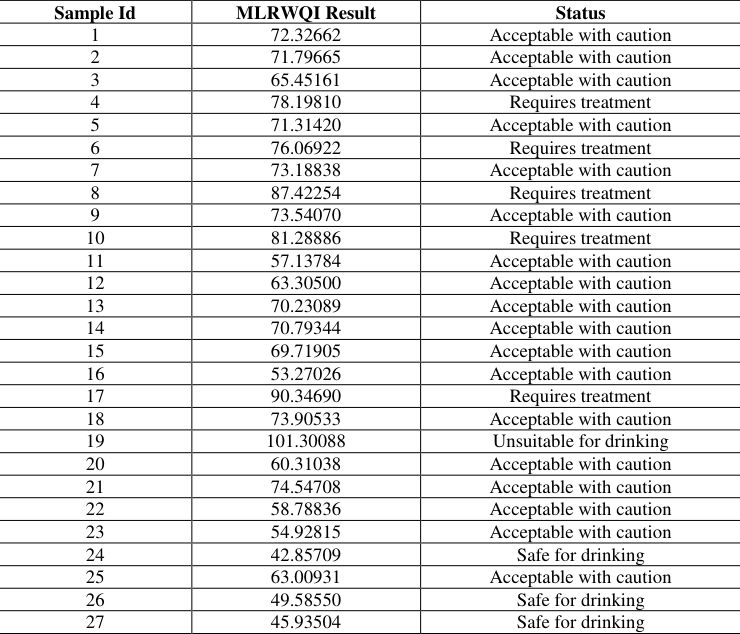 Table 3
 Table 4
 Table 4
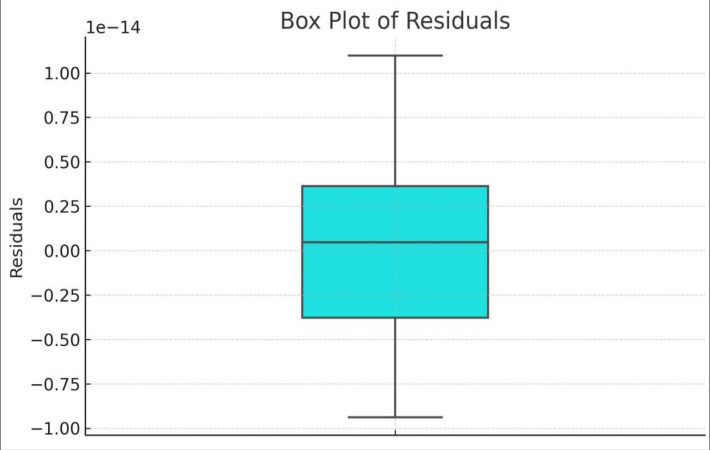 Figure 1
Introduction
Groundwater is frequently utilized for industrial, agricultural, and drinking purposes [1]. Complete knowledge of the geochemical processes governing the biological structure of groundwater is needed. Many regions of the world have hydro-chemical schemes that are useful to comprehend [2] . This information can aid in the organization and consumption of groundwater supplies by highlighting the relationships between groundwater excellences, aquatic, and renew type [3] . Water resource management techniques often treat surface and ground water as separate entities. Both systems exhibit a qualitative and quantitative influence on each other in the most recent advancements in this field [4] . However, groundwater contamination caused by humanoids or the natural geological layout of aquifers limits the capacity of groundwater supplies or their use [5] . Since groundwater quality is one of the physical and chemical properties impacted by geological and human activity, the use of pesticides and fertilizers in agriculture may also have an impact on it [6] . This is true even though the quality of groundwater may be impacted by a variety of biological and human activities [7] . The traditional method of assessing groundwater quality usually heavily relies on mathematical modeling approaches such as probability statistics, time series analysis, etc. These methods assume a linear relationship between the dependent and independent variables, which often results in models of poor overall quality [8] . Because groundwater quality simulations continue to be challenging, new computer approaches are required to address this problem [9] . A healthy river must have high-quality water since it impacts the people, animals, and plants that depend on it. However, the wide range of potential water quality measures used to characterize the condition of river water quality makes it challenging to quantify. However, because monitoring all of a river's water quality characteristics is costly and time-consuming, a lack of financing is often the biggest obstacle, especially in poor nations. The creation of artificial intelligence models in the environmental and hydrological domains has garnered significant interest in the last ten years [10] .
Because of this, a number of studies have focused on creating computer-based techniques for groundwater quality simulation. According to the experimental investigation, the MLRWQI modeling technique, which is based on statistical analysis, can be used to estimate the water content of soils in a range of weather circumstances. Since water quality is the most important environmental issue in the world, it has been a major worry in recent years. In order to ensure public health and safety, water quality evaluation has taken precedence. Numerous nations have started measuring water quality and keeping an eye out for impending water shortages. The creation of a water quality index is necessary to assess the quality of the water body because the vast volume of data obtained makes interpretation extremely difficult.
Material and Methods Water Quality Indicator
The water quality index offers a straightforward way to assess the quality of the water and compare the conditions of various bodies of water in various places and at various times. It enables the measurement of "good" and "bad" water quality, the accumulation of parameter impacts, and the identification of river sections whose quality has changed dramatically and which may, if needed, be further examined. One useful technique for anticipating potentially hazardous conditions is the water quality index. Numerous studies have attempted to tackle the rigidity issues and increase the accuracy of the index value ever since the water quality index concept was first developed. The range of scenarios in which each technique or function can be used is restricted, and each has advantages and disadvantages of its own. The best approach is one that is devoid of subjectivity, uncertainty, and overestimation (eclipsing) as well as underestimating (ambiguity). In water quality index, Physical Indicator, Chemical Indicator and Biological Indicator are used. In physical indicator, Color, odor, temperature, taste, turbidity, TDS, electrical Conductivity parameters are used. In Chemical Indicator, Phosphates, Total Hardness, Biochemical Oxygen Demand (BOD), pH, Chemical Oxygen Demand (COD), Pesticides, Heavy metals, Nitrates, Dissolved Oxygen (DO), Surfactants parameters are used. In Biological Indicators, Viruses -Fungi protozoa -Parasitic worms -Pimephales promelas, Bacteria (fecal coliform, Escherichia coli, Cryptosporidium, Giardia lamblia), Trichoptera or caddisfly -Sea Urchin -Mollusca areused [11] . Expert evaluations of the quality of drinking source water are used to validate the quality scores that are produced using the core set of characteristics. Using historical monitoring data and a different index computation method that lessens the effect of parameter unevenness, the index is pilot tested. Lastly, a sensitivity analysis is conducted and the difficulties in implementing the index widely are highlighted. In contrast to water quantity, which can be precisely stated, water quality is a multi-parameter characteristic. A WQI's usefulness depends on the compilation of data on water-quality metrics at several points in time and location, then converting this data into a single score that reflects the time frame and the spatial unit in question. In this approach, a WQI turns into a simple tool for communicating scientific knowledge from specialists to the general public.
Study Area
Located in Maharashtra's western Pune Division is Baramati Tehsil. It is 100 kilometers (km) from Pune, the district administrative center, and 240 kilometers (km) from Mumbai, the state capital [12] . The latitudes of the tehsil are 74°26 and 74°69 in the east and 18°04 and 18°32 in the north. Its elevation is 550 meters above mean sea level. Baramati tehsil has 1382 square kilometers in size. These sub-villages are among the 116 significant villages in the tehsil region. In all, 3,75,185 individuals live in the study region, with 1,93,451 men and 1,81,734 women. 94.84% of the population, or 3,55,841, reside in the rural sections of the tehsil [13] . Adjacent to Baramati Tehsil are Phaltan Tehsil to the south, Daund Tehsil to the north, Malshiras Tehsil to the east, Indapur Tehsil to the east, and Purandar Tehsil to the west [14] . The water quality index is assessed in this study using 30 distinct groundwater samples from several tehsil districts surrounding Baramati. The samples are collected during the 2023 monsoon season (June-July) and the pre-monsoon season (April-May). Every sample was taken in a premium one-liter plastic bottle.
Multiple Linear Regression Water Quality Index (MLRWQI)
A strong statistical method for simulating the link between several independent variables and a dependent variable (such as the Water Quality Index, or WQI) is multiple regression. Finding the optimal linear equation that can forecast the value of the dependent variable based on the values of the independent variables is the aim of multiple linear regression. It is possible to make predictions about the dependent variable by expressing the connection in terms of weights assigned to the independent variables. Both making predictions and comprehending the connections between the dependent and independent variables are possible with the multiple linear regression model. Additionally, the model can be utilized for model selection and hypothesis testing. Several input parameters pertaining to the physicochemical properties of the water are analyzed when using multiple linear regression (MLR) for WQI modeling. The result is a single index score that represents the overall quality of the water. Using selected features (variables) from data sets of various sizes, we built and executed a number of MLR models during the model building process. Before deciding on the model's ultimate usefulness, we divided the data into training and testing subsets to confirm model performance. A typical multiple regression equation for WQI can be expressed as:
Result Analysis
Thirty water samples were collected for this study from different places around Baramati taluka [17] . The water quality index is calculated using MLRWQI model and the 12 physico-chemical parameters.
Conclusion
In this research work, the MLRWQI model gives more accurate analysis of groundwater. It takes very less time period as compared to WQI. In MLRWQI, the chemical parameters are considered for assessment. The 12 parameters are used for analysis purposes with BIS and WHO standard. In said study area, 20 samples are belonging to "Acceptable with caution" water quality indexing and 3 is having good water quality indexing. The MLRWQI method is used mathematical approach so accuracy is more as compared to WQI with minimum error value. It is very easy model to predict the assessment value of water. MLRWQI WQI is also a quality index for water control quality, according to analysis of the implicit statistical exploration. Major benefit of MLRWQI can be applied for many water quality parameter and reduces the calculation time.
Figures and tables from the paper
| Water Quality Range | Status | Decision |
|---|---|---|
| 0 - 25 | Excellent | Highly suitable |
| 26 - 50 | Good | Safe for drinking |
| 51 - 75 | Moderate | Acceptable with caution |
| 76 - 100 | Poor | Requires treatment |
| 101+ | Very Poor | Unsuitable for drinking |
Table text extracted from the original PDF; superscript letters are shown inline. The original table image is below.
View original table image
| Parameter | Estimate | Std. Error | t value |
|---|---|---|---|
| pH | 1.501e+00 | 3.157e-15 | 4.755e+14 |
| EC | 6.969e-03 | 3.584e-18 | 1.944e+15 |
| TDS | 4.878e-03 | 4.582e-18 | 1.065e+15 |
| TH | 2.439e-02 | 3.558e-17 | 6.855e+14 |
| Ca | 9.756e-02 | 3.242e-17 | 3.010e+15 |
| Mg | 2.439e-01 | 4.573e-16 | 5.333e+14 |
| Na | 3.484e-02 | 3.587e-16 | 9.713e+13 |
| K | 4.878e-01 | 7.681e-16 | 6.351e+14 |
| HCO3 | 9.996e-03 | 3.265e-17 | 3.061e+14 |
| CL | 4.878e-02 | 1.390e-17 | 3.509e+15 |
| SO4 | 6.098e-02 | 5.097e-17 | 1.196e+15 |
| NO3 | 2.710e-01 | 4.050e-17 | 6.691e+15 |
Table text extracted from the original PDF; superscript letters are shown inline. The original table image is below.
View original table image
| Sample Id | MLRWQI Result | Status |
|---|---|---|
| 1 | 72.32662 | Acceptable with caution |
| 2 | 71.79665 | Acceptable with caution |
| 3 | 65.45161 | Acceptable with caution |
| 4 | 78.19810 | Requires treatment |
| 5 | 71.31420 | Acceptable with caution |
| 6 | 76.06922 | Requires treatment |
| 7 | 73.18838 | Acceptable with caution |
| 8 | 87.42254 | Requires treatment |
| 9 | 73.54070 | Acceptable with caution |
| 10 | 81.28886 | Requires treatment |
| 11 | 57.13784 | Acceptable with caution |
| 12 | 63.30500 | Acceptable with caution |
| 13 | 70.23089 | Acceptable with caution |
| 14 | 70.79344 | Acceptable with caution |
| 15 | 69.71905 | Acceptable with caution |
| 16 | 53.27026 | Acceptable with caution |
| 17 | 90.34690 | Requires treatment |
| 18 | 73.90533 | Acceptable with caution |
| 19 | 101.30088 | Unsuitable for drinking |
| 20 | 60.31038 | Acceptable with caution |
| 21 | 74.54708 | Acceptable with caution |
| 22 | 58.78836 | Acceptable with caution |
| 23 | 54.92815 | Acceptable with caution |
| 24 | 42.85709 | Safe for drinking |
| 25 | 63.00931 | Acceptable with caution |
| 26 | 49.58550 | Safe for drinking |
| 27 | 45.93504 | Safe for drinking |
Table text extracted from the original PDF; superscript letters are shown inline. The original table image is below.
View original table image
| 28 | 50.07841 | Acceptable with caution |
|---|---|---|
| 29 | 53.10386 | Acceptable with caution |
| 30 | 84.70177 | Requires treatment |
Table text extracted from the original PDF; superscript letters are shown inline. The original table image is below.
View original table image
References
26 in the original paper- Jalali M. Geochemistry characterization of groundwater in an agricultural area of Razan, Hamadan, Iran. Environ Geol. 2009;56:1479-88.
- Jimenez-Madrid A, Gogu R, Martinez-Navarrete C, Carrasco F. Groundwater for human consumption in karst environment: vulnerability, protection, and management. In: Karst Water Environment. Springer; 2019. p. 45-63.
- Awadh SM, Al-Mimar H, Yaseen ZM. Groundwater availability and water demand sustainability over the upper mega aquifers of Arabian Peninsula and west region of Iraq. Environ Dev Sustain. 2020. https://doi.org/10.1007/s10668-019-00578-z
- Jafar R, Awad A, Hatem I, Jafar K, Awad E, Shahrour I. Multiple linear regression and machine learning for predicting the drinking water quality index in Al-Seine Lake. Smart Cities. 2023;6(5):2807-27.
- Wagh SJ, Paithane PM, Sangale MD, Pondhe GM. Computation of groundwater quality of Baramati with the help of Fuzzy Water Quality Index (FWQI). Int Res J Multidiscip Technovation. 2023;5(6):43-57.
- Machiwal D, Jha MK, Singh VP, Mohan C. Assessment and mapping of groundwater vulnerability to pollution: Current status and challenges. Earth Sci Rev. 2018;185:901-27.
- Ray SPS, Elango L. Deterioration of groundwater quality: implications and management. In: Water Governance: Challenges and Prospects. Springer; 2019. p. 87-101.
- Subramani T, Elango L, Damodarasamy SR. Groundwater quality and its suitability for drinking and agricultural use in Chithar River Basin, Tamil Nadu, India. Environ Geol. 2005;47:1099-1110.
- Al-Aboodi AH, Hashim ZN. Assessment of groundwater vulnerability using LULC map and DRASTIC technique in Bahr AL-Najaf area, middle of Iraq. Tikrit J Eng Sci. 2019;26:1-9.
- Omran E-SE. A proposed model to assess and map irrigation water well suitability using geospatial analysis. Water. 2012;4:545-67.
- Wagh SJ, Paithane PM, Patil SN. Applications of fuzzy logic in assessment of groundwater quality index from Jafrabad Taluka of Marathawada region of Maharashtra state: a GIS based approach. In: Hybrid Intelligent Systems. Cham: Springer Int Pub; 2021.
- Salih SQ, Alakili I, Beyaztas U, Shahid S, Yaseen ZM. Prediction of dissolved oxygen, biochemical oxygen demand, and chemical oxygen demand using hydrometeorological variables: case study of Selangor River, Malaysia. Environ Dev Sustain. 2020:1-20.
- Patki VK, Jahagirdar S, Patil YM, Karale R, Nadagouda A. Prediction of water quality in municipal distribution system. Mater Today Proc. 2021. In press.
- Schmoll O, Howard G, Chilton J, Chorus I, editors. Protecting groundwater for health: managing the quality of drinking-water sources. London: IWA Publishing; 2006.
- Dhok RP. Water quality index of groundwater of Karha River Basin Area, Baramati, India. J Emerg Technol Innov Res. 2020;7(11). ISSN: 2369-5162.
- Dhok RP. Studies on groundwater quality and its suitability for drinking purposes in Baramati city, India. J Geogr Environ Earth Sci Int. 2016;5(1):1-11. ISSN: 2454-7352.
- Khalef WF, Abedali ST, Faris HN. Assessment of the water quality of the Hafar River using the water quality index (Canadian model). Int J Geogr Geol Environ 2022;4(1):13-15.
- Paithane PM. Yoga posture detection using machine learning. In: Artificial Intelligence in Information and Communication Technologies, Healthcare and Education. CRC Press; 2022. p. 27-33.
- Bureau of Indian Standards. BIS 10500: Drinking Water Standard. New Delhi; 1991. Available from: http://bis.org.in/bis/html/10500.html
- Nouraki A, Alavi M, Golabi M, Albaji M. Prediction of water quality parameters using machine learning models: a case study of the Karun River, Iran. Environ Sci Pollut Res. 2021;28:57060-72.
- Paithane PM. Random forest algorithm use for crop recommendation. ITEGAM JETIA. 2023;9(43):34-41.
- Silvert W. Fuzzy indices of environmental conditions. Ecol Model. 2000;130:111-9.
- Dhere A, Pondhe GM. Calculation of water quality rating (QI) and unit weight (WI) of individual parameters for the analysis of water quality index (WQI) of Bhima River in Pune District of Maharashtra in India. Eco-Chronicle. 2019;14(1):73-80.
- Paithane PM, Kakarwal SN. Automatic pancreas segmentation using a novel modified semantic deep learning bottom-up approach. Int J Intell Syst Appl Eng. 2022;10(1):98-104.
- Paithane P, Kakarwal S. LMNS-Net: Lightweight multiscale novel semantic-net deep learning approach used for automatic pancreas image segmentation in CT scan images. Expert Syst Appl. 2023;234:121064.
- R Core Team. R: A language and environment for statistical computing. Vienna, Austria: R Foundation for Statistical Computing; 2023. Available from: https://www.R-project.org/