
Research article · 2025 · Full text
International Journal of Biology SciencesPhenotypic distribution of ABO Blood Group and Rhesus factor among some college and school students of Karjat city, Ahilyanagar
Volume 7(6) · Pages 153–155 · DOI: 10.33545/26649926.2025.v7.i6c.369 ↗
Research areasBlood groups and transfusionDiabetes and associated disordersHepatitis B Virus Studies
Abstract
Author-writtenThe ABO blood group and Rh system is very much important for transfusion of blood and blood component, transplantation of organs and medico legal cases. ABO Blood group system is divided into A, B, AB and O on the basis of presence and absence of antigen A and B on the surface of the Red Blood Cells. Also Rhesus blood group is divided into positive and negative on the basis of presence or absence of D antigen. The current cross sectional study was carried out from August 2024 to October 2024. We use Spanclone Anti A + B + D (Rh0) Monoclonal Diagnostic reagents (Agglutinating Antisera) of Arkray Company for determination of blood groups. In that study we identified 548 (Male 292 & female 256) students blood groups from Dada Patil Mahavidyalaya and Mahatma Gandhi Vidyalaya, Karjat, Ahilyanagar. In the current study on the blood group distribution, the blood group B was 34.12%, then followed by blood group O (32.97%), blood group A (25.91%), and AB (12.41%) blood group. Also only a lesser number of the students were Rh negative (07.48 %), with the majority of Rh positive (92.52 %). Overall, the study serves as a valuable resource for enhancing blood center operations and ensuring preparedness in critical situations.
Summary
Source-checkedPlain-language reading of the full paper, prepared with AI and checked against the text. Each point links to the authors' own words.
Why it matters
- The ABO and Rhesus (Rh) blood group systems are critical for organ transplantation, medico-legal cases, and the transfusion of blood and its components. View evidence ↗
- Transfusing blood that is ABO incompatible can lead to severe risks, including kidney failure, acute intravascular hemolysis, and potentially fatal results. View evidence ↗
- Knowledge of local and regional blood group distributions is essential for the safe transfusion of blood and the competent operation of blood banks. View evidence ↗
The question
- The study aimed to determine the distribution of ABO and Rh phenotype blood groups among school and college students. View evidence ↗
What they did
- The study included a total of 548 participants from high school and college. View evidence ↗
- Blood samples were obtained from the participants using the finger pricking method. View evidence ↗
- Blood types were identified using the slide method of antibody-antigen agglutination with Spanclone Anti A + B + D (Rh0) Monoclonal Diagnostic reagents from Arkray Company. View evidence ↗
- This cross-sectional study was conducted between August 2024 and October 2024. View evidence ↗
What they found
- Blood group B was the most common (187 participants, 34.12%), followed by group O (151, 32.97%), group A (142, 25.91%), and group AB (68, 12.41%). View evidence ↗
- The majority of participants were Rh positive (507, 92.52%), while a small minority were Rh negative (41, 07.48%). View evidence ↗
- The participant group consisted of 292 males (53.28%) and 256 females (46.72%). View evidence ↗
What it means
- The authors conclude that the study provides a valuable resource for improving the operations of blood centers and ensuring readiness for critical medical situations. View evidence ↗
- The findings are considered valuable for blood transfusion programs, the general healthcare field, and medico-legal cases. View evidence ↗
Visual summary
3 visualsIllustrations explain the paper; charts are replotted from the paper's own table values.
Blood Group Distribution Overview
AI-generated conceptual illustration (human blood samples in test tubes). It explains the idea and does not show study data.
View source evidence ↗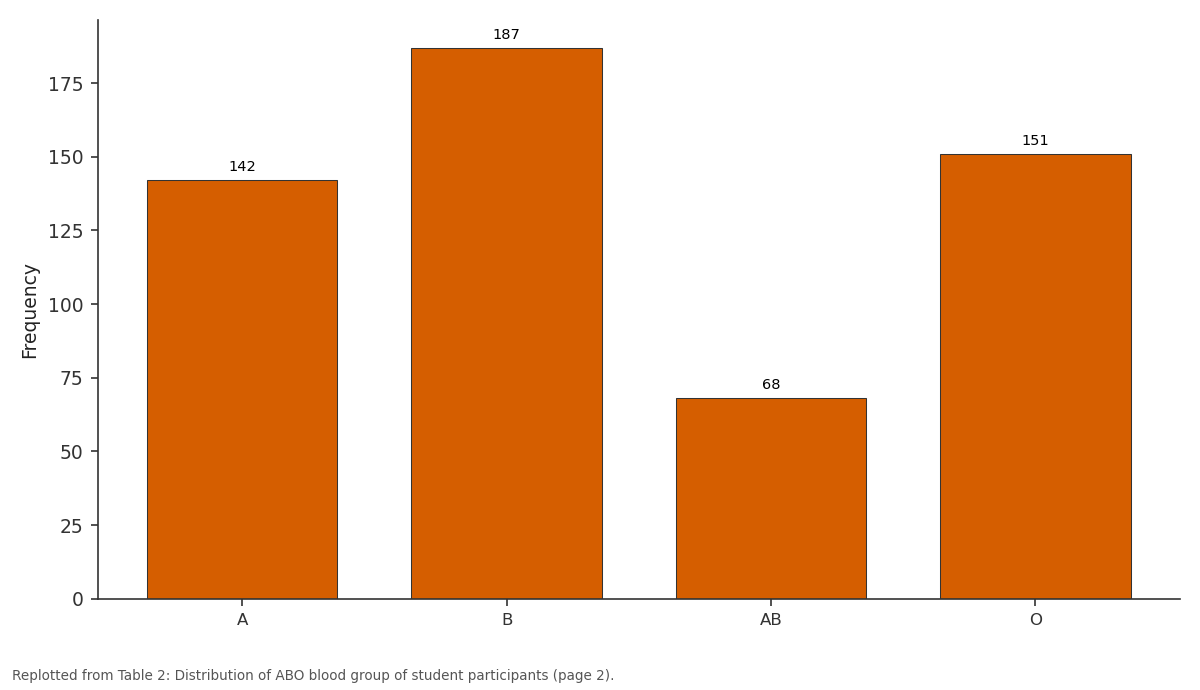
Frequency: A vs B vs AB vs O
Replotted from Table 2 (page 2) of the original paper. Every bar is the paper's own table value.
View source evidence ↗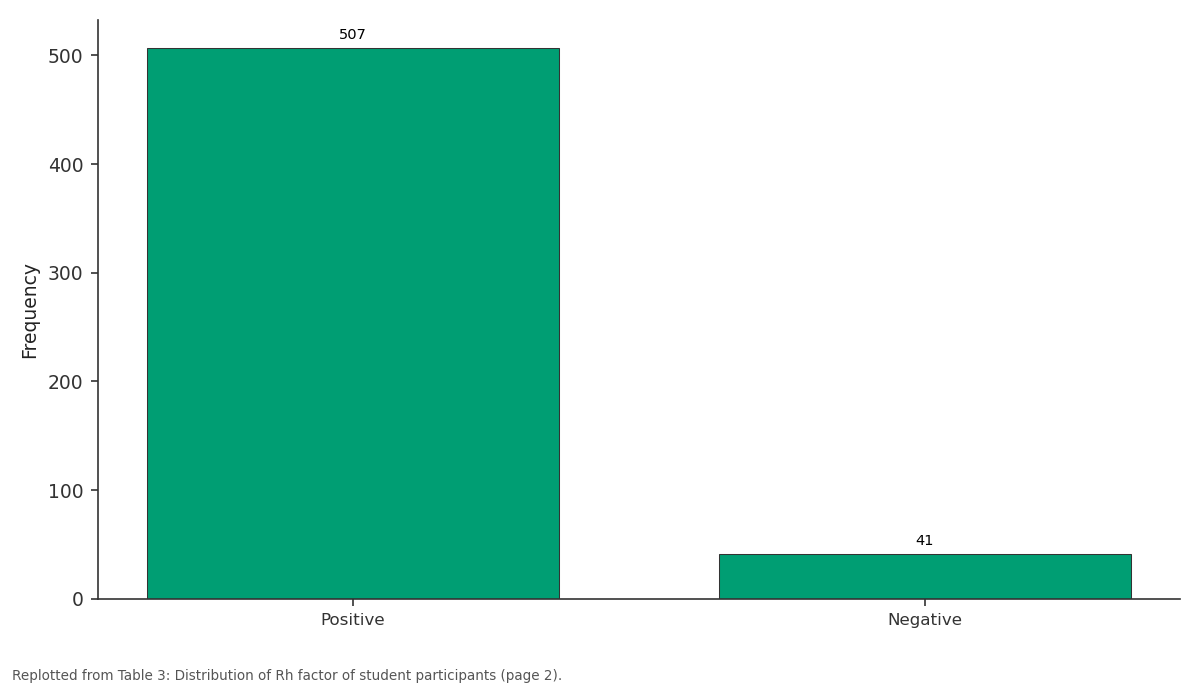
Frequency: Positive vs Negative
Replotted from Table 3 (page 2) of the original paper. Every bar is the paper's own table value.
View source evidence ↗Figures & tables
From the original paper Table 1
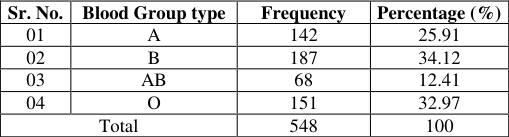 Table 2
 Table 3
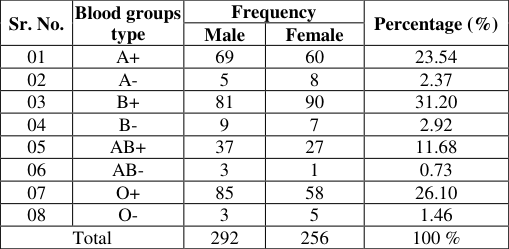 Table 4
Introduction
Blood in the body of human is considered to be the identity for all [18] . The blood type is determined by genes in their parents, blood group types differ between sister and brothers [8] . For blood transfusion and transplantation of organs the ABO and Rhesus blood systems are the most essential human blood type systems [4] . The Karl Landsteiner (1900) was discovered the ABO blood group type and Rhesus blood group system was discovered in 1939 [4,8] . Following the discovery of ABO, blood transfusion became a reality [6] . Karl Landsteiner was a revolutionary figure in the field of blood grouping and antigen antibody reaction. His contributions in the ABO blood group system significantly influenced in the field of medicine. He and his colleagues "Decastello and Sturli" discovered the "AB" blood group in 1902, enhancing our understanding of blood types and compatibility in medicine. By his essential contributions to transfusion system, Karl Landsteiner was honoured with the Nobel Prize in Physiology and Medicine in 1930 [23] . Levine and Stetson made an important discovery by identifying the "Rh blood group system in the 1940.
Understanding the local and regional distribution of this system is vital for competently operating blood banks and safety transfusion of blood [29] . About 29 blood group systems and an extensive array of over 700 distinct blood group antigens of the ABO blood group system and Rh blood group systems stand out as the foremost in importance, playing a crucial role in understanding and blood compatibility [16] . The principles of Mendelian genetics was adhere the ABO and Rh blood group system. The gene of ABO blood group system was situated on chromosome 9 and gene of Rh blood group system was situated on chromosome 1 [5] . In this system, antibodies are present in the plasma of blood without prior exposure through transfusion or pregnancy [17] . ABO and Rh blood group combinations vary extensively across races, ethnicities and socioeconomic groups globally. Understanding these variations is important for healthcare and efficient transfusion of blood in worldwide. Also this technique finds helpfulness in various scientific and medical fields, including medico legal cases, genetic, forensic science and the enquiry of population migration outlines. The transfusing ABO incompatible blood poses risks like hemolysis (acute intravascular), kidney failure and possibly fatal outcomes [29] . Understanding the ABO and Rh blood group system is vital for working Blood Bank Centre, local blood transfusion facility or a national level ensuring safe and effective transfusion practices [10] . This study will document the spreading and occurrence of ABO and Rh phenotype blood group and produce social awareness about safe blood transfusion facilities. The aim of the current study was to identify the distribution of ABO and Rh phenotype blood group between college and school students. A person"s blood type is determined based on the presence or absence of antigen A and B on the surface of red blood cells [8] . If the person have antigen A belong to blood group A, if the person have antigen B belong to blood group B, if the person have both antigen A and B belong to group AB and person without antigen A and B belong to the blood group O [8] . Also antigen D found on RBCs, a person with antigen D is Rhesus Positive and a person without D antigen is Rhesus Negative [4] . Knowing the blood group distribution in the community was important in case of the patients need blood urgently, is usually useful in managing alloimmunization situations and emergency cases like patients with rare blood group [6] . The distribution and frequency of blood group types vary from country to country, the most common blood type in the world is O, followed by A and followed by B and AB [13] . But in Turkey the most common blood type is A [12] . Pakistan the blood type is B. Rhesus blood type is more common in Rhesuspositive people, much less Rhesus-negative [26] .
Materials and Methods
In the present study a total of 548 college and highschool students are participated in the camp of blood group checking and check their blood group. We interacted with participants in the study for taken information like name, sex and age. The blood samples were collected from the participants by finger pricking method of blood collection. For identification of ABO and Rhesus factor blood types by using the slide method (antibodyantigen agglutination). We use Spanclone Anti A + B + D (Rh 0 ) Monoclonal Diagnostic reagents (Agglutinating Antisera) of Arkray Company. For identification take three separate drops of blood sample on the slide and then add antisera A, B and D and mixed them by using toothpicks. Then we observed Agglutination process for identification of blood groups. If agglutination was observed in A, it belonged to the A blood group. If observed agglutination in B; it belonged to B blood group. If agglutination observed in both A and B; it belonged to AB blood group and if no agglutination in both A and B then it belonged to the blood group O. If the agglutination was observed in "D", it is Rhesus-positive; if there is no agglutination, it is Rhesus-negative.
Result
In the current study, out of 548 student participants screened for blood group types from Dada Patil Mahavidyalaya and Mahatma Gandhi Vidyalaya, Karjat, district Ahilyanagar 292 (53.28%) were males and remaining 256 (46.72%) were females (Table A). In current study, most common blood group type observed among the participants was blood group B i.e. 187 (34.12 %), followed by blood group O i.e. 151 (32.97 %), then blood group A i.e. 142 (25.91 %) and blood group AB i.e. 68 (12.41 %) (Table B). Also the Rh positive participants in current study were 507 (92.52 %) and Rh negative participants were 41 (07.48 %) observed (Table C). The distribution of blood group among the college and highschool students in present study was shown in the table D.
Discussion
In India observed that differences in ABO blood group distribution [1,2,9,7,14,19,20,24,25,26,30] . Based on review of literature of "Northern India and Western India" the blood group B confirmed the highest occurrence (34-40%), then followed by blood group O (29-36%), blood group A (21-24%) and AB (5-11%) blood group [1,7,20,24,25,26,30] .
Blood group B, on the other hand, is the most frequent in Pakistan, according to Sharma, et al. In present study, ABO blood group distribution closely matches previous research findings, with the notable exclusion of Agarwal et al. [1] multicentric study. This research highlighted that, Western India as having the maximum incidence of O blood group. Also research conducted in Eastern India and Southern India indicated that O blood group has the peak occurrence, ranging from 34-40%, followed by blood group B (30-40%), blood group A (20-24%) and AB (6-7%) blood group.
Agrawal et al. [2,9,19] , identified O blood group with the maximum incidence, while research by Gupta et al. [1,7,14,20,24,25,26,30] stated that, blood group B as the predominant blood group in Central India. The diversity in ABO and Rh blood grouping across regions and ethnicities highlights the significance of precise blood typing. This informative research is important for maintaining thorough records at blood centers, ensuring effective transfusion services and addressing legal and medical issues with accuracy [5] . The distribution of ABO and Rh blood group is dynamic for the efficient administration of blood centers. Therefore, it is vital to possess evidence regarding the prevalence of this blood group in any given resident. The knowledge of the blood group distribution is important for the operations and holds significant importance in clinical studies. This information is instrumental in addressing public health challenges, particularly in decreasing the maternal death rate. The overall Rhesus positivity and negativity were 507 (92.52%) and 41 (07.48%), respectively, which is consistent with the bulk of research conducted in different parts of the world [3,11,15,22,26,30] .
Conclusion
The present study accompanied at Dada Patil Mahavidyalaya and Mahatma Gandhi Vidyalaya, Karjat provides comprehensive understandings into blood group distribution. It finds blood group "B" as the most predominant and blood group AB as the least common. In the current study on the blood group distribution, the blood group B was 34.12%, then followed by blood group O (32.97%), blood group A (25.91%), and AB (12.41%) blood group. Also only a lesser number of the students were Rh negative (07.48 %), with the majority of Rh positive (92.52 %). This information would be valuable in the healthcare field, blood transfusion programs and medico legal cases.
Overall, the study serves as a valuable resource for enhancing blood center operations and ensuring preparedness in critical situations.
Figures and tables from the paper
| Sr. No. | Characteristics | Frequency | Percentage (%) |
|---|---|---|---|
| 01 | Male | 292 | 53.28 |
| 02 | Female | 256 | 46.72 |
| Total | 548 | 100 % |
Table text extracted from the original PDF; superscript letters are shown inline. The original table image is below.
View original table image
| Sr. No. | Blood Group type | Frequency | Percentage (%) |
|---|---|---|---|
| 01 | A | 142 | 25.91 |
| 02 | B | 187 | 34.12 |
| 03 | AB | 68 | 12.41 |
| 04 | O | 151 | 32.97 |
| Total | 548 | 100 |
Table text extracted from the original PDF; superscript letters are shown inline. The original table image is below.
View original table image
| Sr. No. | Rhesus Type | Frequency | Percentage (%) |
|---|---|---|---|
| 01 | Positive | 507 | 92.52 |
| 02 | Negative | 41 | 07.48 |
| Total | 548 | 100 |
Table text extracted from the original PDF; superscript letters are shown inline. The original table image is below.
View original table image
| Sr. No. | Blood groups type | Frequency | — | Percentage (%) |
|---|---|---|---|---|
| Male | Female | |||
| 01 | A+ | 69 | 60 | 23.54 |
| 02 | A- | 5 | 8 | 2.37 |
| 03 | B+ | 81 | 90 | 31.20 |
| 04 | B- | 9 | 7 | 2.92 |
| 05 | AB+ | 37 | 27 | 11.68 |
| 06 | AB- | 3 | 1 | 0.73 |
| 07 | O+ | 85 | 58 | 26.10 |
| 08 | O- | 3 | 5 | 1.46 |
| Total | 292 | 256 | 100 % |
Table text extracted from the original PDF; superscript letters are shown inline. The original table image is below.
View original table image
References
4 in the original paper- Arrow K, Dasgupta P, Goulder L, Daily G, Enrich D, Heal G et al. Are we consuming too much?, Journal of Economic Perspective 2004:18:147-172.
- Baland J, Bardhan Das S, Mookhrjee D, Sarkar R. The Environmental impact of poverty: Evidence from firewood collection in rural Nepal. Economic Development and Cultural Change 2010;59(1):23-61.
- Benato A, Pezzuolo A, Stoppato A, Mirandola A, Pandey S. Improvement of the Energy System of a Nepali Village through Innovative Exploitation of Local Resources. Energy Procedia 2016;101:790-797.
- Bhat BP, Sachan MS. Fuelwood consumption along the altitudinal gradient in Mountain villages of India. Biomass and Bioenergy 2004;27:69-75.