
Research article · 2025 · Full text
International Journal of Geography Geology and EnvironmentAvailability of basic amenities in planned and unplanned areas of Rohtak city
Volume 7(3) · Pages 49–54 · DOI: 10.22271/27067483.2025.v7.i3a.369 ↗
Research areasUrban and Rural Development Challenges
Abstract
Author-writtenThe present paper attempts to study the availability of basic amenities such as safe drinking water, toilet facility, drainage connectivity and availability of electricity, LPG in selected wards of Rohtak Municipal Corporation in planned areas and unplanned areas. The study is based on primary data collected during March 2018. In total 259 households were proposed from four selected wards (ward-1, 2 and ward 8, 9) through a semi-structured questionnaire. The ward level figures are tabulated on individual amenities. The standard deviation among the wards with respect to the concerned amenity is also worked out to study the level of variations among the wards even within the city limit. Among the major findings, it was observed that the availability of basic amenities is better in the areas that were developed as a part of planned area. Afterwards, the city somehow failed to cope with the haphazard urban sprawl resulting in a dismal condition of basic amenities in the periphery and areas having a greater percentage of slum households.
Summary
Source-checkedPlain-language reading of the full paper, prepared with AI and checked against the text. Each point links to the authors' own words.
Why it matters
- Rapid urbanization leads to increased city growth, which often creates challenges in meeting the rising demand for urban infrastructure and services. View evidence ↗
- Despite significant investments in urban development since India's independence, many towns and cities still suffer from a lack of basic facilities. View evidence ↗
- Rohtak city has experienced urban sprawl toward the Delhi NCR, resulting in significant disparities in basic facilities between its planned and unplanned areas. View evidence ↗
The question
- The study aims to evaluate the physical and social availability of basic amenities, including safe drinking water, toilet facilities, electricity, and LPG, in planned versus unplanned areas of Rohtak city. View evidence ↗
What they did
- The study utilized secondary data from the 2011 House listing and Housing Census to provide an overall context for Rohtak City. View evidence ↗
What they found
- Basic amenities are generally more available in areas developed as part of the city's planned development. View evidence ↗
- Sewerage problems are significantly more prevalent in unplanned areas (85.15% to 88.15%) compared to planned areas (43.56%). View evidence ↗
- Awareness and access to public toilets are much lower in unplanned areas, where only 3.96% of respondents are aware of the facility, compared to planned areas where 33.67% are unaware. View evidence ↗
- Satisfaction with sewerage facilities is higher in planned areas (65.34%) than in unplanned areas (28.7%). View evidence ↗
- A large majority of respondents in unplanned areas (83.16%) own up to two LPG cylinders, often through the Ujjwala Yojana scheme. View evidence ↗
- Satisfaction with LPG services is higher in planned areas (79.21%) than in unplanned areas (51.48%). View evidence ↗
- Satisfaction with LPG pricing is significantly lower in unplanned areas (7.92%) compared to planned areas (52.48%). View evidence ↗
What it means
- The authors conclude that the availability of basic amenities is directly influenced by socio-economic factors, specifically the income and purchasing power of the residents. View evidence ↗
- The authors state that the city failed to manage haphazard urban sprawl, leading to poor basic amenities in peripheral areas and slums. View evidence ↗
Visual summary
1 visualsIllustrations explain the paper; they do not show study data.
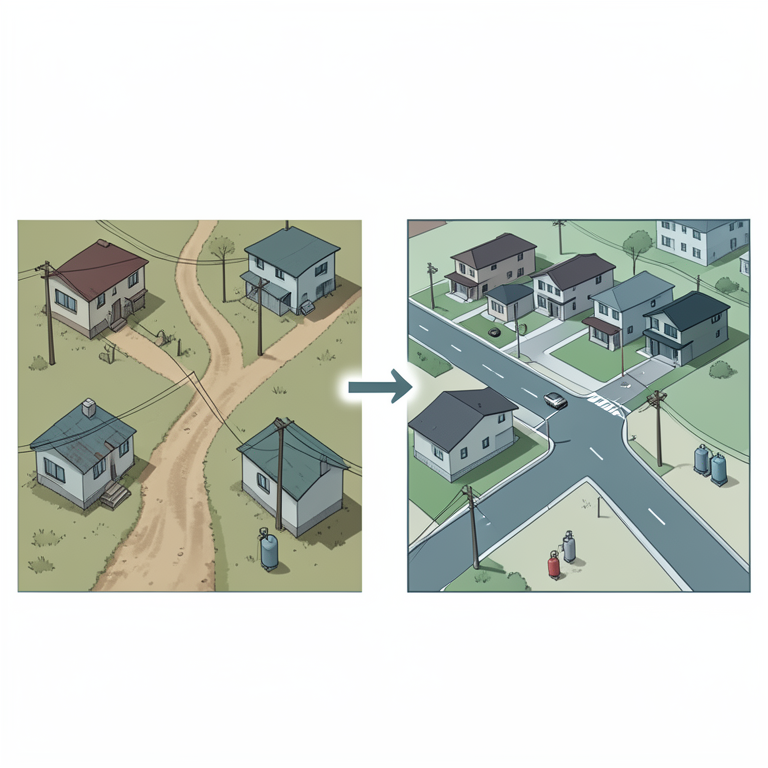
Socio-Economic Influence on Amenities
AI-generated conceptual illustration (Urban residential neighborhoods in Rohtak city, India). It explains the idea and does not show study data.
View source evidence ↗Figures & tables
From the original paper Table 2
 Table 3
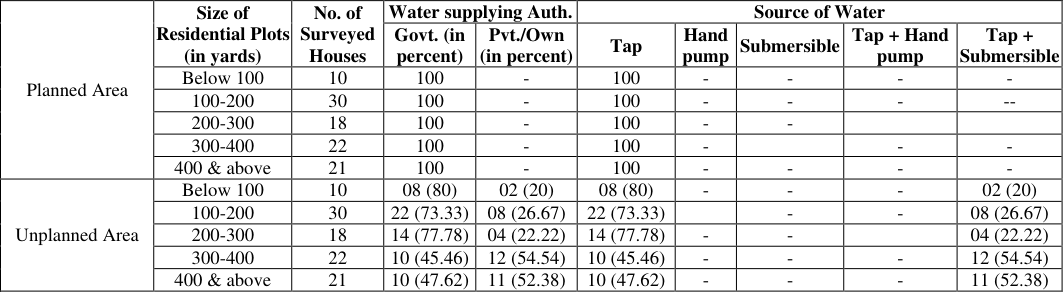 Table 4
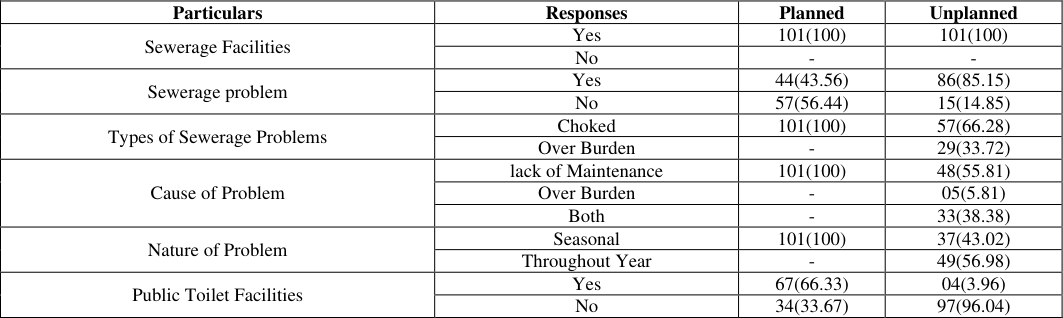 Table 5
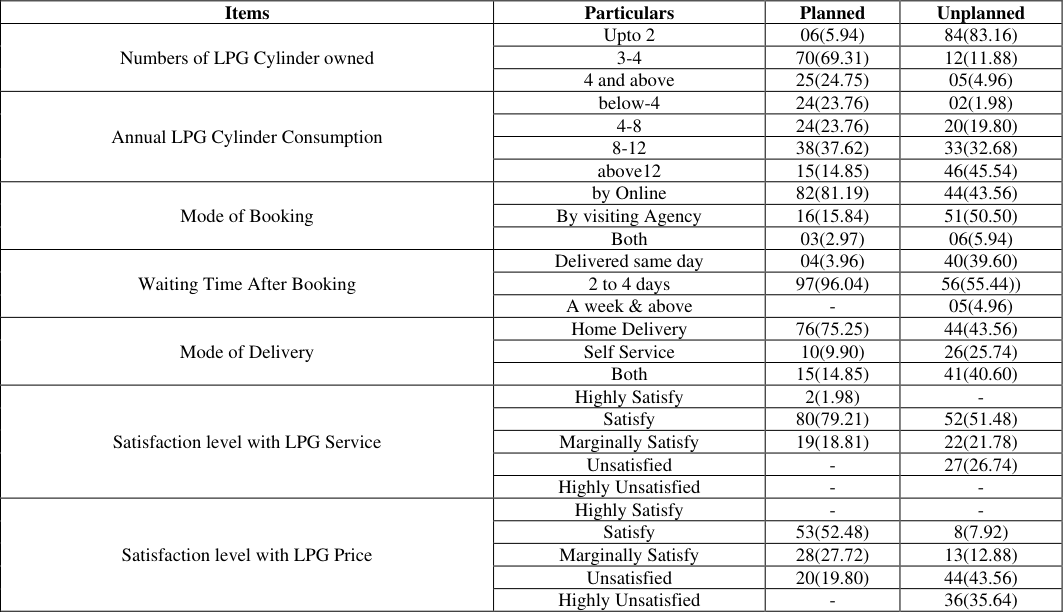 Table 6
Introduction
In a welfare society, many development programs are prepared to check the basic facilities and quality of life and improve the quality of life so that a welfare state can be established and plans can be implemented for the future. When the phenomenon of urbanization is widely implemented, the growth of the city increases. And along with this, many problems also come with increasing demand in urban infrastructure and services. Substantial investment in urban development after independence in India has also led to a lack of basic facilities in various towns and cities of the country. Rohtak city became the second class one city of Haryana in 1981 census. The urban development of Rohtak city has taken place in the last few decades. Urban population growth in Rohtak city was 36.32 percent in 2001, whereas 27.06 in 2011. The urban sprawl of Rohtak city is towards Delhi NCR, there is a significant difference in the basic facilities available in the planned and planned areas of that city. The main objective of the present study is to explain the physical and social level of basic amenities (safe drinking water, latent facility, electricity and LPG) available to the residents within the Planned and unplanned areas of the two parts of Rohtak city. In this, the satisfaction level of respondents has also been tested to check for inter-city development.
Objective
The present paper intends to: 1. Study the availability of basic amenities among the sample household in the selected planned and unplanned wards.
Analyze the extent of disparities in basic amenities among these wards
Data Source 1. Primary data collected during February 2018 from 259 sample households of 4 selected wards of Rohtak City. 2. Secondary data from House listing& Housing Census 2011 for the overall scenario of Rohtak City. This section deals with the demographic profile of the both planned and unplanned sampled wards and surveyed households. Demographic profile of any region gives an insight into the nature and level of development of any region. Table 1 shows that in both the sampled wards the size of population is almost equal while the sex ratio differs in both the areas. In unplanned areas the sex ratio is slightly higher in comparison to planned area. Almost similar characteristics have been observed in case of observed data of surveyed households. In surveyed households of unplanned area, a considerable gap has been noticed in male-female ratio i.e. 99, greater than surveyed households of planned area. While in term of literacy rate, a situation has been observed that the literacy rate of planned sampled ward as a whole and surveyed household is found higher than unplanned area. Generally, it has been observed that the correlation between sex ratio and literacy rate is often negative.
Demographic Profile of Surveyed Wards
Demographic Profile of Surveyed Wards
Socio-Economic Profile of Surveyed Households
Table : 2 show that the social composition of surveyed households, basically social composition, includes religion and caste. It has been region-wise observed that people have multiple identities. Most of the Indian cities are numerically dominated by Hindus, while the number of followers of the other religions such as Muslim, Sikh and Jain etc. are in minor religious groups. Rohtak city has experienced more or less similar conditions. Although, the religious composition does not affect the availability of basic amenities but it has been often noticed that most of the followers of Jainism engaged in business, their economic conditions are very sound, and they lived in core area of city where basic amenities are adequate. They are very much too capable to spend more money on basic amenities. In case of surveyed households, Hinds are in majority as compared to other religious groups. In planned area, a little more than ninety six percent of total surveyed households are Hindus followed by Jains and Sikhs. In case of the unplanned area, the religious composition slightly differs from planned area. Although Hindu is the major religion, the number of Sikhs and followers of other religions are comparatively found higher than in the planned area. Similarly, religious composition and categorical composition have very important base of people's identity in India. The society has been categorised in different groups such as General, Other backward Class (OBC), Schedule caste (SC) and Schedule tribes (ST).-economic backwardness and have no assets of earnings sustainable livelihood. The source of income affects the living standard and living shelter. If we look over the categorical composition of surveyed households, it is found that in planned area, the number of backward classes and General class includes the castes are Other* Muslim, Buddhist, Islam and Christian characterised by higher and middle strata of society which. Backward class includes the castes which are economically backward with lack of earning assets and Schedule caste and schedule tribe includes the castes which are socially suffering from socioschedule caste households is very less. The reason of this is that in planned area the land prices are very high; so, the purchase of plots/houses are beyond the reach of almost SC and OBCs. Table 2 shows the similar positions. The surveyed households of planned area show that the number of Schedule caste and other backward class households are less than general category households. In case of unplanned area, which show a different class where number of General category households are a little more than 43 percent and followed by OBC and SC surveyed household which is relatively higher than the planned area. The occupational structure of people plays a significant role in the development of economy of any country. Occupation refers to the nature and type of earning sources and profession of any individual engaged in particular economic activity. It influences the life and living standard of individuals. Even the availability of basic amenities also depends on occupation of people. Table 3 depict the occupational structure of surveyed households of sampled wards undertaken for the study. It shows considerable differences in occupational structure. In planned area a little more than 80 percent of respondents engaged in govt. job followed by people who are having private job and businessmen while nearly 2 percent are unemployed. In case of unplanned area, occupational structure is more diversified. Here, nearly 38 percent of respondents work as labourer and nearly 29 percent are unemployed. The difference between people who are having govt. jobs in planned and unplanned area is much higher. Some of the respondents earn their livelihood by street vending. The people who are having low and uncertain wages live within minimum basic needs. They consume everything below the average consumption pattern.
| Area | Occupation | — | — | — | — | — | — |
|---|---|---|---|---|---|---|---|
| Govt. Job | Private Job | Business | Unemployed | Auto Driver | Labour | Street Vender | |
| Planned | 81(80.2) | 12(11.88) | 06(5.94) | 02(1.98) | - | - | - |
| Unplanned | 22(21.78) | 03(2.97) | 03(2.97) | 29(28.72) | 04(3.96) | 38(37.62) | 02(1.98) |
Table text extracted from the original PDF; superscript letters are shown inline. The original table image is below.
View original table image
| Area | Religion | — | — | — | Category | — | — |
|---|---|---|---|---|---|---|---|
| Hindu | Sikh | Jain | Others* | General | OBC | SC | |
| Planned | 97(96.04) | 01(0.99) | 03(2.97) | - | 98(97.03) | 02(1.98) | 01(0.99) |
| Unplanned | 94(93.07) | 04(3.96) | 01(0.99) | 02(1.98) | 44(43.57) | 26(25.74) | 31(30.69) |
Table text extracted from the original PDF; superscript letters are shown inline. The original table image is below.
View original table image
Availability of Drinking Water Facility and the Satisfaction Levels of Households
The below table 4 provides information regarding own source of water supply in accordance with the size of respondents' plots in the planned and unplanned areas taken for the study. Looking at the planned area, we find that the attitude of the respondents living here is very clear about the health and sanitation. The above table 4 provides information regarding own source of water supply in accordance with the size of respondents' plots in the planned and unplanned areas taken for the study. Looking at the planned area, we find that the attitude of the respondents living here is very clear about the health and sanitation. Therefore, all respondents use tap water in the planned area, which is supplied by the public health department. This facility is not adequate in accordance with the sizes of houses in the planned area. It is because of operating hours of water supply in the entire area is with the uniform duration whereas the requirements of residence; belong to higher strata of society: living in the planned area; do not cope with their supply of water and their standard of living, their educational and professional backgrounds as mentioned the tabulated figures in 4. The respondents in the unplanned area have stated that both the government and private water supplying authority receive it from the water supply. In this area, the government has laid a pipeline, but the quantum of water is relatively less during operating hours. It is due to seasonal fluctuation in supply of water from its source. It is there for, in order to meet their additional tie demand for water; they take the service from the private suppliers. In some of cases, they have installed a submersible in their houses. In this table 4 average size of respondents' plots is 200 and 300 yards; as a result, the respondents take the 77.8 percent water from the source of water supply, but with increasing the size of residential houses, the public health services for water supply tend to decrease. It has been noticed that the large residential plot owners engaged in some of commercial activities; demand additionally supply of water; resulted in lack of water supply. This tendency has created a conflicting situation of demand and supply of water in the planned residential area. One of the main reasons for this is that because of large size of plots, there are more rooms; as a result, they tend to give these rooms on rents. This type of tendency has given rise to increase in water consumption to a large extent
| Planned Area | Size of Residential Plots (in yards) | No. of Surveyed Houses | Water supplying Auth. | — | Source of Water | — | — | — | — |
|---|---|---|---|---|---|---|---|---|---|
| Govt. (in percent) | Pvt./Own (in percent) | Tap | Hand pump | Submersible | Tap + Hand pump | Tap + Submersible | |||
| Below 100 | 10 | 100 | - | 100 | - | - | - | - | |
| 100-200 | 30 | 100 | - | 100 | - | - | - | -- | |
| 200-300 | 18 | 100 | - | 100 | - | - | |||
| 300-400 | 22 | 100 | - | 100 | - | - | - | ||
| 400 & above | 21 | 100 | - | 100 | - | - | - | - | |
| Unplanned Area | Below 100 | 10 | 08 (80) | 02 (20) | 08 (80) | - | - | - | 02 (20) |
| 100-200 | 30 | 22 (73.33) | 08 (26.67) | 22 (73.33) | - | - | 08 (26.67) | ||
| 200-300 | 18 | 14 (77.78) | 04 (22.22) | 14 (77.78) | - | - | 04 (22.22) | ||
| 300-400 | 22 | 10 (45.46) | 12 (54.54) | 10 (45.46) | - | - | - | 12 (54.54) | |
| 400 & above | 21 | 10 (47.62) | 11 (52.38) | 10 (47.62) | - | - | - | 11 (52.38) |
Table text extracted from the original PDF; superscript letters are shown inline. The original table image is below.
View original table image
Status and Satisfaction Levels of Sewerage Facility and Public Toilet in Households
In this section, information is taken from the respective respondents about sewerage facility and its related problems in selected wards in the planned and unplanned areas. The problems in sewerage facility in the planned and unplanned area are more or less, and same and the factors differ in different areas. There is seasonal fluctuation in problematic areas or remained same throughout the year. Keeping in view, table 5 show that sewerage facility is available both in planned and unplanned areas, but problems are in both areas are different. It is because of the unplanned area underdeveloped with lower levels of socio-economic relations. 43.56 percent of respondents had confirmed sewerage problems in planned area. The problems related to sewerage facility in the planned area, are reported by 43.56 percent, of the respondents. In case of unplanned area, this percentage of respondents has been 88.15 percent. In the planned area, this problem is found more in small size plots. In case of large size plots, the problem is aggravated during the rainy season. The Municipal Corporation authorities are unable to find any permanent solution to address this problem in a right way. Despite having a 100 percent sewerage facility in the unplanned area, sewerages are choked and overflowed in the rainy season as sewerage clearing operations are not executed. It is reported that these problems, still prevail as 56.02 percent of the respondents have reported that it is mainly a seasonal problem. Municipal Corporation has made it mandatory to public toilet facility in a particular location in planned area. But out of this 33.67 percent of the respondents are not aware of the location of public toilet facility in their area. This situation is found even worse in unplanned area. Only 3.96 percent respondents know that Municipal Corporation has facilitated them with public toilet facility. In the area of public toilet in the unplanned area, the Municipal has provided a mobile toilet facility, which is in a very bad condition, cleaning and maintenance of public toilet in the planned area is satisfactory, as it is used only by local shopkeepers and employees, while in the unplanned area, the respondents have pointed out that the conditions of public toilet is in very bad condition. It is because of the problems of defecation in open areas. In order to know the satisfactory levels of sewerage facility and public toilet; a survey was conducted as result a comparative shows the respondent as follows:
| Particulars | Responses | Planned | Unplanned |
|---|---|---|---|
| Sewerage Facilities | Yes | 101(100) | 101(100) |
| No | - | - | |
| Sewerage problem | Yes | 44(43.56) | 86(85.15) |
| No | 57(56.44) | 15(14.85) | |
| Types of Sewerage Problems | Choked | 101(100) | 57(66.28) |
| Over Burden | - | 29(33.72) | |
| Cause of Problem | lack of Maintenance | 101(100) | 48(55.81) |
| Over Burden | - | 05(5.81) | |
| Both | - | 33(38.38) | |
| Nature of Problem | Seasonal | 101(100) | 37(43.02) |
| Throughout Year | - | 49(56.98) | |
| Public Toilet Facilities | Yes | 67(66.33) | 04(3.96) |
| No | 34(33.67) | 97(96.04) |
Table text extracted from the original PDF; superscript letters are shown inline. The original table image is below.
View original table image
The tabulated figures of observation show that in table 6 sewerage facilities are available in the planned and unplanned area, but the problematic areas are different in both areas. In the planned and unplanned areas, the satisfaction level of respondents is contrary to each other. However, the planned area with 65.34 percent respondents felt satisfied with the sewerage facility. On the other hand, there were 19.80 percent of the respondents who felt highly satisfied and 14.9 percent of the respondents who felt marginally satisfied. This area is most well-maintained residential area of the Rohtak city. In the unplanned area only 28.7 percent of the respondents felt satisfied for sewerage facility, while 41.58 percent of the respondents felt unsatisfied. It is because of the problems of sewerage is more severe in this area. As indicated in table 6, there were 29.70 percent of the respondents who felt highly satisfied, whereas, 44.58 percent of the respondents felt satisfied and 16.83 percent of the respondents felt marginally satisfied. In the planned residential area in terms of toilet facility. In case of unplanned area there were 96.04 percent of the respondents, who felt highly unsatisfied and 3.9 percent of the respondents who felt marginally satisfied in terms of public toilet facility. The shows that the findings were contrary to each-other regarding public toilet facility in the planned and unplanned areas of Rohtak city. In case of the residence of unplanned area, there are large number of labour class as well as Scheduled Caste population. Hence, it is obvious from the multifaceted discussion that the distribution of basic amenities and services are determined by various socio-economics and personal factors. The study, carried out in the planned and unplanned residential area, shows a considerable variability, depending upon the prevailing local conditions of the residing population. The study carried out in different residential areas shows a significant outcome; as responded by different types of respondents taken for the study. However; the residents of planned and unplanned area indicate some of areal characters which determine the tendency of consumers towards different modes of energy consumption and their mode of payment, as justified by the observed first-hand information. On the basis of information received from the respondents, it has been revealed as to how many LPG cylinders a respondent owns; what is the annual consumption of LPG cylinders what is their mode of booking and waiting time after booking and what is the mode of delivery of LPG cylinder and finally satisfaction level of respondents with respect to LPG service and its price. It is observed that 69.39 per-cent of the respondents in planned area own two or more cylinders. On the contrary, 83.16 percent respondents of unplanned area own two cylinders each. However, the annual consumption of LPG in unplanned area far exceeds consumption in unplanned area. Most of the ST and SC category people inhabitant the unplanned area. Thus, most of the households in unplanned area have two cylinders under the scheme of Ujjwala Yojana sponsored by the central government. There is no connection between urbanization and basic amenities as one can find large differences among people of the same city in their standard of living and basic amenities available to them. This is quite clear from the surveys done in the unplanned and the planned areas of Rohtak. Both these areas are occupied by people from different religions, castes, and occupational groups, whose occupational level and socio-economic status directly affect the availability of basic amenities that they get. Planned area is mostly occupied by service class people whereas unplanned area is inhabitant basically by labour class. In both these areas, it is clearly visible that the facilities of declining water supply, sewerage system, toilet facility, LPG and electricity are directly affected by the income and purchasing power of the respondents.
| Items | Particulars | Planned | Unplanned |
|---|---|---|---|
| Numbers of LPG Cylinder owned | Upto 2 | 06(5.94) | 84(83.16) |
| 3-4 | 70(69.31) | 12(11.88) | |
| 4 and above | 25(24.75) | 05(4.96) | |
| Annual LPG Cylinder Consumption | below-4 | 24(23.76) | 02(1.98) |
| 4-8 | 24(23.76) | 20(19.80) | |
| 8-12 | 38(37.62) | 33(32.68) | |
| above12 | 15(14.85) | 46(45.54) | |
| Mode of Booking | by Online | 82(81.19) | 44(43.56) |
| By visiting Agency | 16(15.84) | 51(50.50) | |
| Both | 03(2.97) | 06(5.94) | |
| Waiting Time After Booking | Delivered same day | 04(3.96) | 40(39.60) |
| 2 to 4 days | 97(96.04) | 56(55.44)) | |
| A week & above | - | 05(4.96) | |
| Mode of Delivery | Home Delivery | 76(75.25) | 44(43.56) |
| Self Service | 10(9.90) | 26(25.74) | |
| Both | 15(14.85) | 41(40.60) | |
| Satisfaction level with LPG Service | Highly Satisfy | 2(1.98) | - |
| Satisfy | 80(79.21) | 52(51.48) | |
| Marginally Satisfy | 19(18.81) | 22(21.78) | |
| Unsatisfied | - | 27(26.74) | |
| Highly Unsatisfied | - | - | |
| Satisfaction level with LPG Price | Highly Satisfy | - | - |
| Satisfy | 53(52.48) | 8(7.92) | |
| Marginally Satisfy | 28(27.72) | 13(12.88) | |
| Unsatisfied | 20(19.80) | 44(43.56) | |
| Highly Unsatisfied | - | 36(35.64) |
Table text extracted from the original PDF; superscript letters are shown inline. The original table image is below.
View original table image
Conclusion
On the basis of this study, which shows that is there is considerable growth in basic amenities and services renewed by the local civics' bodies and the urban development authority of planned or unplanned residential area of Haryana. This entire Census based statistical figures of the Census periods 2001-2011 indicate a negative and positive growth of the basic amenities and services and the spatial infrastructural facilities in the planned and unplanned areas of Rohtak cities. This study shows an integrated approach to analysis the advantages and disadvantages positions of various locational advantages of the basic necessities like drinking water and other sanitary outlets of the planned and unplanned residential areas of Rohtak city. Hence, the study gives an insight to the varied problematic areas of existing positions of spatial infrastructure facilities and other services rendered by the different urban estate authorities; including the urban estate development companies operating under corporate sectors to supply a regular service of basic human needs both taken of residential area under taken for the study. Lastly, there are some are some of concrete suggestions; which have been recommended for further improvement in future scenario of these selected residential urban areas of Rohtak city.
References
18 in the original paper- Ahmad N, Shamshad. A geographical analysis of availability of amenities in scheduled caste households in India. Am Int J Res Humanit Arts Soc Sci. 2013;4(1):56-65.
- Alkema L. Levels of urbanization in the world's countries: Testing consistency of estimates based on national definitions. J Popul Res. 2013;30(4):291-304.
- Atkinson D. Urbanisation: Global patterns and trend. Geo Active Ser. 2016;28(1):1-6.
- Bagchi S, Chattopadhyay S. Decentralized urban governance in India: Implications for financing of urban infrastructure. Econ Polit Wkly. 2004;39(49):5253-5260.
- Bala A. Trends and levels of urbanization in Haryana. An Int J. 2014;12:115-117.
- Banerjee S. Urban growth and access to basic services. Econ Polit Wkly. 1994;29(48):3032-3033.
- Bhagat RB. Dynamics of urban growth by size class of towns and cities in India. Demogr India. 2004;33(1):3374-3778.
- Bhagat RB. Urbanization and access to basic amenities. Urban India. 2011;31(1):1-14.
- Bhagat RB. A turnaround in India's urbanization. Asia Pac Popul J (ESCAP). 2012;27(2):23-39.
- Bhagat RB. Urbanisation and access to basic amenities in India. Urban India. 2011;31(1):1-14.
- Bhagat RB. Emerging pattern of urbanisation in India. Econ Polit Wkly. 2011;46(34):10-12.
- Bhagat RB, Parihar A. Access to basic amenities in urban India: Implications for health and wellbeing. Popul Geogr. 2007;29(1-2):15-26.
- Bhagat RB. Challenges of rural-urban classification for decentralized governance. Econ Polit Wkly. 2002;37(25):2413-2416.
- Bhagat RB. Conditions of SC/ST households: A story of unequal improvement. Econ Polit Wkly. 2013;48(41):62-66.
- Bhalla S. Development, poverty and policy: The Haryana experience. Econ Polit Wkly. 1985;30(41):2619-2634.
- Census of India. Final population totals: Urban agglomerations and towns. Series-1, India. New Delhi: Registrar General and Census Commissioner of India; 2001. p. 59-70.
- Census of India. Provisional population totals: Ruralurban distribution. Paper-2, Vol.1, Haryana, Series-1. New Delhi: Registrar General and Census Commissioner of India; 2011. p. 12.
- Chen M, et al. The global pattern of urbanization and economic growth: Evidence from the last three decades. PLoS One. 2014;9(8):e103799.