
Research article · 2025 · Full text
International Journal of Agriculture and NutritionQuantitative analysis of radioactive waste and its effect on soil and vegetable crops
Volume 7(5) · Pages 21–26 · DOI: 10.33545/26646064.2025.v7.i5a.223 ↗
Research areasRadioactivity and Radon MeasurementsGraphite, nuclear technology, radiation studies
Abstract
Author-writtenIn in the present research paper effect on the growth and phosphorus absorption in different part of the vegetable crops viz., seedling, flowering and harvesting (fruit/vegetable) stages was studied in water culture, pot culture experiment was carried out in august 2023- december 2023 with four levels of phosphorus using P32 tagged super phosphate viz., 0.0, 0.5, 1.0, 1.50, gm P2O5/35 cm (Pot), respectively. A uniform doses of recommended N & K were applied along with uptake of utilization of applied fertilizer as Phosphorus treatment in dark clay of Moradabad Distt. U.P. in India. An increase in the phosphorus of the absorbed phosphorus trans-located to the short and the reduction of root weight were the most consistent symptoms. Dry matter yield, total uptake of phosphorus and percentage of P32 derived from fertilizer increased significantly with increasing level of phosphorus. But percentage utilization of added phosphorus showed a reverse trend at all the stages of vegetable crops growth. Harvesting (fruit/vegetable) yield increased significantly with increasing phosphorus levels in all three vegetable crops with their respective controls.
Summary
Source-checkedPlain-language reading of the full paper, prepared with AI and checked against the text. Each point links to the authors' own words.
Why it matters
- The disposal of waste from nuclear power plants into natural soil and water can lead to nutritional imbalances in these environments. View evidence ↗
- Phosphatic fertilizers are often inefficient because 75-80% of the phosphorus becomes fixed in the soil, leaving only 15-20% available for plant uptake. View evidence ↗
The question
- The study aimed to investigate how different levels of phosphorus affect the growth and utilization in cauliflower, brinjal, and ladyfinger across seedling, flowering, and harvesting stages. View evidence ↗
What they did
- A pot culture experiment was conducted from August to December 2023 using four phosphorus levels (0.0, 0.5, 1.0, and 1.50 gm P2O5 per 35 cm pot) using P32 tagged super phosphate. View evidence ↗
- The experiment used dark clay soil from Moradabad District, U.P., India, with uniform recommended doses of Nitrogen (N) and Potassium (K) applied. View evidence ↗
- The P32 tagged superphosphate used in the study had a specific activity of 0.40 mCi/gm P2O5 and was sourced from the Narora Power Station (NAPS). View evidence ↗
What they found
- Total phosphorus uptake increased significantly as phosphorus levels rose across all growth stages; for example, at the 1.50 gm P2O5 level, harvesting stage uptake reached 89.81 mg/pot for cauliflower and 95.52 mg/pot for ladyfinger. View evidence ↗
- The percentage of phosphorus derived from fertilizers increased significantly with higher P levels, reaching up to 64.70% for brinjal at the harvesting stage with 1.50 gm P2O5. View evidence ↗
- Phosphorus utilization efficiency decreased as the dose increased; for instance, ladyfinger utilization at the harvesting stage dropped from 29.65% at the 0.05 gm dose to 22.98% at the 1.50 gm dose. View evidence ↗
- Increasing the phosphorus dose also led to higher phosphorus uptake from soil sources, with harvesting stage values reaching 66.22 mg/pot for brinjal at the 1.50 gm dose. View evidence ↗
What it means
- The authors conclude that the radioactive phosphorus level of 0.40 mCi/gm found in plant waste does not have harmful effects on vegetable crops grown in contaminated soil. View evidence ↗
Visual summary
3 visualsIllustrations explain the paper; charts are replotted from the paper's own table values.
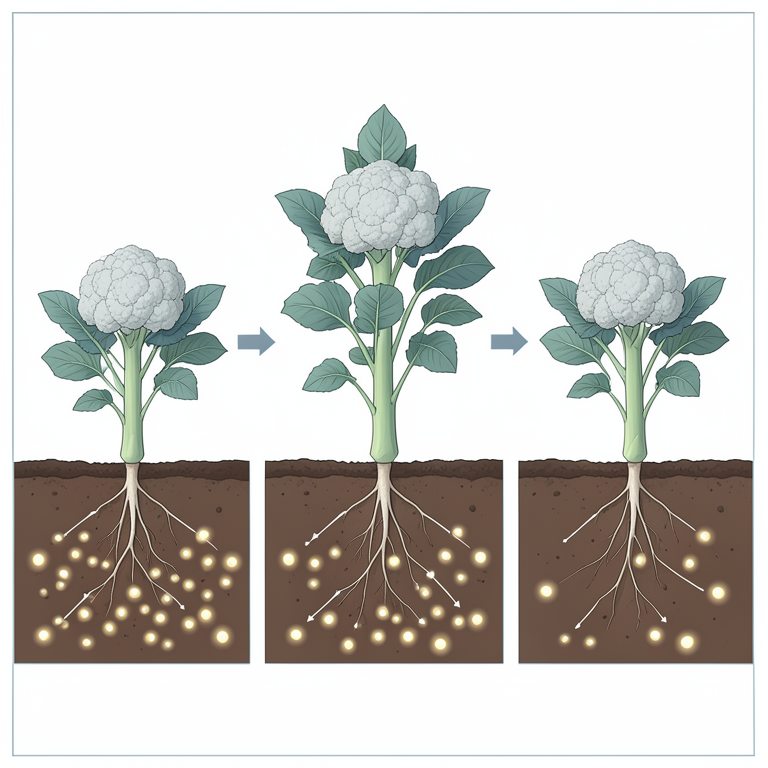
Phosphorus Dose Response
AI-generated conceptual illustration (cauliflower and ladyfinger plants in soil). It explains the idea and does not show study data.
View source evidence ↗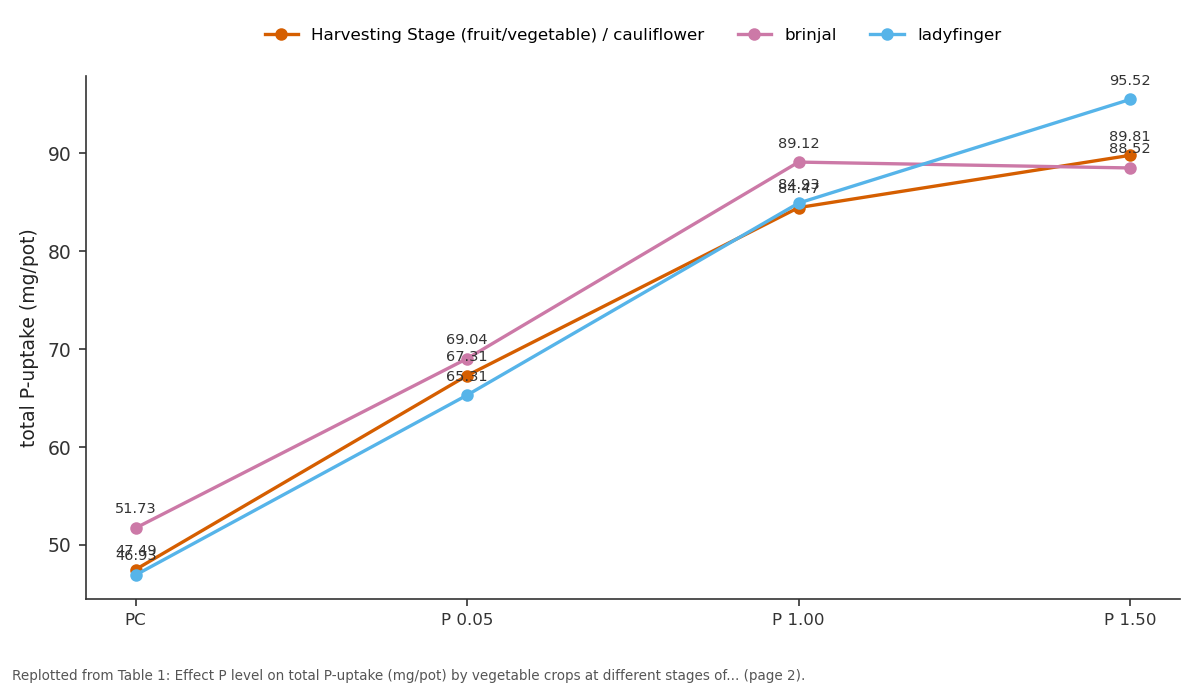
Harvesting Stage (fruit/vegetable) /... and brinjal and more: PC vs P 0.05 vs P 1.00 vs P 1.50
Replotted from Table 1 (page 2) of the original paper. Every bar is the paper's own table value.
View source evidence ↗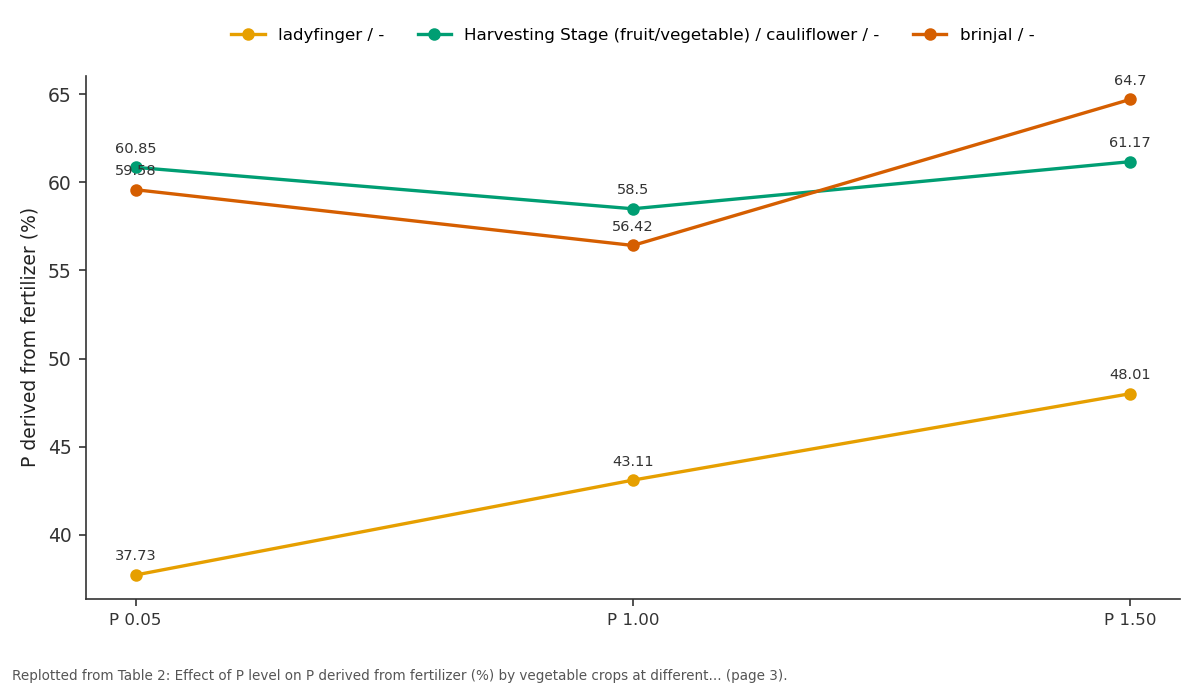
ladyfinger / - and Harvesting Stage (fruit/vegetable) /... and more: P 0.05 vs P 1.00 vs P 1.50
Replotted from Table 2 (page 3) of the original paper. Every bar is the paper's own table value.
View source evidence ↗Figures & tables
From the original paper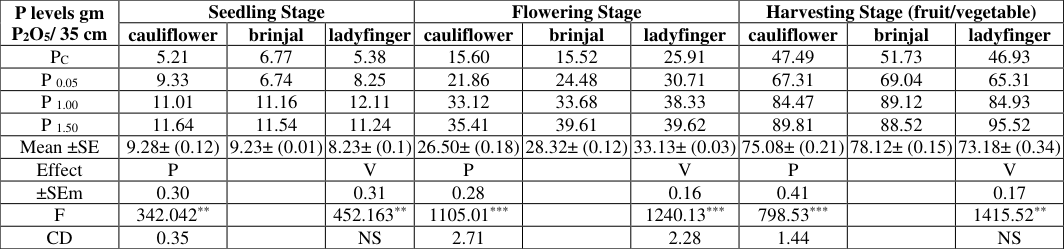 Table 1
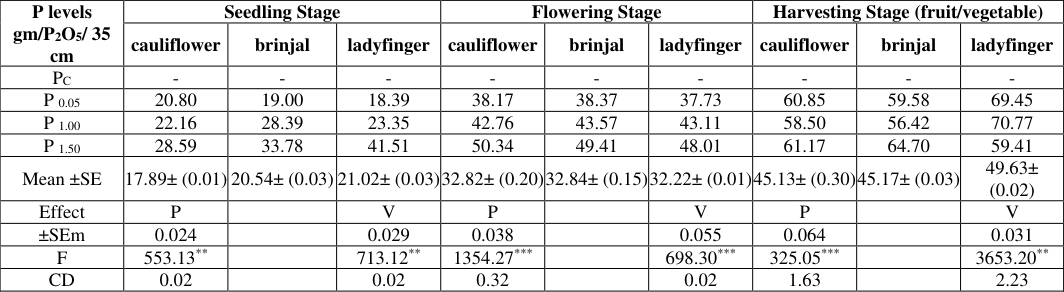 Table 2
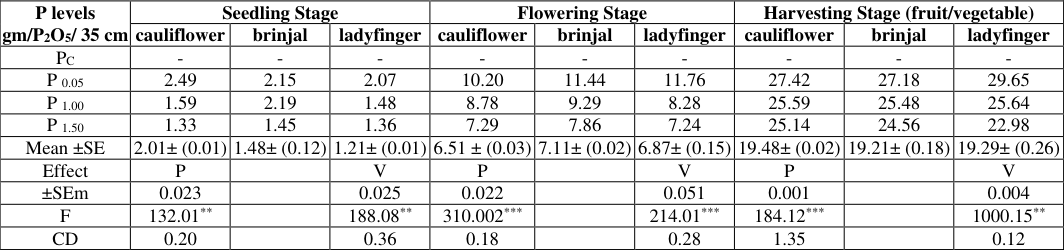 Table 3
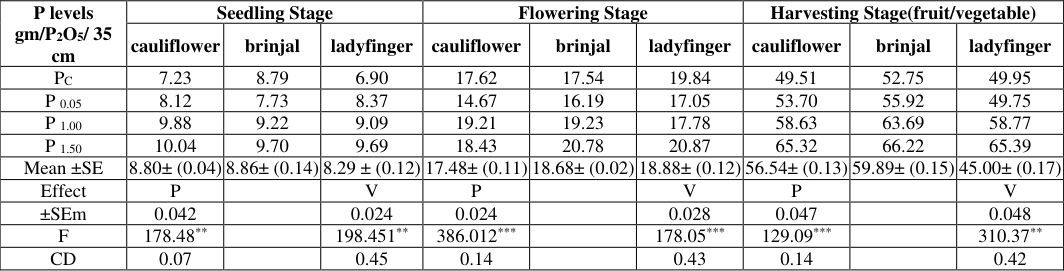 Table 4
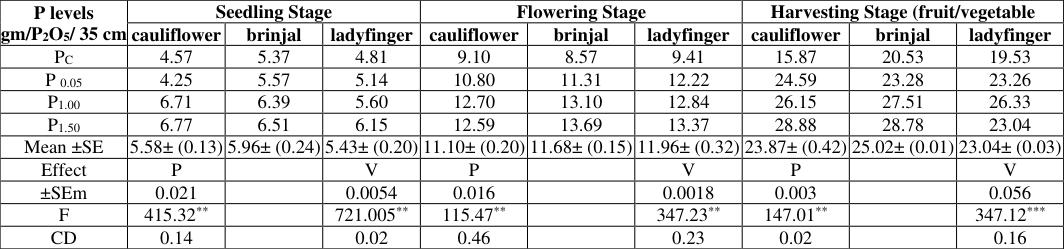 Table 5
Introduction
Based on an analysis of the radio-logical data of 2000-2020 from nuclear power plants in India, BARC Mumbai have found the radioactive discharges from the NAPC and the result potential environment have been minimal. But a large number of nuclear atomic plant disposed off their waste in a natural water and soil due to which nutritional imbalance is created in both as well. Most of the units are taking appropriate measurement to prevent these contamination, but perhaps are not completely sufficient. Clay rich soil absorbs large quantities of water after rainfall becoming sticky and heavy, conversely it can also become very hard when dry resulting in shrinking and cracking of the ground. Fertilizers (NPK) are the essential macro nutrients for vegetable crops growth, nitrogen absorbs as NO 3 -/NH 4 + , potassium-K + ion and phosphorus-H 2 PO 4 -/HPO 4 --through their roots interception and presence of beneficial fungi. When NPK fertilizers are apply to the soil N, K absorbed easily but the difficulty with phosphatic fertilizers is that a large functions of it's fixed (75-80%) in the soil and only small portion (15-20%) is available to the plant. In the present manuscript study was to investigate the comparative and combine effect of phosphorus on utilization with different vegetable crops viz., cauliflower, brinjal and ladyfinger at various stage of growth parameters (viz., seedling, flowering, harvesting (fruit/vegetable) stages in a soil with their respective controls.
Experimental
The period of study for NAPC plant is from august 2023-december 2023 and pot culture experiment was conducted in the department of chemistry, Hindu College, Moradabad with the vegetable crops viz., cauliflower, brinjal and ladyfinger and four levels of phosphorus viz., 0.0, 0.5, 1.0, 1.50 gmP 2 O 5 /35 cm (pot), respectively. Soil sample were collected from experimental area and filled with 5.0 Kg soil capacity of 35cm radius of earthen pots. The soil contained 0.5% organic carbon and 3.0 gm/pot (35 cm), 10% and 5.125 gm/Pot (35 cm) available N, P and K 2 O, respectively. The pH of soil was 7.2. A basal application of 20% N and 25% K 2 O was applied at the time of sowing. Urea, single superphosphate and muriate of potash was used as the source of N, P, and K, respectively. Three vegetable crops viz., The sample were collected and measured for radius of 15 km of the NAPC Plant the concentration of the fission products beyond 5 km radius was below the minimum detectable activity of the instrument used. The radioactive phosphorus [1] and total-P were determined [2,3] in plant and P 32 counting for soil was done under identical condition in GM Counter. All growth parameters of the vegetable crops viz., cauliflower, brinjal and ladyfinger were statistically analyzed [4] .
Results and Discussion
Data presented in table-1 reveals that the total phosphorus uptake increased significantly with increasing level of phosphorus at all the stages of growth in vegetable crops with their respective controls also shown in the form of graphic in fig.
A. This might be due to the higher availability of phosphorus with increasing phosphorus level [5, 6] . It is evident from table-3 that the% utilization of P decreased significantly with increasing levels of P at all the stages of growth parameters in all varieties, which means that the utilization of added P was not in proportion to applied P level, also shown diagrammatically in fig. C. On the other hand with lower dose the available amount of P was less than the need of the crops for its growths as a result of which the efficiency of utilization of applied fertilizer P is higher at low dose and low at higher dose [7,8,9] Data presented in table-4 reveals that as the dose of P increased, the uptake of P from soil sources also increased at all the growth stages. This might be due to the proportionately higher uptake of P with increased dry matter yield of vegetable crops as well as better root system development caused by P application which enabled the plant to exploit the P from soil 9 to a greater extent also shown in fig. D. E reveal that the dry matter yield of vegetable crops increased at all the stages of growth parameter in vegetable crops with increasing level of P with their respective controls [9,10] . This increasing yield was due to the response of P over control indicating that the soil was not in a position to supply enough P as required by the vegetable crops and as soon as the P deficiency was made up, increased yield was obtained [11] . Finally we have come to the conclusion that 0.40 mCi/gm this amount of radioactive phosphorus obtained from the analysis of plant waste materials does not have any deleterious effect on plants and ecological environment as well, while positive results are being obtained from the above fact that application of increasing doses of phosphorus fertilizer brings about increased uptake of P in all the vegetable crops, increased dry matter yield and increased uptake of P from soil sources. The phosphorus derived from fertilizer also increase but percentage utilization of applied P decrease indicating thereby that the efficiency of P utilization is more lower level of fertilization then at higher doses.
Conclusion
Above research findings conclude that amount of radiation P 32 obtained from analysis of plant waste material which was 0.40 mCi/gm, does not have any deleterious effect on the vegetable crops growing in the P 32 accumulated soil. There is a possibility of saving of Phosphorus fertilizer from above recommended doses. Moreover radioisotopes exposure can improve the quality and productivity for agriculture products with insects, pesticides and disease management and drought resistance etc. and can be used as research tools to develop new agriculture strains.
Acknowledgement
AcknowledgementThe author is thankful to Principal Hindu College, Moradabad for his keen interest in the work and constant encouragement and Head Dept. of Chemistry for providing necessary lab facilities. I am delighted and grateful to generous help behavior of members of NAPS unit and people of villages live near the unit who helped in collecting the waste material of the unit.
Figures and tables from the paper
| P levels gm P2O5/ 35 cm | Seedling Stage | — | — | Flowering Stage | — | — | Harvesting Stage (fruit/vegetable) | — | — |
|---|---|---|---|---|---|---|---|---|---|
| cauliflower | brinjal | ladyfinger | cauliflower | brinjal | ladyfinger | cauliflower | brinjal | ladyfinger | |
| PC | 5.21 | 6.77 | 5.38 | 15.60 | 15.52 | 25.91 | 47.49 | 51.73 | 46.93 |
| P 0.05 | 9.33 | 6.74 | 8.25 | 21.86 | 24.48 | 30.71 | 67.31 | 69.04 | 65.31 |
| P 1.00 | 11.01 | 11.16 | 12.11 | 33.12 | 33.68 | 38.33 | 84.47 | 89.12 | 84.93 |
| P 1.50 | 11.64 | 11.54 | 11.24 | 35.41 | 39.61 | 39.62 | 89.81 | 88.52 | 95.52 |
| Mean ±SE | 9.28± (0.12) | 9.23± (0.01) | 8.23± (0.1) | 26.50± (0.18) | 28.32± (0.12) | 33.13± (0.03) | 75.08± (0.21) | 78.12± (0.15) | 73.18± (0.34) |
| Effect | P | V | P | V | P | V | |||
| ±SEm | 0.30 | 0.31 | 0.28 | 0.16 | 0.41 | 0.17 | |||
| F | 342.042** | 452.163** | 1105.01*** | 1240.13*** | 798.53*** | 1415.52** | |||
| CD | 0.35 | NS | 2.71 | 2.28 | 1.44 | NS |
Table text extracted from the original PDF; superscript letters are shown inline. The original table image is below.
View original table image
| P levels gm/P2O5/ 35 cm | Seedling Stage | — | — | Flowering Stage | — | — | Harvesting Stage (fruit/vegetable) | — | — |
|---|---|---|---|---|---|---|---|---|---|
| cauliflower | brinjal | ladyfinger | cauliflower | brinjal | ladyfinger | cauliflower | brinjal | ladyfinger | |
| PC | - | - | - | - | - | - | - | - | - |
| P 0.05 | 20.80 | 19.00 | 18.39 | 38.17 | 38.37 | 37.73 | 60.85 | 59.58 | 69.45 |
| P 1.00 | 22.16 | 28.39 | 23.35 | 42.76 | 43.57 | 43.11 | 58.50 | 56.42 | 70.77 |
| P 1.50 | 28.59 | 33.78 | 41.51 | 50.34 | 49.41 | 48.01 | 61.17 | 64.70 | 59.41 |
| Mean ±SE | 17.89± (0.01) | 20.54± (0.03) | 21.02± (0.03) | 32.82± (0.20) | 32.84± (0.15) | 32.22± (0.01) | 45.13± (0.30) | 45.17± (0.03) | 49.63± (0.02) |
| Effect | P | V | P | V | P | V | |||
| ±SEm | 0.024 | 0.029 | 0.038 | 0.055 | 0.064 | 0.031 | |||
| F | 553.13** | 713.12** | 1354.27*** | 698.30*** | 325.05*** | 3653.20** | |||
| CD | 0.02 | 0.02 | 0.32 | 0.02 | 1.63 | 2.23 |
Table text extracted from the original PDF; superscript letters are shown inline. The original table image is below.
View original table image
| P levels gm/P2O5/ 35 cm | Seedling Stage | — | — | Flowering Stage | — | — | Harvesting Stage (fruit/vegetable) | — | — |
|---|---|---|---|---|---|---|---|---|---|
| cauliflower | brinjal | ladyfinger | cauliflower | brinjal | ladyfinger | cauliflower | brinjal | ladyfinger | |
| PC | - | - | - | - | - | - | - | - | - |
| P 0.05 | 2.49 | 2.15 | 2.07 | 10.20 | 11.44 | 11.76 | 27.42 | 27.18 | 29.65 |
| P 1.00 | 1.59 | 2.19 | 1.48 | 8.78 | 9.29 | 8.28 | 25.59 | 25.48 | 25.64 |
| P 1.50 | 1.33 | 1.45 | 1.36 | 7.29 | 7.86 | 7.24 | 25.14 | 24.56 | 22.98 |
| Mean ±SE | 2.01± (0.01) | 1.48± (0.12) | 1.21± (0.01) | 6.51 ± (0.03) | 7.11± (0.02) | 6.87± (0.15) | 19.48± (0.02) | 19.21± (0.18) | 19.29± (0.26) |
| Effect | P | V | P | V | P | V | |||
| ±SEm | 0.023 | 0.025 | 0.022 | 0.051 | 0.001 | 0.004 | |||
| F | 132.01** | 188.08** | 310.002*** | 214.01*** | 184.12*** | 1000.15** | |||
| CD | 0.20 | 0.36 | 0.18 | 0.28 | 1.35 | 0.12 |
Table text extracted from the original PDF; superscript letters are shown inline. The original table image is below.
View original table image
| P levels gm/P2O5/ 35 cm | Seedling Stage | — | — | Flowering Stage | — | — | Harvesting Stage(fruit/vegetable) | — | — |
|---|---|---|---|---|---|---|---|---|---|
| cauliflower | brinjal | ladyfinger | cauliflower | brinjal | ladyfinger | cauliflower | brinjal | ladyfinger | |
| PC | 7.23 | 8.79 | 6.90 | 17.62 | 17.54 | 19.84 | 49.51 | 52.75 | 49.95 |
| P 0.05 | 8.12 | 7.73 | 8.37 | 14.67 | 16.19 | 17.05 | 53.70 | 55.92 | 49.75 |
| P 1.00 | 9.88 | 9.22 | 9.09 | 19.21 | 19.23 | 17.78 | 58.63 | 63.69 | 58.77 |
| P 1.50 | 10.04 | 9.70 | 9.69 | 18.43 | 20.78 | 20.87 | 65.32 | 66.22 | 65.39 |
| Mean ±SE | 8.80± (0.04) | 8.86± (0.14) | 8.29 ± (0.12) | 17.48± (0.11) | 18.68± (0.02) | 18.88± (0.12) | 56.54± (0.13) | 59.89± (0.15) | 45.00± (0.17) |
| Effect | P | V | P | V | P | V | |||
| ±SEm | 0.042 | 0.024 | 0.024 | 0.028 | 0.047 | 0.048 | |||
| F | 178.48** | 198.451** | 386.012*** | 178.05*** | 129.09*** | 310.37** | |||
| CD | 0.07 | 0.45 | 0.14 | 0.43 | 0.14 | 0.42 |
Table text extracted from the original PDF; superscript letters are shown inline. The original table image is below.
View original table image
| P levels gm/P2O5/ 35 cm | Seedling Stage | — | — | Flowering Stage | — | — | Harvesting Stage (fruit/vegetable | — | — |
|---|---|---|---|---|---|---|---|---|---|
| cauliflower | brinjal | ladyfinger | cauliflower | brinjal | ladyfinger | cauliflower | brinjal | ladyfinger | |
| PC | 4.57 | 5.37 | 4.81 | 9.10 | 8.57 | 9.41 | 15.87 | 20.53 | 19.53 |
| P 0.05 | 4.25 | 5.57 | 5.14 | 10.80 | 11.31 | 12.22 | 24.59 | 23.28 | 23.26 |
| P1.00 | 6.71 | 6.39 | 5.60 | 12.70 | 13.10 | 12.84 | 26.15 | 27.51 | 26.33 |
| P1.50 | 6.77 | 6.51 | 6.15 | 12.59 | 13.69 | 13.37 | 28.88 | 28.78 | 23.04 |
| Mean ±SE | 5.58± (0.13) | 5.96± (0.24) | 5.43± (0.20) | 11.10± (0.20) | 11.68± (0.15) | 11.96± (0.32) | 23.87± (0.42) | 25.02± (0.01) | 23.04± (0.03) |
| Effect | P | V | P | V | P | V | |||
| ±SEm | 0.021 | 0.0054 | 0.016 | 0.0018 | 0.003 | 0.056 | |||
| F | 415.32** | 721.005** | 115.47** | 347.23** | 147.01** | 347.12*** | |||
| CD | 0.14 | 0.02 | 0.46 | 0.23 | 0.02 | 0.16 |
Table text extracted from the original PDF; superscript letters are shown inline. The original table image is below.
View original table image
References
11 in the original paper- Kotur SC, Ramesh PR, Anjanegulu K, Ramachandran V. Assessment of fertilizer use efficiency under enhanced crop intensity of vegetables due to intercropping using ¹⁵N & ³²P labeled fertilizers. Ind J Agricl Sci. 2010;80:325-326.
- Singh D, Chhonkar PK, Dwivedi BS. Manuals of soil, plant and water analysis. New Delhi: Westville Publishing House; 2005.
- American Public Health Association (APHA). Standard methods for the examination of water and wastewater. 15th ed. Washington DC: APHA; 1980.
- Snedecor GW, Cochran WG. Statistical methods. New Delhi: Oxford and IBH; 2000.
- Kotur SC. Isotopes-aided research in fruits and vegetable crops. J Hortl Sci. 2012;7(2):119-133.
- Bayrak G, Keles E, Atik D. Estimation of radioactivity caused by chemical fertilizers on Trakya sub-region soil and its potential risk on ecosystem. Europ J Sustainable Development. 2018;7(3):413-424.
- Shivananda TN, Iyengar BRV. Effect of placement of utilization of fertilizer P by brinjal (Solanum esculentum Mill.). J Agricl Biol. 1993;22:94-99.
- Punniyakott J, Lakshmi KS, Meenakshisundara V, Manju N, Poonguzhali P. Influence of fertilizers on the natural radioactivity profile of soil samples of agriculture land in Villupuram District, Tamil Nadu State, India. J Radiat Nucl Chem. 2020;325:85-92.
- Sivani SS, Reddy MD, Theerthala A, Padmaja B. Effect of dose and time of application of P on changes in P uptake pattern and yield growth on P accumulated soil. Chem Int. 2018;12(4):960-965.
- Siyal AL, Hossain A, Siyal FK, Jatt T, Iram S. Use of radioisotopes to produce high yielding crops in order to increase agriculture production. Chem Pro. 2022;10(1):86-90.
- Hegazi A, Salma MA, Kassab MF, Abdou NY. Natural radioactivity levels in some vegetable crops under greenhouse condition. Appl Radiat Isot. 2023;197:110833.