
Research article · 2025 · Full text
International Journal of Agriculture and Food ScienceEstimation of some active compounds in functional cardamom drink produced using probiotics
Volume 7(5) · Pages 360–363 · DOI: 10.33545/2664844x.2025.v7.i5f.425 ↗
Research areasIndigenous Knowledge Systems and Agriculture
Abstract
Author-writtenThe study was conducted in the laboratories of the Department of Food Sciences / College of Agriculture / Tikrit University, for the purpose of producing a natural cinnamon drink enhanced with a bio-bio-active substance using a mixture of probiotic bacteria including Lactobacillus rhamnosus, Lactobacillus acidophilus, Lactobacillus casei and Bifidobacterium. The study included fermenting the product for four weeks T2, T3, T4 and T5, respectively. then cooling at a temperature of 5°C and comparing it with the control drink T1, and conducting several periodic tests weekly of storage in addition to sensory tests to determine the quality and keeping `quality of the product, the results showed a gradual decrease in the concentration of total soluble solids (TSS) of the cardamom drink during the fermentation weeks due to the consumption of microorganisms of the components of the produced drink, especially simple carbohydrates. The increase in the percentage of total acidity in the functional product is due to the bacteria producing organic acids, by lactic acid bacteria. The results showed a gradual increase in the values of all active compounds, including total phenols and flavonoids, in addition to vitamins. Sensory tests were conducted on the product, including taste, color, smell, texture, and general acceptance, the results were acceptable after four weeks of fermentation.
Summary
Source-checkedPlain-language reading of the full paper, prepared with AI and checked against the text. Each point links to the authors' own words.
Why it matters
- Cardamom is considered one of the most valuable and expensive spices globally, often referred to as the 'king of spices'. View evidence ↗
- Natural cardamom drinks are rich in aromatic compounds, flavonoids, and vitamins, specifically vitamin C and the B group. View evidence ↗
- There is a growing trend toward using natural functional foods as alternatives to medical drugs to avoid negative side effects and prevent diseases. View evidence ↗
The question
- The study aimed to create a bio-enhanced therapeutic cardamom drink and evaluate its biochemical properties and shelf life during fermentation. View evidence ↗
What they did
- The drink was prepared by adding 10g of cardamom powder to 1 liter of sterilized water, with sucrose added to reach a total soluble solids (TSS) concentration of 12%. View evidence ↗
- Sensory evaluations were performed by 20 graduate students immediately after production and after four weeks of refrigerated storage. View evidence ↗
What they found
- Total acidity increased from 0.35±0.05% in the control (T1) to 0.95±0.05% after four weeks of fermentation (T5), while TSS decreased from 12.00±0.00% to 9.75±0.00%. View evidence ↗
- Sensory scores declined slightly by week four (T5) compared to control (T1), with taste and smell dropping from 9.00±0.00 to 7.00±0.00. View evidence ↗
What it means
- The authors conclude that the functional cardamom drink remained acceptable in terms of sensory quality after four weeks of fermentation. View evidence ↗
Visual summary
3 visualsIllustrations explain the paper; charts are replotted from the paper's own table values.
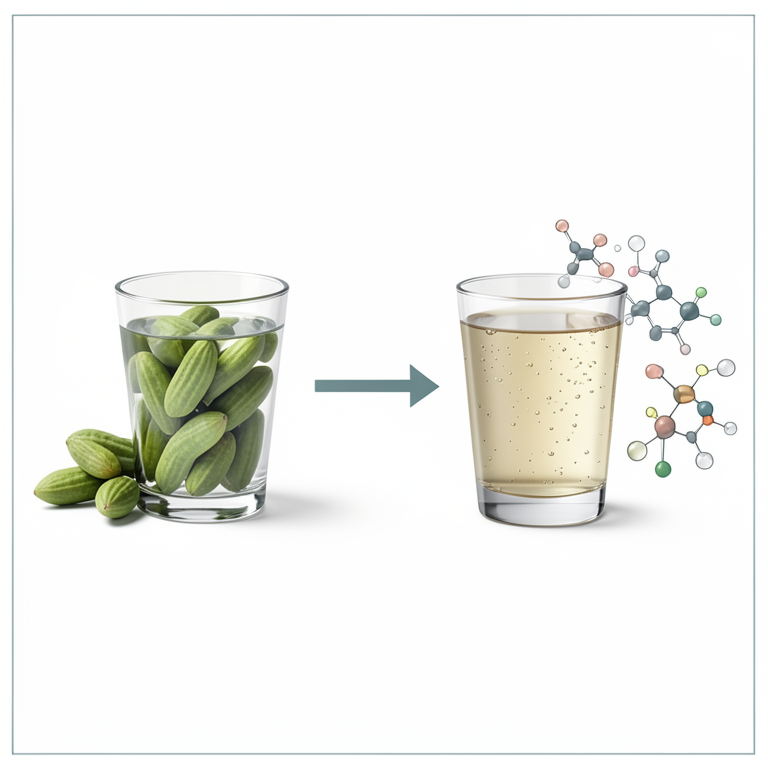
Effect of Probiotic Fermentation on Cardamom Drink
AI-generated conceptual illustration (cardamom pods and a fermented cardamom beverage). It explains the idea and does not show study data.
View source evidence ↗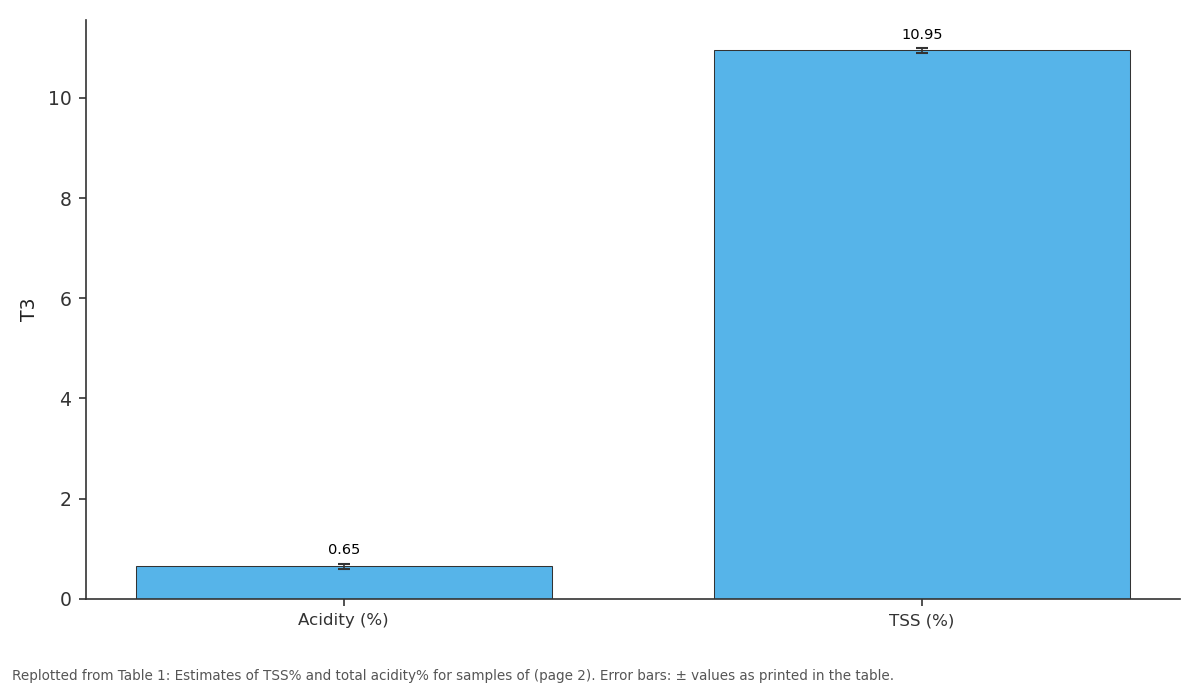
T3: Acidity (%) vs TSS (%)
Replotted from Table 1 (page 2) of the original paper. Every bar is the paper's own table value.
View source evidence ↗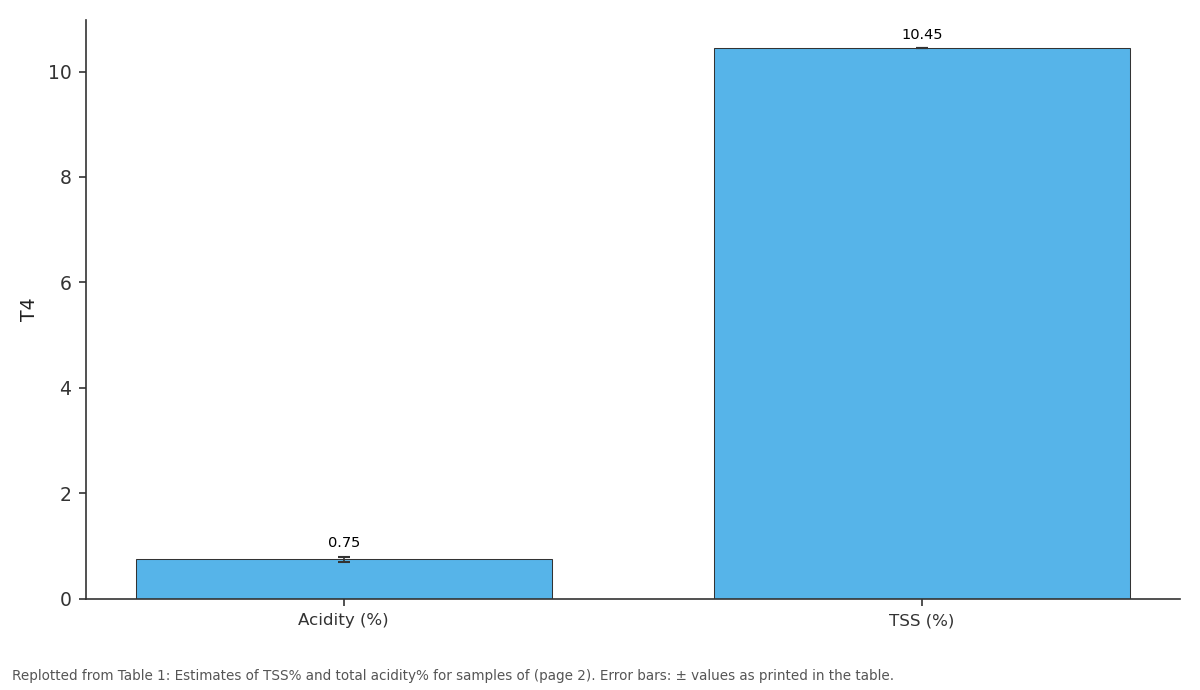
T4: Acidity (%) vs TSS (%)
Replotted from Table 1 (page 2) of the original paper. Every bar is the paper's own table value.
View source evidence ↗Figures & tables
From the original paper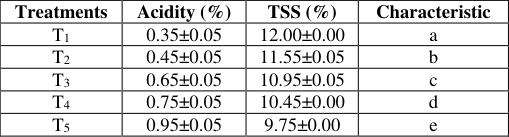 Table 1
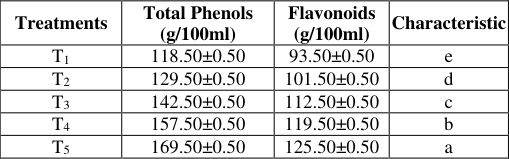 Table 2
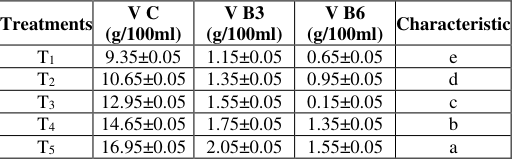 Table 3
 Table 4
Introduction
Cardamom (Elettaria cardamomum) is called the emperor or the king of spices [1] , as it is one of the most expensive and valuable spices in the world [2] . It is a perennial plant with thick, fleshy root stems with underground buds and fibrous roots. It is a monocotyledonous plant belonging to the ginger family [3] . Known to Arabs as cardamom. Cardamom contains large leaves that vary in color between white, light green, brown, and yellow. The part used is the seeds inside the fruit. It usually grows in the shade under forest trees and in high, humid places at a temperature ranging between 20-25°C, as it grows in warm tropical forests. The countries that produce it in large quantities are India, Sri Lanka, and Guatemala [4] , Cardamom contains volatile compounds that are responsible for its distinctive aroma, and it has many medicinal benefits, as it is an appetite stimulant and is used to improve the flavor of medicines and perfumes. Natural cardamom drink contains many effective aromatic compounds such as cineole, limonene, alpha-pinene, terpenes, and flavonoids such as quercetin and cambiferol, as well as vitamins, the most important of which are vitamin C and the vitamin B group [5] . In addition to containing antioxidants, antibacterials and antimicrobial compounds such as staphylococci present in the mouth, which can cause tooth decay, gum and throat infections, it has therapeutic properties for heart disease, high blood pressure and digestive problems [6] . It is used as a pain reliever, gas expeller, aids digestion, prevents nausea and vomiting and strengthens the stomach [7] . With the increase in health awareness and the avoidance of medical drugs as much as possible due to their negative side effects, reliance has begun on functional foods produced from natural sources and their use as alternative treatments for many diseases and their prevention. Many benefits of these foods, especially fermented functional beverages, have emerged. Recent years witnessed significant progress in this field, especially after it was confirmed that these food products have the ability to treat and prevent many diseases [8] .
Many functional products have been developed and produced that fall within the field of fermented beverages, and to increase consumer demand for these healthy foods [9] . Due to importance of this product to health and nutritional perspective, and the lack of studies on this topic, the study aimed to produce a bio-enhanced therapeutic cardamom drink, study some of its biochemical properties [10] , following it during the fermentation stages, and determine its shelf life.
Materials and Methods
Production of natural bio-enhanced cardamom drink: Cardamom seeds were used, from the local markets of Tikrit city, cleaned from dust and suspended matter and ground using a GOSONIC grinder. 10g of cardamom powder was taken and added to 1 liter of filtered and sterilized water with specific specifications. The mixture was then left for 24 hours at a temperature of 25°C, then filtered and the total soluble solids concentration of the product was adjusted by adding sucrose according to the Iraqi standard specifications to 12%. Then it was filled into previously sterilized, hermetically sealed glass bottles and pasteurized at 80°C for 20 seconds, then quickly cooled, and kept refrigerated at 5°C, then inoculated with a mixture of (L. rhamnosus, L. acidophilus, L casei) and Bifidobacterium at a concentration of 1.5*108 cells/ml according to McFarland test under controlled sterile conditions, then the products were kept in the refrigerator until the study was conducted. Total acidity test: Total acidity was estimated by titration against the base NaOH and phenonphthalene indicator, as shown by [11] . Total soluble solids test: Total soluble solids (TSS)
were estimated using a Hand Refractometer as stated in [12] . Total phenols test: Total phenols were determined using Follen's reagent using a UV-ViS Spectrophotometer as stated in [13] . Flavonoids test: Flavonoids were determined by dissolving the sample in ethanol, using a UV-ViS Spectrophotometer as reported in [14] Vitamin Test: Vitamins (C, B6, B12) were determined using HPLC technique according to the report of [11] . Sensory tests: The sensory evaluation was conducted immediately after the production process, and then after storage in the refrigerator for 4 weeks by 20 evaluators from graduate students at the College of Agriculture/Tikrit University, where the degrees of attributes were evaluated according to what was mentioned in [15] , and the evaluation form was used to monitor the degrees of color, smell, taste, body, and overall acceptance, where the evaluation degrees ranged between 9-1. Statistical analysis: The experiment was conducted according to the CRD design to determine the significant differences between the treatments at the probability level (0.05) using the statistical program Minitab version (2010).
Results and Discussion
Chemical tests T 1 : Represents the control sample (free of probiotic bacteria), T 2 : The first week of probiotic fermentation, T 3 : the second week of probiotic fermentation, T 4 : the third week of probiotic fermentation, T 5 : the fourth week of probiotic fermentation. Table 1 shows the values of total soluble solids (TSS). The results of the statistical analysis of the data show that there are significant differences between the value of treatment T 1 and treatments T 3 , T 4 and T 5 , between the value of treatment T 2 and treatments T 3 , T 4 and T 5 , between treatment T 3 and treatment T 5 , and between the values of treatment T 4 and treatment T 5 . While no significant differences were observed between the values of T 1 and T 2 and the values of T 3 and T 4 , the same table shows significant differences in the acidity characteristic between the value of treatment T 1 and the values of T 3 , T 4 and T 5 , between the value of treatment T 2 and the values of T 3 , T 4 and T 5 , between the value of treatment T 3 and the value of T 5 , and between the values of T 4 and T 5 .
| Treatments | Acidity (%) | TSS (%) | Characteristic |
|---|---|---|---|
| T1 | 0.35±0.05 | 12.00±0.00 | a |
| T2 | 0.45±0.05 | 11.55±0.05 | b |
| T3 | 0.65±0.05 | 10.95±0.05 | c |
| T4 | 0.75±0.05 | 10.45±0.00 | d |
| T5 | 0.95±0.05 | 9.75±0.00 | e |
Table text extracted from the original PDF; superscript letters are shown inline. The original table image is below.
View original table image
The results of the study show a significant increase in the percentages of total acidity values during the fermentation weeks, as a result of the consumption of the probiotics used in the fermentation process of the simple sugars present in the functional drink and thus the production of lactic acid [16] . The results of the study also showed a gradual decrease in the percentages of total soluble solids (TSS) values during the fermentation weeks. This is due to the consumption of simple components represented by carbohydrates by the probiotics for the purpose of growth and reproduction, as simple sugars are the basic material for the growth and reproduction of these microbes and for the purpose of carrying out the fermentation process [17] . Fermentation is a desirable change due to the microbial activity of the microorganisms used in the production process, thus improving food digestion in the digestive system and increasing nutrient absorption, as its enzymes work to digest food components and improve the metabolism and absorption of nutrients within the human digestive system [18] . T 1 : Represents the control sample (free of probiotic bacteria), T 2 : The first week of probiotic fermentation, T 3 :
The second week of probiotic fermentation, T 4 : The third week of probiotic fermentation, T 5 : the fourth week of probiotic fermentation. Table 2 shows the values of flavonoids and total phenolic compounds. The results of the statistical analysis show that there are significant differences between the sum of the values of these characteristics during the fermentation weeks. It is noted that there are significant differences between the value of treatment T 1 and treatments T 2 , T 3 , T 4 and T 5 , and between the value of treatment T 2 and treatments T 3 , T 4 and T 5 , and between the value of treatment T 3 and treatments T 4 and T 5 , and between the values of treatments T 4 and T 5 . The results of the study show a gradual increase in the concentrations of total phenolic compounds and flavonoids in the functional beverage models compared to the standard beverages during the fermentation weeks. The reason for the increase in the concentrations of these components is due to the activity of the probiotics used in the production process and their metabolic activity during the fermentation and bio production process [19] . It has the ability to oxidize the components of the fermentation medium and produce complex components such as pigments, antioxidants and other vital compounds, and this technology is effective in increasing the concentrations of these compounds [16] . T 1 : Represents the control sample (free of probiotic bacteria), T 2 : The first week of probiotic fermentation, T 3 :
| Treatments | Total Phenols (g/100ml) | Flavonoids (g/100ml) | Characteristic |
|---|---|---|---|
| T1 | 118.50±0.50 | 93.50±0.50 | e |
| T2 | 129.50±0.50 | 101.50±0.50 | d |
| T3 | 142.50±0.50 | 112.50±0.50 | c |
| T4 | 157.50±0.50 | 119.50±0.50 | b |
| T5 | 169.50±0.50 | 125.50±0.50 | a |
Table text extracted from the original PDF; superscript letters are shown inline. The original table image is below.
View original table image
The second week of probiotic fermentation, T 4 : the third week of probiotic fermentation, T 5 : the fourth week of probiotic fermentation. Table (3) shows the values of vitamins C, B3 and B6. The results of the statistical analysis show that there are significant differences between the sum of the values of these vitamins during the fermentation weeks. It is noted that there are significant differences between the value of treatment T 1 and treatments T 2 , T 3 , T 4 and T 5 , and between the value of treatment T 2 and treatments T 3 , T 4 and T 5 , and between the value of treatment T 3 and treatments T 4 and T 5 , and between the values of treatments T 4 and T 5 for all vitamins. The results of the study show a gradual increase in vitamin concentrations during the fermentation weeks compared to standard beverages, as probiotic bacteria have a high potential to consume the components of the fermentation medium and produce many vital products such as vitamins and flavor compounds [20] . Probiotic bacteria have important effects during the fermentation process [16] , and this was confirmed by [21] regarding the possibility of these probiotics to improve the vitamin content of fermented products, especially B-complex. T 1 : Represents the control sample (free of probiotic bacteria), T 2 : The first week of probiotic fermentation, T 3 :
The second week of probiotic fermentation, T 4 : the third week of probiotic fermentation, T 5 : the fourth week of probiotic fermentation. Table 4 shows the results of the sensory tests for the functional cardamom drink model. The results of the statistical analysis of the data show that there are significant differences in the taste and smell characteristics between the value of treatment T 1 and treatments T 3 , T 4 and T 5 , and between the value of treatment T 2 and treatments T 3 , T 4 and T 5 , and between treatment T 3 and treatment T 5 , and between the values of treatment T 4 and treatment T 5 , while no significant differences were observed between the values of T 1 and T 2 and the values of T 3 and T 4 . Regarding the color characteristic, the results of the statistical analysis showed that there were significant differences between the value of treatment T 1 and treatment T 5 , between the value of treatment T 2 and treatment T 5 , between the value of treatment T 3 and treatment T 5 , and between the value of treatment T 4 and treatment T 5 , while no significant differences were observed between the values of treatments T 1 , T 2 , T 3 , and T 4 . With regard to the texture characteristic, the results showed significant differences between the value of treatment T 1 and treatments T 4 and T 5 , between the value of treatment T 2 and treatments T 4 and T 5 , and between the value of treatment T 3 and treatments T 4 and T 5 , while no significant differences were observed between the values of treatments T 1 , T 2 , and T 3 and treatments T 4 and T 5 . As for the general acceptance characteristic, the results show significant differences between the value of treatment T 1 and treatments T 3 , T 4 and T 5 , and between the value of treatment T 2 and treatments T 3 , T 4 and T 5 , while no significant differences were observed between the values of treatments T 1 and T 2 and treatments T 3 , T 4 and T 5 . The results of the study showed a slight decline in the sensory evaluation results in the functional beverage models produced, as a result of the increase in acidity first and the production of other compounds that participate in giving the flavor to the product, as confirmed by [19] . On the possibility of probiotics to ferment food and maintain the health and nutritional qualities of the product for four weeks with a slight decline in the sensory evaluation results, as a group of volatile compounds is produced that contribute to the production of a mixture of flavors that make the fermented food less acceptable when the storage period increases [22] .
| Treatments | Taste | Color | Smell | Consistency | General Admission | Characteristic |
|---|---|---|---|---|---|---|
| T1 | 9.00±0.00 | 9.00±0.00 | 9.00±0.00 | 9.00±0.00 | 9.00±0.00 | a |
| T2 | 9.00±0.00 | 9.00±0.00 | 9.00±0.00 | 9.00±0.00 | 9.00±0.00 | a |
| T3 | 8.00±0.00 | 9.00±0.00 | 8.00±0.00 | 9.00±0.00 | 8.00±0.00 | b |
| T4 | 8.00±0.00 | 9.00±0.00 | 8.00±0.00 | 8.00±0.00 | 8.00±0.00 | b |
| T5 | 7.00±0.00 | 8.00±0.00 | 7.00±0.00 | 8.00±0.00 | 8.00±0.00 | b |
Table text extracted from the original PDF; superscript letters are shown inline. The original table image is below.
View original table image
Figures and tables from the paper
| Treatments | V C (g/100ml) | V B3 (g/100ml) | V B6 (g/100ml) | Characteristic |
|---|---|---|---|---|
| T1 | 9.35±0.05 | 1.15±0.05 | 0.65±0.05 | e |
| T2 | 10.65±0.05 | 1.35±0.05 | 0.95±0.05 | d |
| T3 | 12.95±0.05 | 1.55±0.05 | 0.15±0.05 | c |
| T4 | 14.65±0.05 | 1.75±0.05 | 1.35±0.05 | b |
| T5 | 16.95±0.05 | 2.05±0.05 | 1.55±0.05 | a |
Table text extracted from the original PDF; superscript letters are shown inline. The original table image is below.
View original table image
References
21 in the original paper- Rajan A, Rajan AR, Philip D. Elettaria cardamomum seed mediated rapid synthesis of gold nanoparticles and its biological activities. OpenNano. 2017;2(August 2016):1-8.
- Ashokkumar K, Murugan M, Dhanya MK, Warkentin TD. Botany, traditional uses, phytochemistry and biological activities of Elettaria cardamomum (L.) Maton: A critical review. J Ethnopharmacol. 2020;246:112244.
- Savan EK, Küçükbay FZ. Essential oil composition of Elettaria cardamomum Maton. J Appl Biol Sci. 2013;7(3):42-45.
- Palani SN, Elangovan S, Menon A, Kumariah M, Tennyson J. An efficient nucleic acids extraction protocol for Elettaria cardamomum. Biocatal Agric Biotechnol. 2019;17(November 2018):207-212.
- Nadiya F, Anjali N, Thomas J, Gangaprasad A, Sabu KK. Transcriptome profiling of Elettaria cardamomum (L.) Maton (small cardamom). Genomics Data. 2017;11:102-103.
- Elguindy NM, Yacout GA, Azab ELEF. Amelioration of DENA-induced oxidative stress in rat kidney and brain by the essential oil of Elettaria cardamomum. Beni-Suef Univ J Basic Appl Sci. 2018;7(3):299-305.
- Souissi M, Azelmat J, Chaieb K, Grenier D. Antibacterial and anti-inflammatory activities of Elettaria cardamomum extracts: Potential therapeutic benefits for periodontal infections. Anaerobe. 2020;61:102089.
- Ganesan B, Weimer BC, Pinzon J, Kong DN, Rompato G, Brothersen C, et al. Probiotic bacteria survive in Cheddar cheese and modify populations of other lactic acid bacteria. J Appl Microbiol. 2014;116(6):16421656.
- Dimitrellou D, Kandylis P, Kourkoutas Y. Assessment of freeze-dried immobilized Lactobacillus casei as probiotic adjunct culture in yogurts. Foods. 2019;8(9):374.
- AOAC. Official Methods of Analysis of AOAC International. 12 th Ed. Washington, D.C.: AOAC, 2004.
- Al-Janabi HEH. Use of some bio-enhancers to produce functional beverages [Master's thesis]. Tikrit: Ministry of Higher Education and Scientific 2018.
- Abbasi ALHM. A chemical and biological study of vinegar types produced from different sources [Master's Thesis]. Tikrit: College of Agriculture, Tikrit University, 2013.
- Sen S, De B, Devanna N, Chakraborty R. Total phenolic, total flavonoid content, and antioxidant capacity of the leaves of Meyna spinosa Roxb., an Indian medicinal plant. Chin J Nat Med. 2013;11(2):149-157.
- Janabi ALHEH. Preparation of non-alcoholic fermented beverages from grapes and raisins using some probiotics [Ph.D. Thesis]. Tikrit: College of Agriculture, Tikrit University, 2023.
- Trisnawita YU N, Silalahi JA, Sinaga SM. The effect of storage condition on viability of lactic acid bacteria in probiotic product. Asian J Pharm Clin Res. 2018;11(84):10-22159.
- Vandenplas Y, Huys G, Daube G. Probiotics: An update. J Pediatr (Rio J). 2015;91(1):6-21.
- Kim M, Benayoun BA. The microbiome: An emerging key player in aging and longevity. Transl Med Aging. 2020.
- Reis SA, Conceição LL, Rosa DD, Siqueira NP, Peluzio MG. Mechanisms responsible for the hypocholesterolaemic effect of regular consumption of probiotics. Nutr Res Rev. 2017;30(1):36.
- Khatri I, Tomar R, Ganesan K, Prasad GS, Subramanian S. Complete genome sequence and comparative genomics of the probiotic yeast Saccharomyces boulardii. Sci Rep. 2017;7(1):1-12.
- Nataraj BH, Ali SA, Behare PV, Yadav H. Postbioticsparabiotics: the new horizons in microbial biotherapy and functional foods. Microbial Cell Factories. 2020;19(1):1-22.
- Ejtahed HS, Angoorani P, Soroush AR, Atlasi R, Ranjbar HS, Mortazavian AM, et al. Probiotics supplementation for obesity management: A systematic review of animal studies and clinical trials. J Funct Foods. 2019;52:228-242.