
Research article · 2025 · Full text
International Journal of Advanced Chemistry ResearchElectrochemical study and microbial evaluation of bioactive schiff base and its metal complex
Volume 7(5) · Pages 41–56 · DOI: 10.33545/26646781.2025.v7.i5a.278 ↗
Research areasExtraction and Separation Processes
Abstract
Author-writtenThe novel Schiff base ligand has been produced in methanol medium by combining 2-hydroxy-2-methypropiophenone and sulphapyridine. Complex of this Schiff base ligand with Cu (II) ion has been prepared with ligand metal salt ratio of 2:1. Spectroscopic techniques and elemental analysis have been used to clarify the structures of the produced compounds. The electrochemical behavior of the synthesized ligand, designated HMPSP, was investigated using cyclic voltammetry (CV) in Britton-Robinson (BR) buffer and aqueous phosphate buffer at GCE. CV investigations reveal that HMPSP ligand exhibits dielectric, diffusion control, irreversible reduction peak and the product of this reduction are secondary amines. Whereas the Cu (II)/Cu (I) redox systems are quasi-reversible necessitate a monoelectron transfer. The various kinetic parameters were also computed, including the diffusion coefficient (D01/2), charge-transfer coefficient (αn), and rate constant (K0f,h). The synthesized Schiff base ligand and its metal complex have been shown to be biologically effective against the fungi (Aspergillus niger & Penicillum chrysogenum) as well as the bacteria (Bacillus subtilis & Escherichia coli). In comparison to the standard, the microbiological result shows moderate activity.
Summary
Source-checkedPlain-language reading of the full paper, prepared with AI and checked against the text. Each point links to the authors' own words.
Why it matters
- Schiff bases are a group of pharmaceutical compounds with various pharmacological properties, making them a significant focus for pharmaceutical research. View evidence ↗
- Metal complexes of Schiff bases derived from sulfa drugs are particularly noteworthy because of their significant biological activity. View evidence ↗
- Cyclic voltammetry is a sensitive method used to study the stability, redox characteristics, and electrochemical kinetics of bioactive synthetic substances. View evidence ↗
The question
- The study aimed to synthesize a novel Schiff base from sulphapyridine and 2-hydroxy-2-methypropiophenone, and subsequently create its complex with the Cu(II) ion. View evidence ↗
- The researchers sought to investigate the electrochemical and antibacterial properties of both the synthesized ligand and its copper complex. View evidence ↗
What they did
- The Schiff base ligand (HMPSP) was synthesized by refluxing equimolar methanolic solutions of 2-hydroxy-2-methypropiophenone and sulphapyridine at 60°C for five to six hours. View evidence ↗
- The copper complex was prepared by combining the ligand and (CH3COO)2Cu.H2O in a 1:2 molar ratio in methanol. View evidence ↗
- Electrochemical measurements used a three-electrode system with a glassy carbon working electrode, an Ag/AgCl reference electrode, and a platinum wire counter electrode. View evidence ↗
- Antimicrobial activity was tested against Bacillus subtilis, Escherichia coli, Aspergillus niger, and Penicillum chrysogenum, using Ciprofloxacin and Ketoconazole as standards. View evidence ↗
What they found
- Cyclic voltammetry showed that the HMPSP ligand has an irreversible reduction peak and is diffusion-controlled, producing secondary amines upon reduction. View evidence ↗
- The redox system for the Cu(II)/Cu(I) complex was found to be quasi-reversible, involving a single electron transfer. View evidence ↗
- For the HMPSP ligand, both the cathodic peak potential and peak current increased linearly and shifted to more negative values as the scan rate increased. View evidence ↗
- The negative peak potential for the ligand was highest in methanol and lowest in acetone, indicating that solvent polarity affects the electrochemical reduction. View evidence ↗
- Increasing the pH caused the cathodic peak of the ligand to shift toward more negative potentials, suggesting that protons participate in the electrode process. View evidence ↗
- The Cu(II) complex exhibited lower Minimum Inhibitory Concentration (MIC) values than the HMPSP ligand, indicating it has greater antimicrobial activity. View evidence ↗
- When compared to the standard drugs, the synthesized compounds showed moderate antimicrobial activity. View evidence ↗
What it means
- The authors concluded that the metal complexes are more biologically active than the free Schiff base ligand. View evidence ↗
- The authors concluded that the reduction of the HMPSP ligand is irreversible and diffusion-controlled across the tested pH (5 to 8.2) and scan rate (50 to 250 mV/s) ranges. View evidence ↗
Visual summary
2 visualsIllustrations explain the paper; charts are replotted from the paper's own table values.
Synthesis Workflow
AI-generated conceptual illustration (Chemical molecules and a copper metal complex in a laboratory setting). It explains the idea and does not show study data.
View source evidence ↗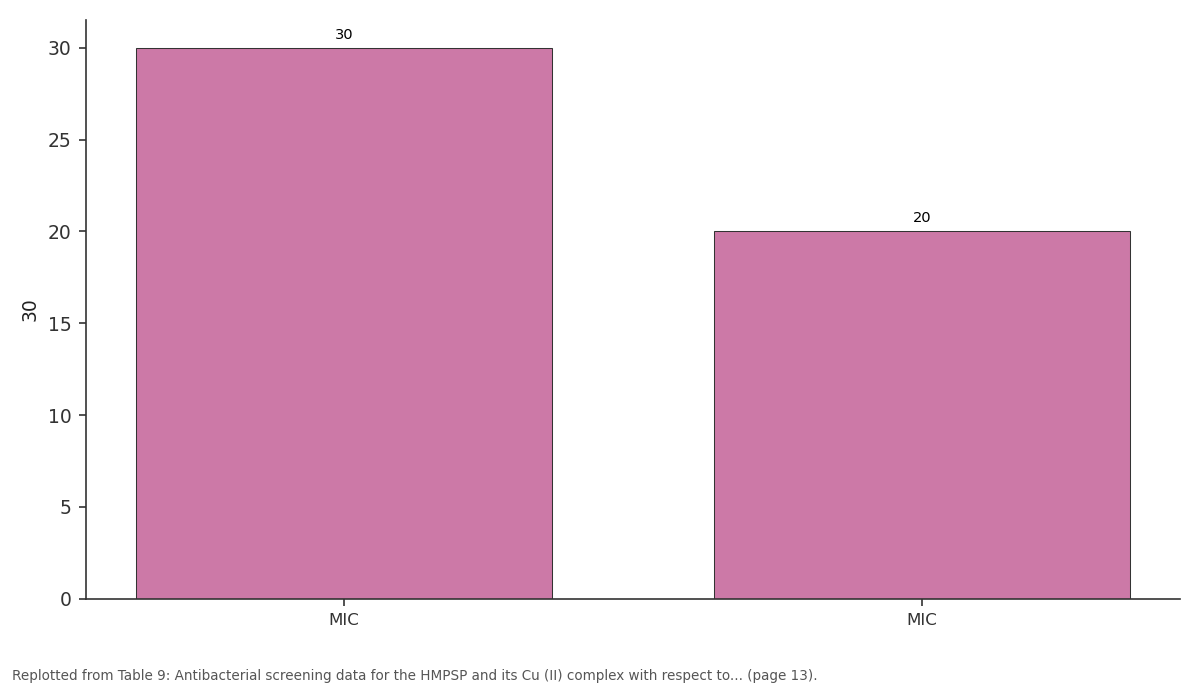
30: MIC vs MIC
Replotted from Table 9 (page 13) of the original paper. Every bar is the paper's own table value.
View source evidence ↗Figures & tables
From the original paper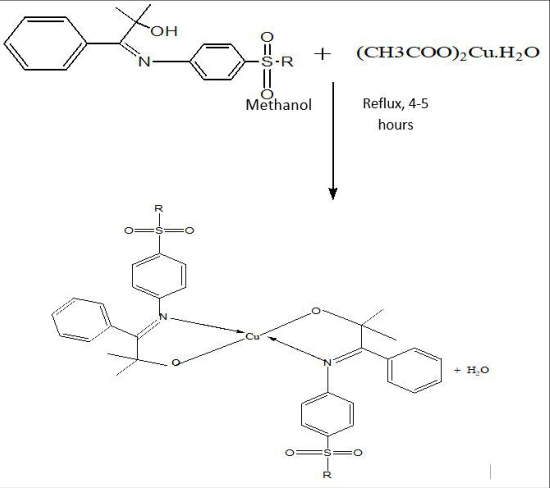 Figure 2Page 2
 Figure 1Page 2
 Table 1Page 3
 Table 2Page 3
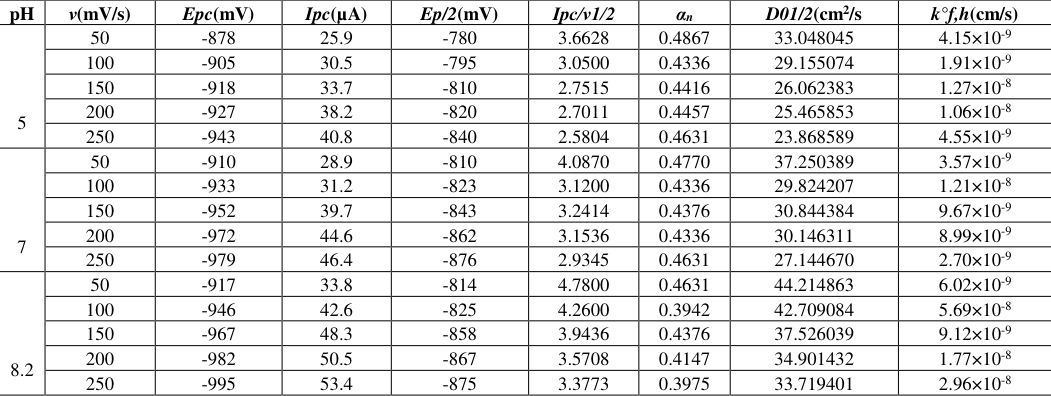 Table 3Page 4
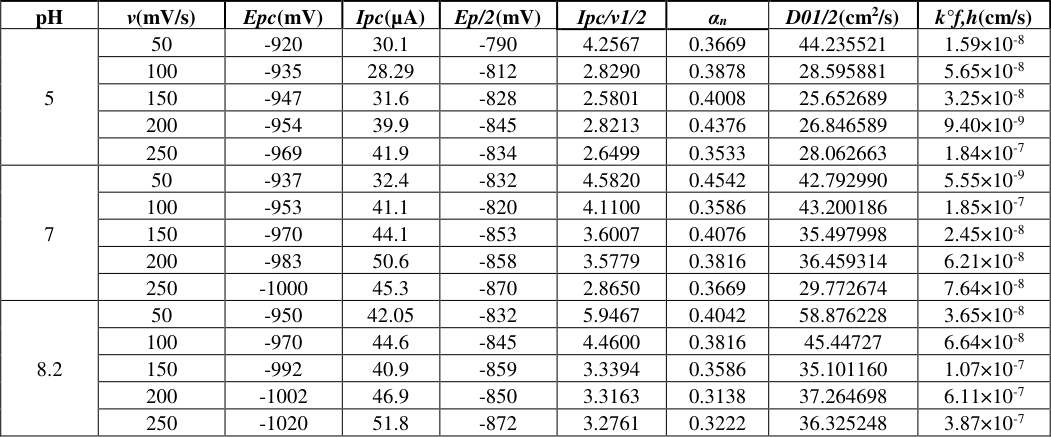 Table 4Page 4
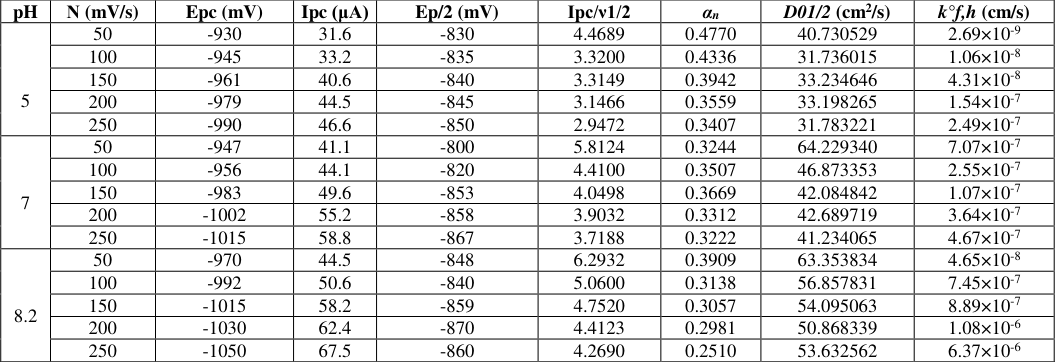 Table 5Page 5
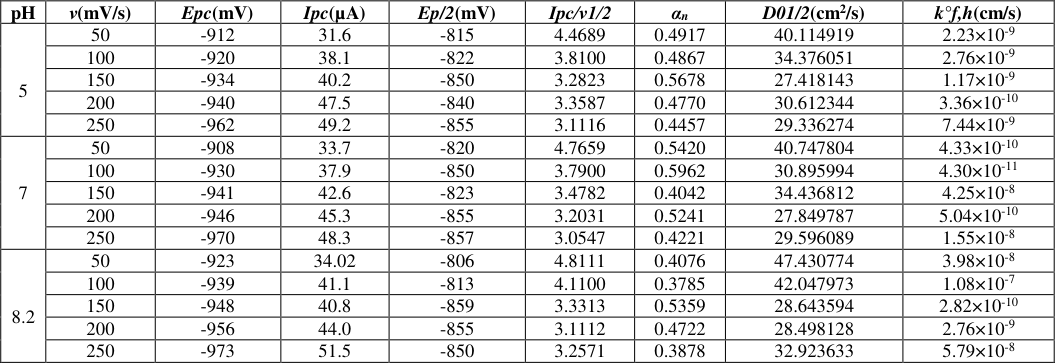 Table 6Page 5
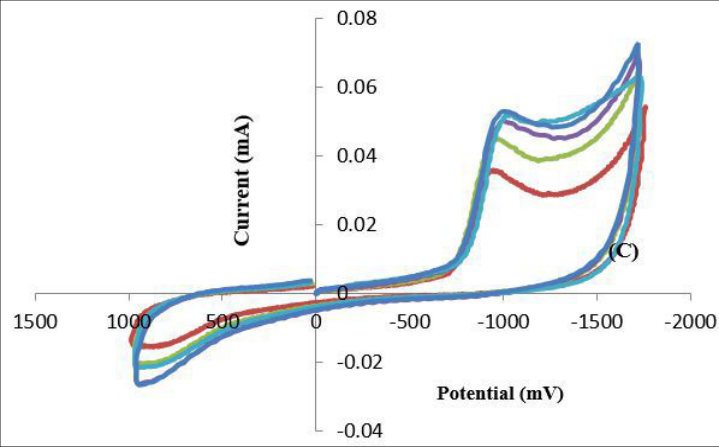 Figure 3Page 6
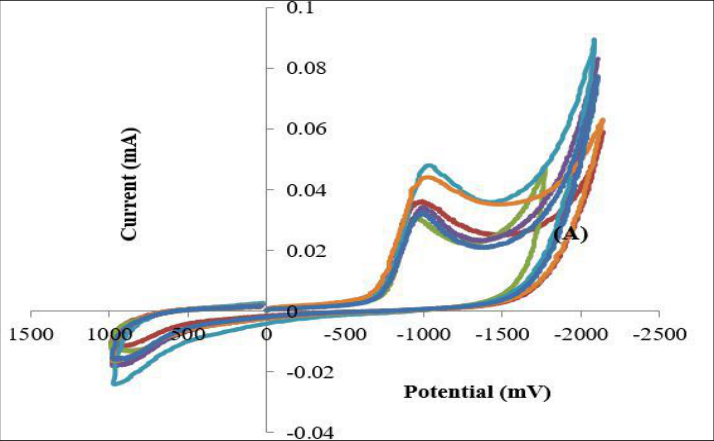 Figure 3Page 6
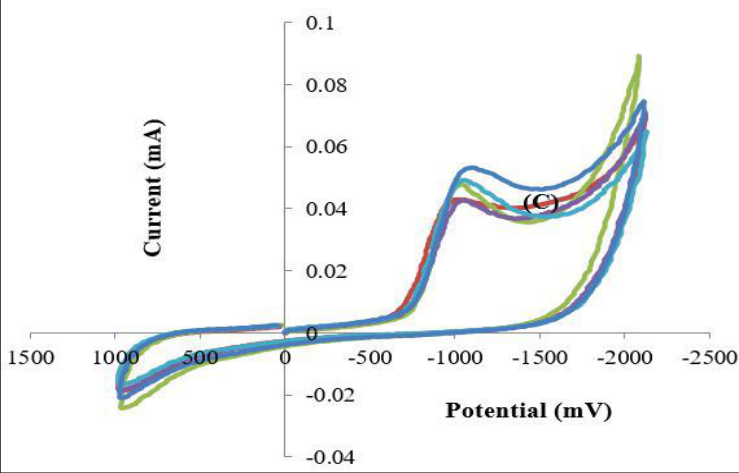 Figure 4Page 7
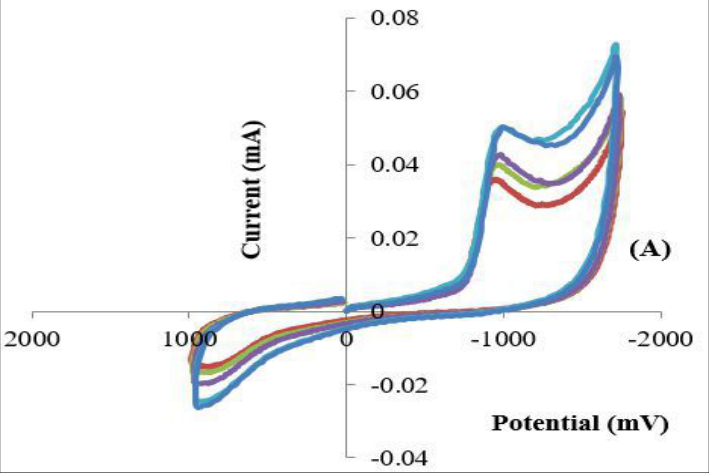 Figure 4Page 7
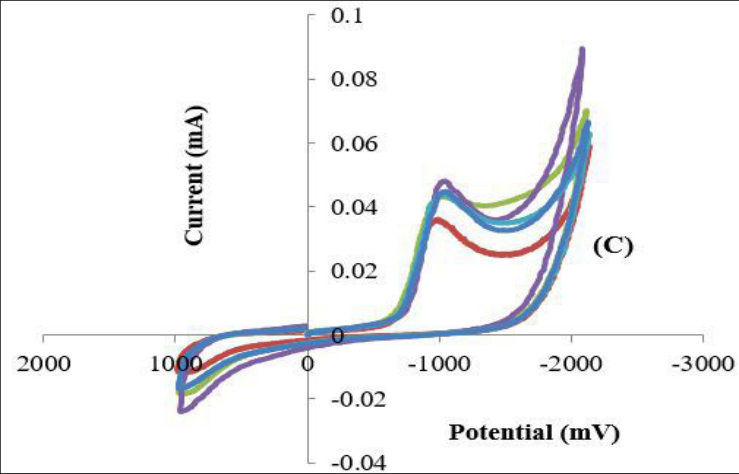 Figure 5Page 8
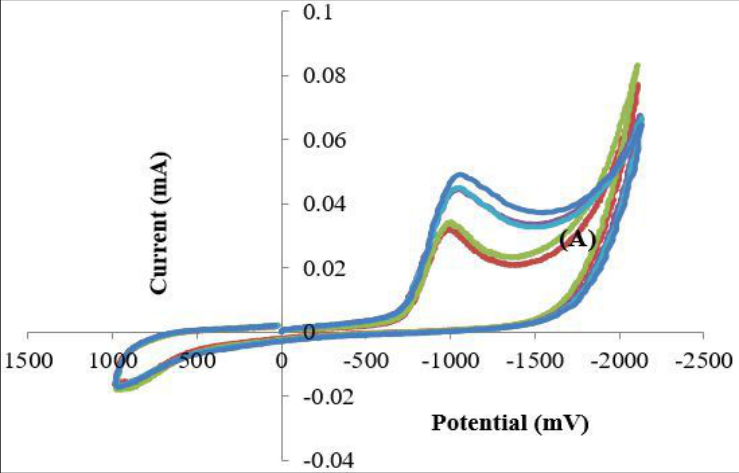 Figure 5Page 8
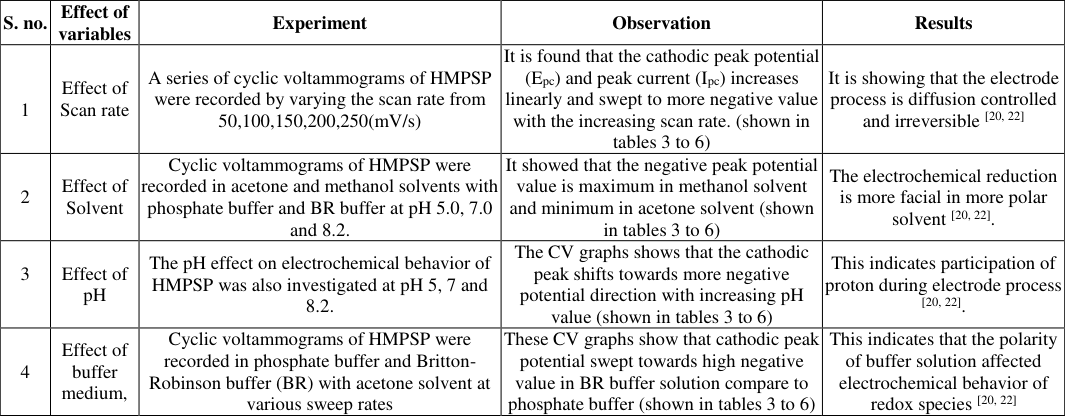 Table 7Page 9
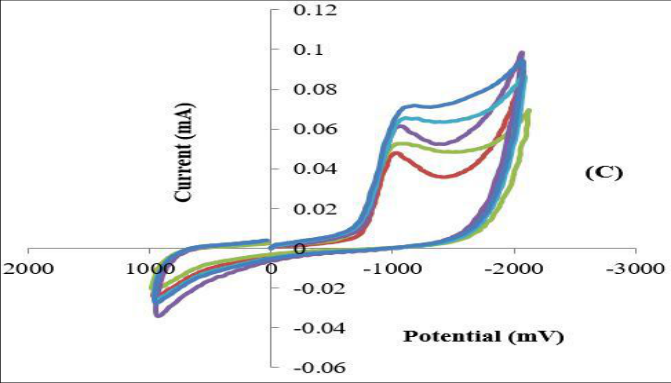 Figure 6Page 9
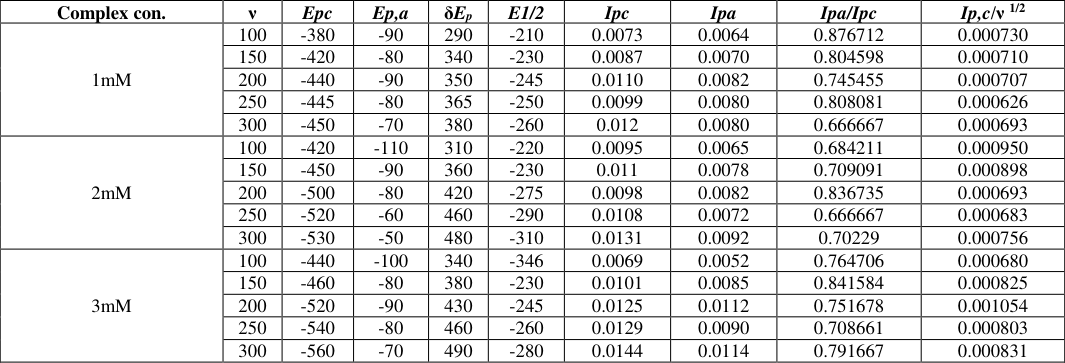 Table 8Page 10
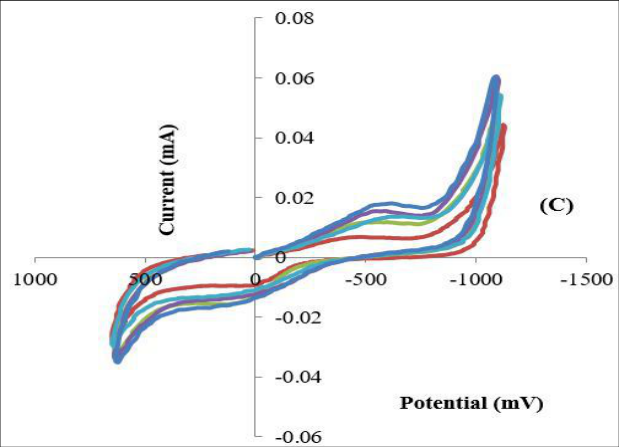 Figure 7Page 11
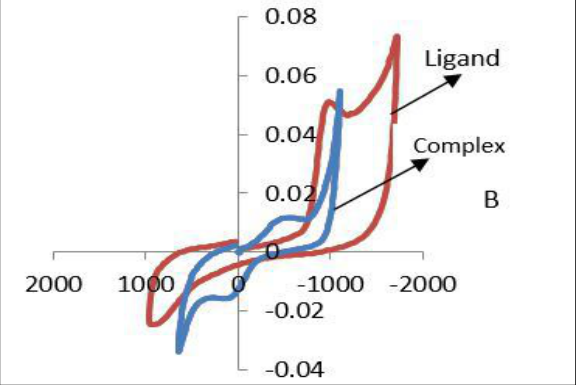 Figure 8Page 11
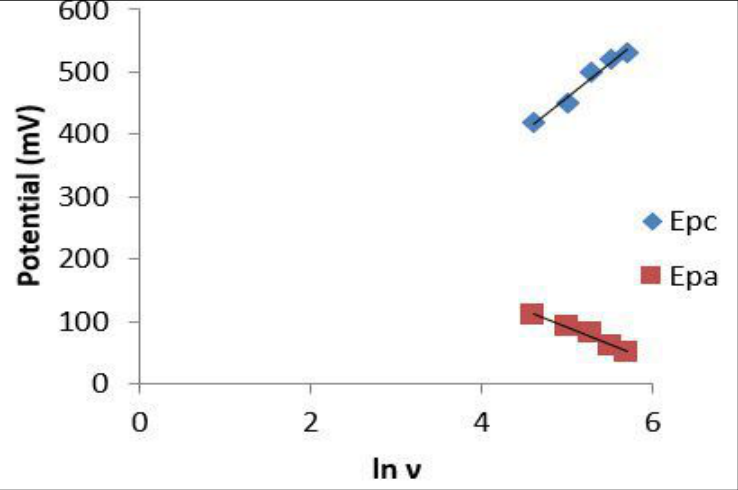 Figure 9Page 12
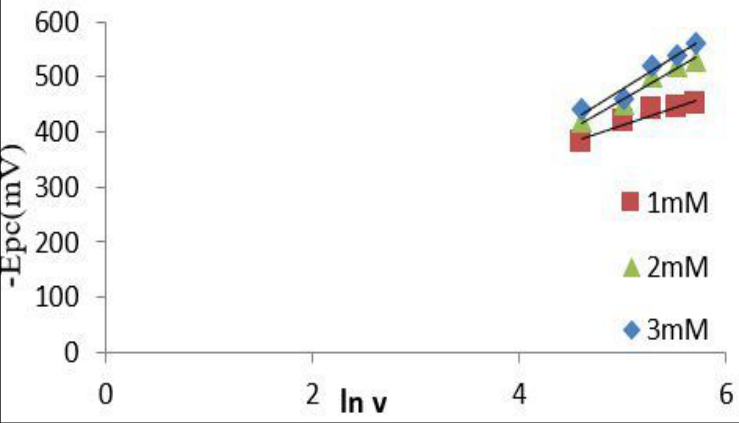 Figure 10Page 12
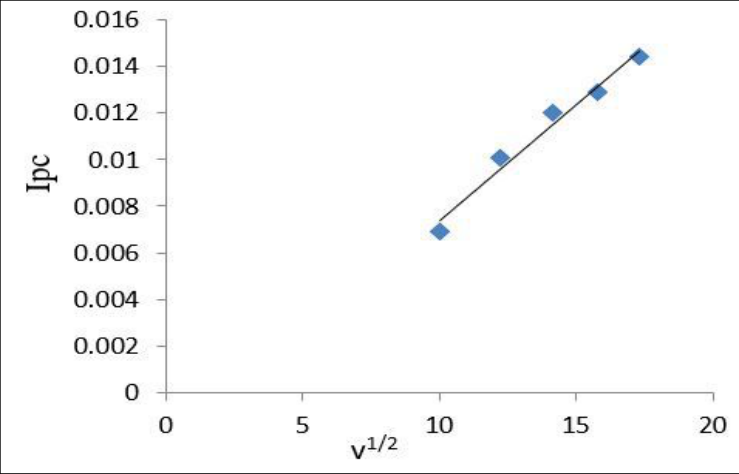 Fig. 11Page 12
 Table 9Page 13
 Table 10Page 13
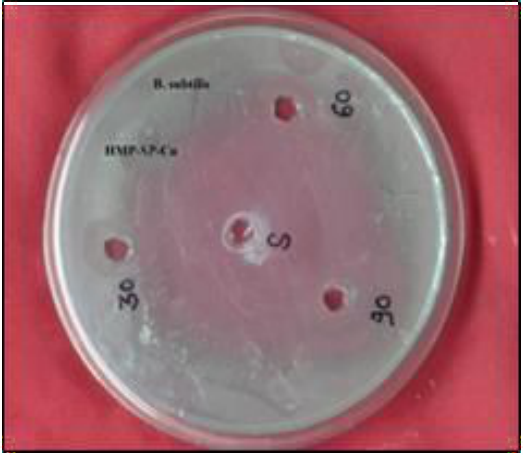 Figure 10Page 13
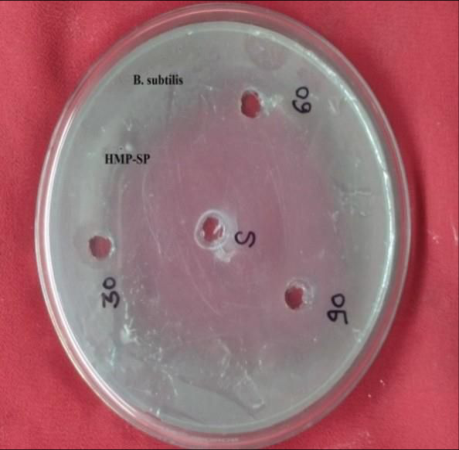 Figure 10Page 13
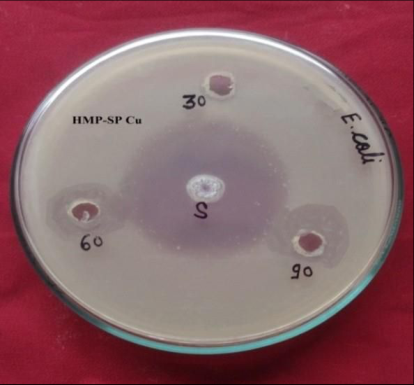 Fig. 11Page 14
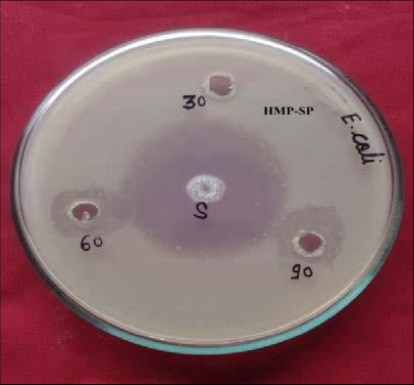 Fig. 11Page 14
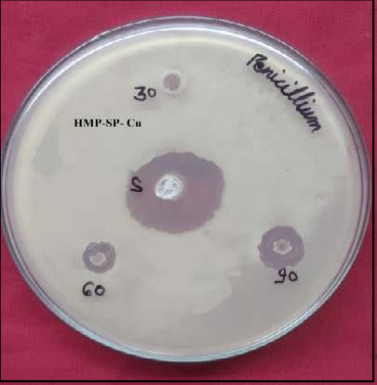 Figure 13Page 14
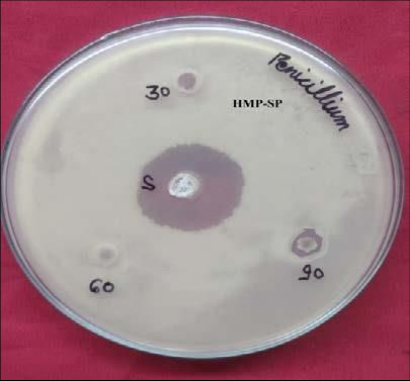 Figure 13Page 14
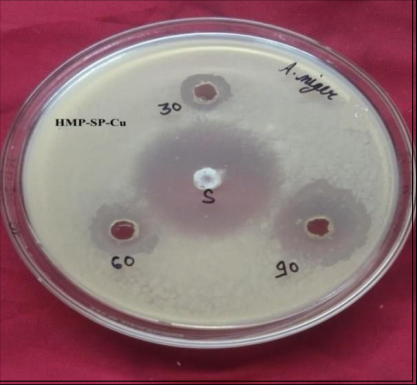 Fig.12Page 14
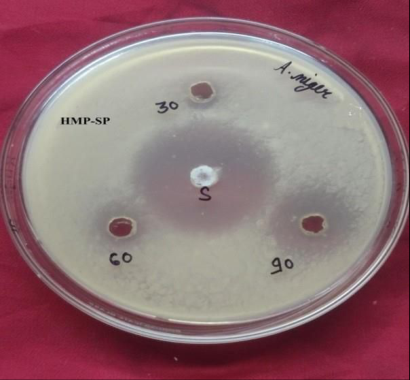 Fig.12Page 14
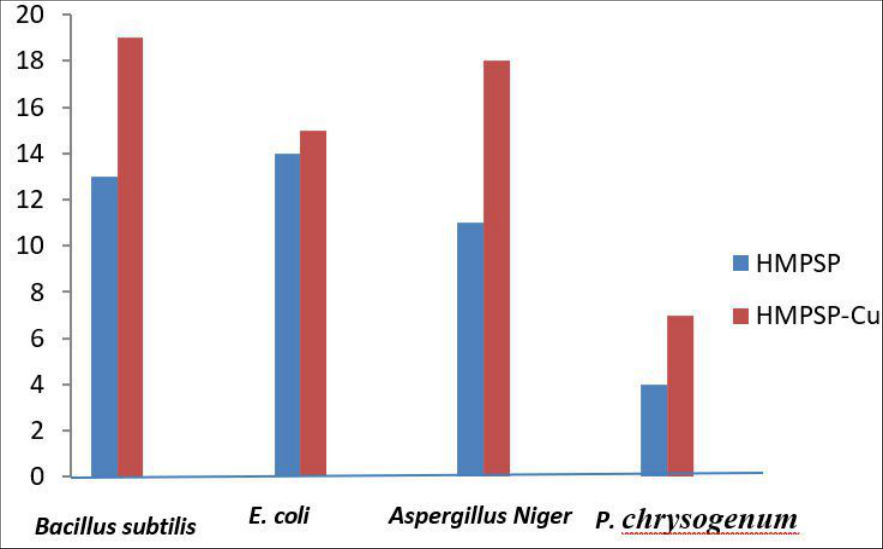 Figure 14Page 15
Introduction
Schiff's bases are an ensemble of physiologically active pharmaceutical compounds exhibiting diverse pharmacological properties that have garnered the attention of pharmaceutical researchers [1,4] . Transition metal complexes of Schiff bases, derived from amines and aldehydes, have been extensively studied. The Schiff base comprises nitrogen and oxygen donor atoms which provide it easiest to coordinate with transition metal ions to produce more thermally resistant and vibrant metal complexes [5,6] . Incorporating heteroatom-containing organic ligands as coordination sites has been a key strategy in coordination chemistry, yielding a variety of intriguing and beneficial compounds. Because it enables the formation of mono-, di-, or multinuclear complexes, the highly efficient chelating ability of ligands containing multiple donor heteroatom's have garnered attention globally.
The majority of pharmacological medicines comprise metal compounds that are now being used in clinical contexts, and new application areas are opening up gradually. The coordination chemistry of the metallic complexes of Schiff bases produced from sulfa medicines has attracted a lot of attention due to their significance biological action [7,9] . In addition to being physiologically active, the condensation products of sulfa drugs with aldehydes and ketones also combine with metal ions to form complexes. Numerous chemotherapeutically significant sulfa drugs, such as sulfadiazine, sulfa pyridine, and sulfa merazine, have the crucial toxophoric functional group -SO2NH-. Azomethine have been used as catalysts, analytical reagents, and azo compounds for use as pigments and dyes. In experiments using H2SO4 at different temperatures and concentrations, they also showed that mild steel corrosion may be inhibited [10] . Using the cyclic voltammetry approach, the electrochemical behavior of bioactive synthetic substances was investigated. This method is highly sensitive and effective in providing important information such as the stability of the compound under study, the kinetics of electrochemical processes occurring at electrode surfaces, and redox characteristics.
The resulting graph, known as a cyclic voltammogram, is obtained by plotting the current density against the applied potential. Any electrode response that is occurring will show a peak in the measured current at that voltage. The electrode material, electrolyte content, and sweep rate can all affect a process's peak breadth and height. The function of adsorption, diffusion, and linked homogeneous chemical reaction may be investigated with the use of a cyclic voltammogram [11,12] . In this study, an effort has been made to produce Schiff base by combining sulphapyridine and 2-hydroxy-2methypropiophenone, as well as its complex with the Cu (II) ion. Characterization was carried out using a elemental analysis and spectral techniques. Additionally, the antibacterial and electrochemical properties of the ligand and its Cu (II) complex were investigated.
Experimental 2.1. Materials and Apparatus
All chemicals were analytical grade and of the highest available purity, and used without further purification. For the preparation of Schiff base ligand and their complexes, 2-hydroxy-2-methypropiophenone, sulfa pyridine and Cu (II) salts were obtained from Sigma-Aldrich. For the preparation of phosphate buffer and BR buffer, disodiumhydrogenphosphate (Na2HPO4), sodium dihydrogen phosphate (NaH2PO4), acetic acid, phosphoric acid and boric acid were obtained from Sigma-Aldrich. Double distilled water (DDW) and purified solvent were used for cyclic voltammetric studies. Cyclic voltammetric measurements were performed using computerized constant current source provided by Retrace Electronics which is fully digitally controlled. The digital pH meter (Elico) was used to measure the pH of solutions. The infrared spectra of synthesized compounds were recorded on KBr pellets in the range 4000-400 cm -1 on an FT-IR spectrometer (Schimadzu).
Preparation of the Schiff base and its Copper (II) complex 2.2.1. Preparation of the Schiff base (HMPSP)
Chemicals of the AR grade were used in this method. In an equimolar ratio, heated methanolic solutions of 2-hydroxy-2-methypropiophenone and sulphapyridine were combined while being constantly stirred. The resultant mixture was refluxed at 60 o C for five to six hours. The reaction mixture's volume was cut in half, or to one-fourth of the original quantity by refluxing After cooling, the solid bulk separated was filtered off, cleaned with ethanol, and vacuum-dried over anhydrous CaCl2 [13] .
Preparation of the Copper (II) complex
A heated solution of the produced ligand in the methanol was combined with a Methanolic solution of (CH3COO)2 Cu. H2O in a 1:2 molar ratio to produce the copper complex. The resulting reaction mixture was stirred before being heated at 50 0 C under reflux for three to four hours. Dark color complex then began to form and were filtered, methanol cleaned, and vacuum-dried over anhydrous calcium chloride. The formation reaction and structure of prepared coordination compounds complex are shown in fig. 2.
Cyclic voltammetric Experiments
Cyclic voltammetric measurements were performed using computerized constant current source which is fully digitally controlled. A three electrode system consisting of glassy carbon electrode (GCE) as the working electrode, Ag/AgCl as the reference electrode and platinum wire as the counter electrode was used [14] . In the typical cyclic voltammetric experiment, before recording the current voltage curve, the experimental solution was deoxygenated by purging a stream of nitrogen gas for10-15 minutes prior to the experiments in order to remove dissolved oxygen from the media. The pH of experimental solutions varied from 5.0 to 8.2 and the scan rate was varied from50 mVs -1 to 250 mVs -1 .
All experiments were investigated at room temperature.
Antibacterial experiments
The synthesized compounds were tested against two bacterial strains (Bacillus subtilis, Escherichia coli) and two fungi (Aspergillus niger, Penicillum chrysogenum) while Ciprofloxacin and Ketoconazole were used as the standard for bacterial and fungal studies, respectively. The agar well diffusion method [15] , a common microbiological methodology, was performed for the in-vitro antimicrobial screening.
Calculation the activity index: It was calculated as follows for the plant compounds
Calculation the activity index: It was calculated as follows for the plant compounds
Minimum Inhibitory Concentration (MIC)
This concentration is the lowest amount of an antibiotic that will prevent a microbe from growing visibly following incubation. By diluting a certain amount of the substance to different concentrations, the Macro-broth dilution approach was employed to calculate the value of MIC of the samples (Baron and Finegold, 1990).
Results and Discussion
The structure of novel Schiff base was elucidated by several analytical and physical techniques. The metal (II) complex was formed using the synthesized Schiff base in 1:2 ratios. The obtained analytical and physical results were in good agreement with the suggested composition of Schiff base and its metal (II) complex. The synthesized metal (II) complex is colored, stable in air and insoluble in water, but completely soluble in DMSO and DMF solvents. The physico-chemical data of the complexes are summarized in (Table -1).
FTIR spectral studies:
The infra-red spectra of HMPSP ligand and its Cu (II) complex were recorded on KBr pellets in the range 4000-400 cm -1 on an FT-IR spectrometer (Schimadzu). The binding site of the ligand in metal (II) complexes can be determined a lot by comparing the infrared spectra of the free ligand and its metal (II) complexes (Table -2) lists the selected IR vibrations and approximate assignments for the ligand HMPSP and its metal (II) complex. The infrared spectra of Schiff base showed a prominent absorption band at 3420 cm -1 and a band at 1633 cm -1 , which were attributed to the stretching vibrations of ν(O-H) and azomethine (-CR=N-)
group respectively [16,18] . The frequency for (-CR=N) bond decreased by 13-20 cm-1 for all metal complexes, indicating coordination of the nitrogen atom of ligand to M
(II) ion. The broad and strong band due to υ(OH) 3420 cm - 1 in ligand spectra, disappear in the complex formation, showing oxygen coordination to metal ion by deprotonation. The appearance of new bands in regions 460-465 cm -1 and 560-570 cm -1 assignable to υM-O and υM-N respectively attributed to the bonding of metal ions to oxygen and nitrogen atoms in Cu(II) [16,18] . The frequency for the Schiff base because of νasy (SO2) and νsy(SO2) was observed at 1325-1340 cm -1 and 1145-1128 cm-1 , respectively. No change occurs in these bands in the complexes which show no involvement of-SO2 group for coordination. Water vibration bands were absent in Cu (II) complex spectra indicating that it was not present in the Cu (II) complex [16,18] . This conclusion was further reinforced by the results of the CHN analysis. (SO2-NH-) proton at δ 11.10 (1H, s) [16,18] . The hydroxyl proton resonates as a singlet at δ 4.78 ppm in case of ligand and disappears in the Cu (II) complexes which indicate the involvement of hydroxyl group oxygen in the coordination via deprotonation, which has already been shown by IR spectral data. These observations support the following assigned structure of HMPSP as well as Cu (II) complex.
Electrochemical studies 3.3.1 Electrochemical studies of HPSP ligand
The cyclic voltammetric data were recorded with fully computer controlled electro analytical system, using three electrode cell assemblies with glassy carbon as working electrode. The cyclic voltammograms of above introduced ligand were recorded between +800mV to -1600mV in the scan rate interval of 50-250 mV/sec, at constant pH and concentration of experimental solution. The electrochemical behavior of HMPSP was recorded in acetones, methanol solvents, using phosphate buffer and BR buffer of different pH values. The cyclic voltammetric data for ligand are summarized in table 3-6 and fig. 3456showed the cyclic voltammograms of HMPSP in different conditions. In all the cyclic voltammograms HMPSP displays only one irreversible cathodic wave. In the anodic side of the reverse scan, no peak could be seen, suggesting irreversible nature of the electrodes process 19 .In all the cyclic voltammograms the current function (Ipc /ν 1/2 ) has been found to be fairly constant with respect to scan rate showing that the electrode process is diffusion controlled. The various kinetic parameters assessed with the help of CV graphs, are reported in the tables It is showing that the electrode process is diffusion controlled and irreversible [20,22] 2
| pH | ν(mV/s) | Epc(mV) | Ipc(µA) | Ep/2(mV) | Ipc/ν1/2 | αn | D01/2(cm2/s | k°f,h(cm/s) |
|---|---|---|---|---|---|---|---|---|
| 5 | 50 | -878 | 25.9 | -780 | 3.6628 | 0.4867 | 33.048045 | 4.15×10⁻⁹ |
| 100 | -905 | 30.5 | -795 | 3.0500 | 0.4336 | 29.155074 | 1.91×10⁻⁹ | |
| 150 | -918 | 33.7 | -810 | 2.7515 | 0.4416 | 26.062383 | 1.27×10⁻⁸ | |
| 200 | -927 | 38.2 | -820 | 2.7011 | 0.4457 | 25.465853 | 1.06×10⁻⁸ | |
| 250 | -943 | 40.8 | -840 | 2.5804 | 0.4631 | 23.868589 | 4.55×10⁻⁹ | |
| 7 | 50 | -910 | 28.9 | -810 | 4.0870 | 0.4770 | 37.250389 | 3.57×10⁻⁹ |
| 100 | -933 | 31.2 | -823 | 3.1200 | 0.4336 | 29.824207 | 1.21×10⁻⁸ | |
| 150 | -952 | 39.7 | -843 | 3.2414 | 0.4376 | 30.844384 | 9.67×10⁻⁹ | |
| 200 | -972 | 44.6 | -862 | 3.1536 | 0.4336 | 30.146311 | 8.99×10⁻⁹ | |
| 250 | -979 | 46.4 | -876 | 2.9345 | 0.4631 | 27.144670 | 2.70×10⁻⁹ | |
| 8.2 | 50 | -917 | 33.8 | -814 | 4.7800 | 0.4631 | 44.214863 | 6.02×10⁻⁹ |
| 100 | -946 | 42.6 | -825 | 4.2600 | 0.3942 | 42.709084 | 5.69×10⁻⁸ | |
| 150 | -967 | 48.3 | -858 | 3.9436 | 0.4376 | 37.526039 | 9.12×10⁻⁹ | |
| 200 | -982 | 50.5 | -867 | 3.5708 | 0.4147 | 34.901432 | 1.77×10⁻⁸ | |
| 250 | -995 | 53.4 | -875 | 3.3773 | 0.3975 | 33.719401 | 2.96×10⁻⁸ |
Table text extracted from the original PDF; superscript letters are shown inline. The original table image is below.
View original table image
Effect of Solvent
Cyclic voltammograms of HMPSP were recorded in acetone and methanol solvents with phosphate buffer and BR buffer at pH 5.0, 7.0 and 8.2.
It showed that the negative peak potential value is maximum in methanol solvent and minimum in acetone solvent (shown in tables 3 to 6)
The electrochemical reduction is more facial in more polar solvent [20,22] .
Effect of pH
The pH effect on electrochemical behavior of HMPSP was also investigated at pH 5, 7 and 8.2.
The CV graphs shows that the cathodic peak shifts towards more negative potential direction with increasing pH value (shown in tables 3 to 6)
This indicates participation of proton during electrode process [20, 22] .
4
Effect of buffer medium, Cyclic voltammograms of HMPSP were recorded in phosphate buffer and Britton-Robinson buffer (BR) with acetone solvent at various sweep rates These CV graphs show that cathodic peak potential swept towards high negative value in BR buffer solution compare to phosphate buffer (shown in tables 3 to 6)
This indicates that the polarity of buffer solution affected electrochemical behavior of redox species [20,22] 3. The CV of complex shows a quasi-reversible peak corresponding to the formation of Cu (II)/Cu (I) couple at given potential. The ratio between the anodic and cathodic peak current is less than unity (IPa/IPc<1) corresponding to a simple one electron transfer process. 23 A linear dependence between cathodic peak current (IPc) and the square of the scan rates (υ 1/2 ) have been also observed.
This fact implies that these electrochemical process are mainly diffusion controlled. The Schiff bases ligand and its Cu complex were tested against two bacterial strains (Bacillus subtilis, Escherichia coli) and two fungi (Aspergillus niger, Penicillum chrysogenum) while Ciprofloxacin and Ketoconazole were used as the standard for bacterial and fungal studies, respectively. The Agar Well Diffusion method, a common microbiological methodology, was performed for the invitro antimicrobial screening. In order to create solutions with varying concentrations of synthesized compounds as shown in tables. The results revealed that the synthesized compounds exhibited various levels of inhibition. It was found that the Cu (II) complex shows less MIC value compared to HMPSP ligand reveals that Cu (II) complex have greater activity against tested organisms compared to HMPSP ligands as shown in histogram. This enhancement in the activity of the metal complexes can be explained on the basis of the chelation theory [24,25] . Chelation reduces the polarity of metal ions to a greater extent so the complex becomes more lipophilic, which is an essential element in governing antibacterial action. High lipophilicity increases the ability of complexes to penetrate lipid membranes, which in turn prevents protein synthesis and restricts organism development Antimicrobial studies show that the complexes were more active than the free ligand
Acknowledgement
AcknowledgmentThe authors express sincere thanks to the Head, Department of Chemistry, University of Rajasthan, Jaipur for providing research facilities.
Figures and tables from the paper
| pH | ν(mV/s) | Epc(mV) | Ipc(µA) | Ep/2(mV) | Ipc/ν1/2 | α n | D01/2(cm2/s) | k°f,h(cm/s) |
|---|---|---|---|---|---|---|---|---|
| 5 | 50 | -920 | 30.1 | -790 | 4.2567 | 0.3669 | 44.235521 | 1.59×10⁻⁸ |
| 100 | -935 | 28.29 | -812 | 2.8290 | 0.3878 | 28.595881 | 5.65×10⁻⁸ | |
| 150 | -947 | 31.6 | -828 | 2.5801 | 0.4008 | 25.652689 | 3.25×10⁻⁸ | |
| 200 | -954 | 39.9 | -845 | 2.8213 | 0.4376 | 26.846589 | 9.40×10⁻⁹ | |
| 250 | -969 | 41.9 | -834 | 2.6499 | 0.3533 | 28.062663 | 1.84×10⁻⁷ | |
| 7 | 50 | -937 | 32.4 | -832 | 4.5820 | 0.4542 | 42.792990 | 5.55×10⁻⁹ |
| 100 | -953 | 41.1 | -820 | 4.1100 | 0.3586 | 43.200186 | 1.85×10⁻⁷ | |
| 150 | -970 | 44.1 | -853 | 3.6007 | 0.4076 | 35.497998 | 2.45×10⁻⁸ | |
| 200 | -983 | 50.6 | -858 | 3.5779 | 0.3816 | 36.459314 | 6.21×10⁻⁸ | |
| 250 | -1000 | 45.3 | -870 | 2.8650 | 0.3669 | 29.772674 | 7.64×10⁻⁸ | |
| 8.2 | 50 | -950 | 42.05 | -832 | 5.9467 | 0.4042 | 58.876228 | 3.65×10⁻⁸ |
| 100 | -970 | 44.6 | -845 | 4.4600 | 0.3816 | 45.44727 | 6.64×10⁻⁸ | |
| 150 | -992 | 40.9 | -859 | 3.3394 | 0.3586 | 35.101160 | 1.07×10⁻⁷ | |
| 200 | -1002 | 46.9 | -850 | 3.3163 | 0.3138 | 37.264698 | 6.11×10⁻⁷ | |
| 250 | -1020 | 51.8 | -872 | 3.2761 | 0.3222 | 36.325248 | 3.87×10⁻⁷ |
Table text extracted from the original PDF; superscript letters are shown inline. The original table image is below.
View original table image
| pH | Ν (mV/s) | Epc (mV) | Ipc (μA) | Ep/2 (mV) | Ipc/ν1/2 | αn | D01/2 (cm2/s) | k°f,h (cm/s) |
|---|---|---|---|---|---|---|---|---|
| 5 | 50 | -930 | 31.6 | -830 | 4.4689 | 0.4770 | 40.730529 | 2.69×10⁻⁹ |
| 100 | -945 | 33.2 | -835 | 3.3200 | 0.4336 | 31.736015 | 1.06×10⁻⁸ | |
| 150 | -961 | 40.6 | -840 | 3.3149 | 0.3942 | 33.234646 | 4.31×10⁻⁸ | |
| 200 | -979 | 44.5 | -845 | 3.1466 | 0.3559 | 33.198265 | 1.54×10⁻⁷ | |
| 250 | -990 | 46.6 | -850 | 2.9472 | 0.3407 | 31.783221 | 2.49×10⁻⁷ | |
| 7 | 50 | -947 | 41.1 | -800 | 5.8124 | 0.3244 | 64.229340 | 7.07×10⁻⁷ |
| 100 | -956 | 44.1 | -820 | 4.4100 | 0.3507 | 46.873353 | 2.55×10⁻⁷ | |
| 150 | -983 | 49.6 | -853 | 4.0498 | 0.3669 | 42.084842 | 1.07×10⁻⁷ | |
| 200 | -1002 | 55.2 | -858 | 3.9032 | 0.3312 | 42.689719 | 3.64×10⁻⁷ | |
| 250 | -1015 | 58.8 | -867 | 3.7188 | 0.3222 | 41.234065 | 4.67×10⁻⁷ | |
| 8.2 | 50 | -970 | 44.5 | -848 | 6.2932 | 0.3909 | 63.353834 | 4.65×10⁻⁸ |
| 100 | -992 | 50.6 | -840 | 5.0600 | 0.3138 | 56.857831 | 7.45×10⁻⁷ | |
| 150 | -1015 | 58.2 | -859 | 4.7520 | 0.3057 | 54.095063 | 8.89×10⁻⁷ | |
| 200 | -1030 | 62.4 | -870 | 4.4123 | 0.2981 | 50.868339 | 1.08×10⁻⁶ | |
| 250 | -1050 | 67.5 | -860 | 4.2690 | 0.2510 | 53.632562 | 6.37×10⁻⁶ |
Table text extracted from the original PDF; superscript letters are shown inline. The original table image is below.
View original table image
| pH | ν(mV/s) | Epc(mV) | Ipc(µA) | Ep/2(mV) | Ipc/ν1/2 | αn | D01/2(cm2/s) | k°f,h(cm/s) |
|---|---|---|---|---|---|---|---|---|
| 5 | 50 | -912 | 31.6 | -815 | 4.4689 | 0.4917 | 40.114919 | 2.23×10⁻⁹ |
| 100 | -920 | 38.1 | -822 | 3.8100 | 0.4867 | 34.376051 | 2.76×10⁻⁹ | |
| 150 | -934 | 40.2 | -850 | 3.2823 | 0.5678 | 27.418143 | 1.17×10⁻⁹ | |
| 200 | -940 | 47.5 | -840 | 3.3587 | 0.4770 | 30.612344 | 3.36×10⁻¹⁰ | |
| 250 | -962 | 49.2 | -855 | 3.1116 | 0.4457 | 29.336274 | 7.44×10⁻⁹ | |
| 7 | 50 | -908 | 33.7 | -820 | 4.7659 | 0.5420 | 40.747804 | 4.33×10⁻¹⁰ |
| 100 | -930 | 37.9 | -850 | 3.7900 | 0.5962 | 30.895994 | 4.30×10⁻¹¹ | |
| 150 | -941 | 42.6 | -823 | 3.4782 | 0.4042 | 34.436812 | 4.25×10⁻⁸ | |
| 200 | -946 | 45.3 | -855 | 3.2031 | 0.5241 | 27.849787 | 5.04×10⁻¹⁰ | |
| 250 | -970 | 48.3 | -857 | 3.0547 | 0.4221 | 29.596089 | 1.55×10⁻⁸ | |
| 8.2 | 50 | -923 | 34.02 | -806 | 4.8111 | 0.4076 | 47.430774 | 3.98×10⁻⁸ |
| 100 | -939 | 41.1 | -813 | 4.1100 | 0.3785 | 42.047973 | 1.08×10⁻⁷ | |
| 150 | -948 | 40.8 | -859 | 3.3313 | 0.5359 | 28.643594 | 2.82×10⁻¹⁰ | |
| 200 | -956 | 44.0 | -855 | 3.1112 | 0.4722 | 28.498128 | 2.76×10⁻⁹ | |
| 250 | -973 | 51.5 | -850 | 3.2571 | 0.3878 | 32.923633 | 5.79×10⁻⁸ |
Table text extracted from the original PDF; superscript letters are shown inline. The original table image is below.
View original table image
| S. no. | Effect of variables | Experiment | Observation | Results |
|---|---|---|---|---|
| 1 | Effect of Scan rate | A series of cyclic voltammograms of HMPSP were recorded by varying the scan rate from 50,100,150,200,250(mV/s) | It is found that the cathodic peak potential (Epc) and peak current (Ipc) increases linearly and swept to more negative value with the increasing scan rate. (shown in tables 3 to 6) | It is showing that the electrode process is diffusion controlled and irreversible [20, 22] |
| 2 | Effect of Solvent | Cyclic voltammograms of HMPSP were recorded in acetone and methanol solvents with phosphate buffer and BR buffer at pH 5.0, 7.0 and 8.2. | It showed that the negative peak potential value is maximum in methanol solvent and minimum in acetone solvent (shown in tables 3 to 6) | The electrochemical reduction is more facial in more polar solvent [20, 22]. |
| 3 | Effect of pH | The pH effect on electrochemical behavior of HMPSP was also investigated at pH 5, 7 and 8.2. | The CV graphs shows that the cathodic peak shifts towards more negative potential direction with increasing pH value (shown in tables 3 to 6) | This indicates participation of proton during electrode process [20, 22]. |
| 4 | Effect of buffer medium, | Cyclic voltammograms of HMPSP were recorded in phosphate buffer and Britton- Robinson buffer (BR) with acetone solvent at various sweep rates | These CV graphs show that cathodic peak potential swept towards high negative value in BR buffer solution compare to phosphate buffer (shown in tables 3 to 6) | This indicates that the polarity of buffer solution affected electrochemical behavior of redox species [20, 22] |
Table text extracted from the original PDF; superscript letters are shown inline. The original table image is below.
View original table image
| Complex con. | ν | Epc | Ep,a | δEp | E1/2 | Ipc | Ipa | Ipa/Ipc | Ip,c/ν 1/2 |
|---|---|---|---|---|---|---|---|---|---|
| 1mM | 100 | -380 | -90 | 290 | -210 | 0.0073 | 0.0064 | 0.876712 | 0.000730 |
| 150 | -420 | -80 | 340 | -230 | 0.0087 | 0.0070 | 0.804598 | 0.000710 | |
| 200 | -440 | -90 | 350 | -245 | 0.0110 | 0.0082 | 0.745455 | 0.000707 | |
| 250 | -445 | -80 | 365 | -250 | 0.0099 | 0.0080 | 0.808081 | 0.000626 | |
| 300 | -450 | -70 | 380 | -260 | 0.012 | 0.0080 | 0.666667 | 0.000693 | |
| 2mM | 100 | -420 | -110 | 310 | -220 | 0.0095 | 0.0065 | 0.684211 | 0.000950 |
| 150 | -450 | -90 | 360 | -230 | 0.011 | 0.0078 | 0.709091 | 0.000898 | |
| 200 | -500 | -80 | 420 | -275 | 0.0098 | 0.0082 | 0.836735 | 0.000693 | |
| 250 | -520 | -60 | 460 | -290 | 0.0108 | 0.0072 | 0.666667 | 0.000683 | |
| 300 | -530 | -50 | 480 | -310 | 0.0131 | 0.0092 | 0.70229 | 0.000756 | |
| 3mM | 100 | -440 | -100 | 340 | -346 | 0.0069 | 0.0052 | 0.764706 | 0.000680 |
| 150 | -460 | -80 | 380 | -230 | 0.0101 | 0.0085 | 0.841584 | 0.000825 | |
| 200 | -520 | -90 | 430 | -245 | 0.0125 | 0.0112 | 0.751678 | 0.001054 | |
| 250 | -540 | -80 | 460 | -260 | 0.0129 | 0.0090 | 0.708661 | 0.000803 | |
| 300 | -560 | -70 | 490 | -280 | 0.0144 | 0.0114 | 0.791667 | 0.000831 |
Table text extracted from the original PDF; superscript letters are shown inline. The original table image is below.
View original table image
| Conc. of ligand Or complex µg/ml | Bacillus subtilis | — | — | — | — | — | — | — | Escherichia coli | — | — | — | — | — | — | — |
|---|---|---|---|---|---|---|---|---|---|---|---|---|---|---|---|---|
| HMPSP | Cu (II)complex | HMPSP | Cu (II) complex | |||||||||||||
| IZ of S | IZ (MM) | AI | MIC | IZ Of S | IZ | AI | MIC | IZ Of S | IZ (mm) | AI | MIC | IZ Of S | IZ (mm) | AI | MIC | |
| 30 | 22 | 6 | .27 | 30 | 21 | 8 | .38 | 20 | 30 | NA | NA | 40 | 30 | NA | NA | 40 |
| 60 | 9 | .40 | 10 | .47 | 6 | .20 | 7 | .23 | ||||||||
| 90 | 13 | .59 | 19 | .90 | 14 | .46 | 15 | .43 |
Table text extracted from the original PDF; superscript letters are shown inline. The original table image is below.
View original table image
References
25 in the original paper- Mushtaq I, Ahmad M, Saleem M, ed A. Pharmaceutical significance of Schiff bases: an overview. Future J Pharm Sci. 2024;10(16):1-12.
- Thakur S, Jaryal A, Bhalla A. Recent advances in biological and medicinal profile of Schiff bases and their metal complexes: An updated version (20182023). Results Chem. 2024;7:101350.
- Chauhan V, Kumar VK, Tyagi SK, Kumar D, Kumar K. A review: the biological activities of Schiff bases. Int J Sci Res Eng Manag. 2023;7(5):1-9.
- Rezaeianzadeh O, Asghari S, Tajbakhsh M, Khalilpour A, Shityakov S. Synthesis and application of diazenyl sulfonamide-based Schiff bases as potential BRCA2 active inhibitors against MCF-7 breast cancer cell line. Sci Rep. 2025;15:6661.
- Iacopetta D, Catalano A, Ceramella J, Mariconda A, Amato A, Checconi P, et al. Chitosan-based Schiff bases (CSBs) and their metal complexes: promising antimicrobial agents. Molecules. 2025;30(207):1-23.
- Yahya FL, Dawood F, Al-shemary RKR. Synthesis and applications of Schiff bases from some sulfa drugs and their metal complexes: review. Der Pharm Chem. 2022;14(12):18-24.
- Govindaraj V, Mathiazhagan P, Ramanathan S, Elavalagan K, Renganathan R. Synthesis, spectral characterization and biological studies of Co(II) complexes with Schiff bases derived from sulpha drugs. Bull Chem Soc Ethiop. 2025;39(6):1071-82.
- Singh V, Kaushik NK, Singh R. Metallosulpha drugs: synthesis and bioactivity. Asian J Res Chem. 2011;4(3):339-47.
- Tyagi M, Dubey M. A fight against cancer with advancement of Schiff base metal complexes: Future prospects. Oral Oncol Rep. 2025;13:100692.
- Emrayed HF, Amraga EA, Ibrahim DM, Fouda AS. Corrosion inhibition effect of Schiff base and its metal complexes with [Mn(II) and Cu(II)] on carbon steel in hydrochloric acid solution: Experimental and surface studies. Int J Electrochem Sci. 2025;20:100912.
- Kuate M, Conde MA, Mainsah EN, Paboudam AG, Tchieno FM, Ketchemen KIY, et al. Synthesis, characterization, cyclic voltammetry, and biological studies of Co(II), Ni(II), and Cu(II) complexes of a tridentate Schiff base, 1-((E)-(2mercaptophenylimino)methyl)naphthalen-2-ol (H2L1). J Chem. 2020;1-21.
- Abbas SH, Ali Murad DM, Abbas HH. Spectral and cyclic voltammetry studies of chloro-salicyliden aniline and some of its complexes with Co(II) and Mn(II). J Phys Conf Ser. 2020;1660.
- Abayneh A, Gebretsadik T, Tadesse S, Thomas M. Synthesis spectroscopic, structural characterization, International Journal of Advanced Chemistry Research https://www.chemistryjournals.net conductivity and electrochemical studies of a Schiff base ligand and its copper complexes. Adv Chem Eng Sci. 2018;8:241-54.
- Nicolson RS, Shain I. Theory of stationary electrode polarography. Single scan and cyclic methods applied to reversible, irreversible, and kinetic systems. Anal Chem. 1964;36(4):706-23.
- Balouri M, Sadiki M, Ibsouda SK. Methods for in vitro evaluating antimicrobial activity: A review. J Pharm Anal. 2016;2:71-6.
- Joshi K, Mahidab A, Rathod J. Synthesis and characterization of bioactive isoxazole and 1,3,4oxadiazole heterocyclic containing scaffolds. Indian J Chem. 2023;62:237-43.
- Socrates G. Infrared and Raman characteristic group frequencies: Tables and charts. Chichester: Wiley; 2001.
- Drago RS. Physical methods in inorganic chemistry. East-West Press Ltd; 1971.
- Mourya RC, Patel P. Synthesis, magnetic and special studies of some novel metal complexes of Cu(II), Ni(II), Co(II), Zn(II), Nd(III), Th(IV), and UO2(VI) with Schiff bases derived from sulfa drugs, viz., Sulfanilamide/Sulfamerazine and o-vanillin. Spectrosc Lett. 1999;32(2):213-36.
- Abdallah M, Alharbi A, Morad M, Hameed AM, AlJuaid SS, Foadand N, et al. Electrochemical studies and the electrode reaction mechanism of ferrocene and naphthoquinones in micro emulsion medium at GC electrode. Int J Electrochem Sci. 2020;15:6522-48.
- Choudhary P, Sharma A, Varshney AK, Varshney S. Cyclic voltammetric reduction of amino acid ketimine and its Co(II) complex. J Indian Chem Soc. 2017;94(6):613-22.
- Sahli R, Bahri J, Tapsoba I, Boujlel K, Raouafi N. Solvent effects on the electrochemical behavior of TAPD-based redox-responsive probes for cadmium(II). Int J Chem. 2014;1-9.
- Sangtyani R, Rawat J, Verma PS, Varshney AK, Varshney S. Electrochemical behavior of 4acetylbiphenyl semicarbazone and 4-acetylbiphenyl thiosemicarbazone. J Indian Chem Soc. 2011;88:15531560.
- Kuate M, Ngandung EM, Kamga FAN, Paboudam AG, Mariam CA, Pecheu CN, et al. Cobalt (II), Nickel (II) and Copper (II) complexes of tetradentate Schiff base ligands derived from 4-nitro-o-phenylenediamine: synthesis, characterization, cyclic voltammetry and biological studies. Egypt J Chem. 2022;65:477-495.
- Balaee IC, Gupta V, Sharma R, Varshney S. Electrochemical studies of Cu(II) complex of a novel Schiff base derived from sulfa drug. Int J Chem Stud. 2022;10(5):77-85.
Cited by 1
From OpenAlex, OpenCitations and reference lists read by Scinovex
- Design, synthesis of S-alkylated-1,2,4-triazole hybrids: Molecular docking, ADME profiling and MD simulations as antimicrobial agents ↗
Mohamed M. Hammouda, M. Yasser Alsedfy, Mohamed A. Ismail, Alya M. Alotaibi, Amal A. Nassar, Ayman K. El‐Sawaf et al. · Journal of Molecular Structure · 2026
❝ 2