
Research article · 2025 · Full text
International Journal of Agriculture and Food ScienceComparative study on marketing of (Nutrikraft and Eva) poultry feed in Chandauli district of Uttar Pradesh
Volume 7(5) · Pages 315–318 · DOI: 10.33545/2664844x.2025.v7.i5e.418 ↗
Research areasAgricultural Economics and PracticesLivestock and Poultry ManagementAgricultural Systems and Practices
Abstract
Author-writtenPoultry feed is a nutritionally balanced formulation designed to support the optimal growth, health, and productivity of poultry animals such as chickens, ducks, and turkeys. The present study, entitled "Comparative Study on Marketing of Nutrikraft and Eva Poultry Feed in Chandauli District of Uttar Pradesh," was conducted in Dhanapur block, selected purposively within Chandauli district. Villages with a minimum poultry bird-rearing potential of five percent were identified, and ten percent of respondents from these villages were selected through random sampling. The study investigates and compares the marketing mechanisms of Nutrikraft and Eva poultry feeds through two prevalent channels: Channel-I (Producer → Wholesaler → Consumer) and Channel-II (Producer → Wholesaler → Retailer → Consumer). Findings indicate that marketing efficiency varies between channels and products. For Nutrikraft, Channel-I yielded a marketing efficiency of 10.92%, while Channel-II showed 6.04%. For Eva, Channel-I demonstrated a slightly higher efficiency of 11.21%, compared to 6.52% in Channel-II. Differences in consumer prices, marketing margins, and cost structures highlight the relative advantages of shorter marketing channels in improving producer returns and overall efficiency.
Summary
Source-checkedPlain-language reading of the full paper, prepared with AI and checked against the text. Each point links to the authors' own words.
Why it matters
- Poultry feed is critical to the commercial poultry industry because it directly affects the health, productivity, and economic viability of the farms. View evidence ↗
- The quality and formulation of the feed impact the feed conversion ratio (FCR), which is a key factor in determining the profitability of poultry farming. View evidence ↗
- Despite advancements in production, the industry still faces challenges regarding pricing, quality control, and accessibility in remote regions. View evidence ↗
What they did
- The sample included 120 randomly selected respondents across different rearing capacities, along with 10 wholesalers, 5 retailers, 5 farm owners, and 5 consumers. View evidence ↗
- The study compared two marketing channels: Channel-I (Producer to Wholesaler to Consumer) and Channel-II (Producer to Wholesaler to Retailer to Consumer). View evidence ↗
- Data for the study were collected during the 2024-2025 agricultural year. View evidence ↗
What they found
- Channel-II was the preferred purchase route for both brands, chosen by 62.5% of Nutrikraft users and 66.67% of Eva users. View evidence ↗
- In Channel-I, the marketing efficiency was 10.92% for Nutrikraft and 11.21% for Eva poultry feed. View evidence ↗
- Channel-II showed lower marketing efficiency than Channel-I, with rates of 6.04% for Nutrikraft and 6.52% for Eva. View evidence ↗
- The price spread in Channel-II was higher than in Channel-I, reaching ₹206 for Nutrikraft and ₹198 for Eva. View evidence ↗
- The price spread in Channel-I was significantly lower, at ₹114 for Nutrikraft and ₹115 for Eva. View evidence ↗
What it means
- The authors concluded that Channel-I is more cost-efficient for both brands than Channel-II. View evidence ↗
- The authors noted that while Channel-II is more profitable for intermediaries, it results in higher costs for the consumers. View evidence ↗
Visual summary
2 visualsIllustrations explain the paper; charts are replotted from the paper's own table values.
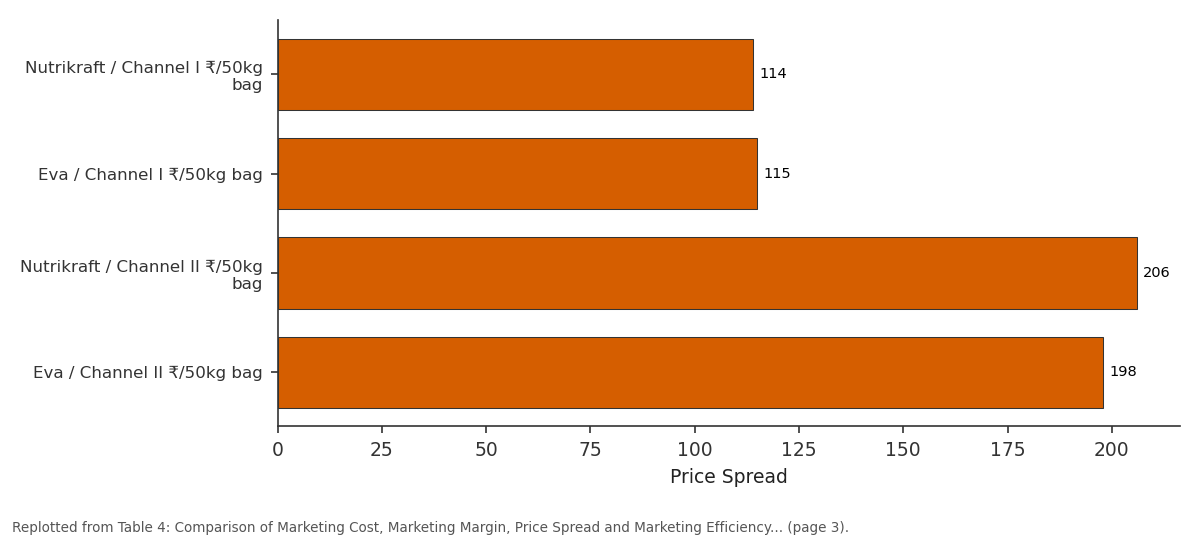
Price Spread: Nutrikraft / Channel I... vs Eva / Channel I ₹/50kg... vs Nutrikraft / Channel II... vs Eva / Channel II ₹/50kg...
Replotted from Table 4 (page 3) of the original paper. Every bar is the paper's own table value.
View source evidence ↗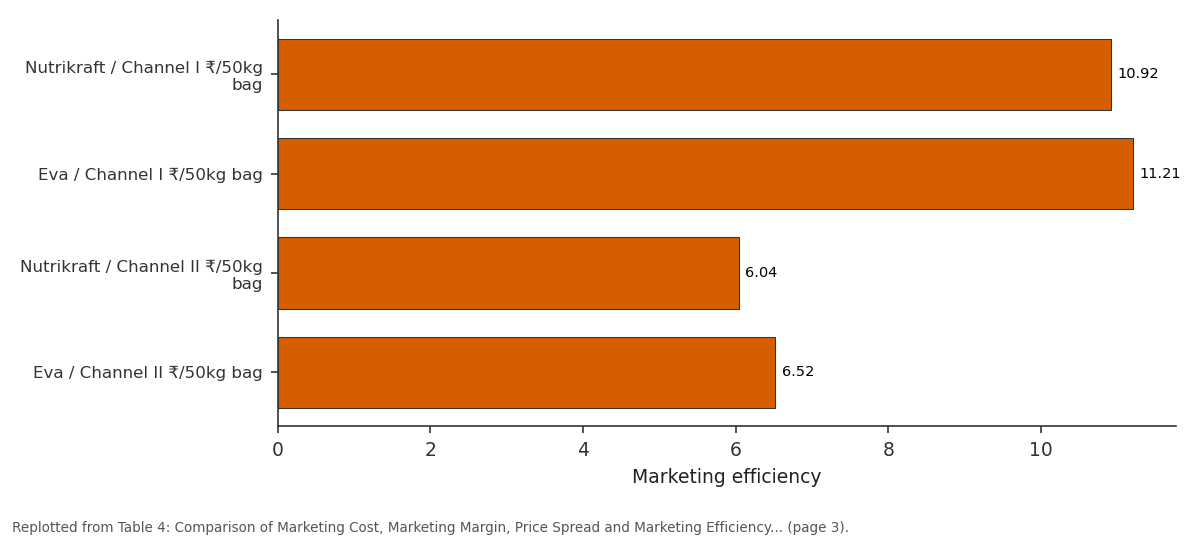
Marketing efficiency: Nutrikraft / Channel I... vs Eva / Channel I ₹/50kg... vs Nutrikraft / Channel II... vs Eva / Channel II ₹/50kg...
Replotted from Table 4 (page 3) of the original paper. Every bar is the paper's own table value.
View source evidence ↗Figures & tables
From the original paper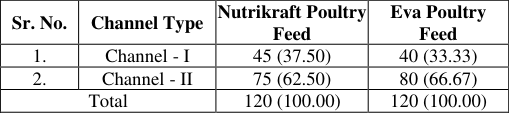 Table 1
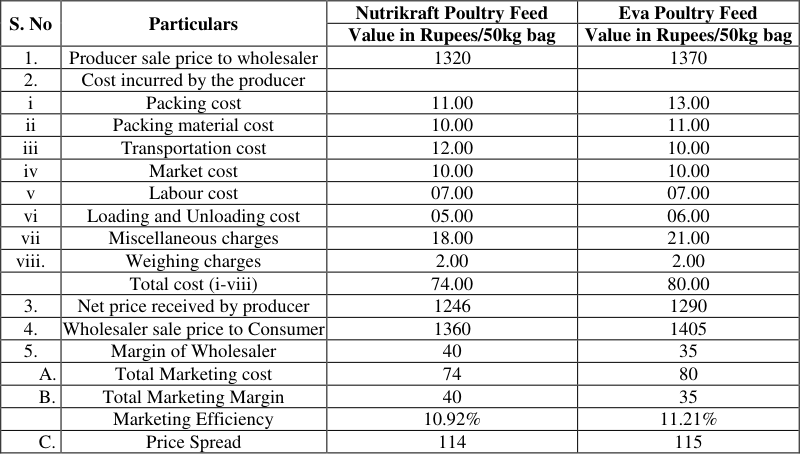 Table 2
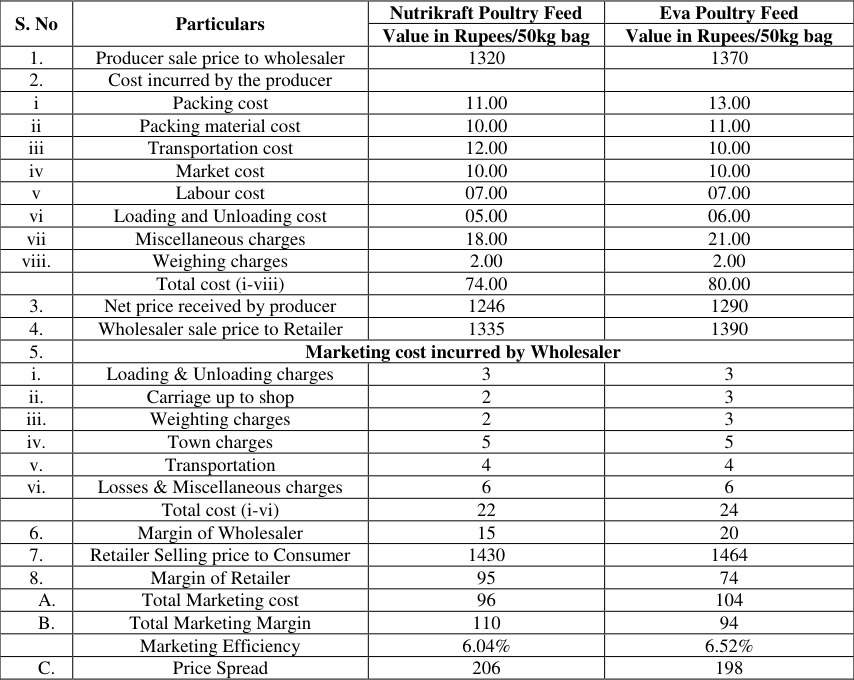 Table 3
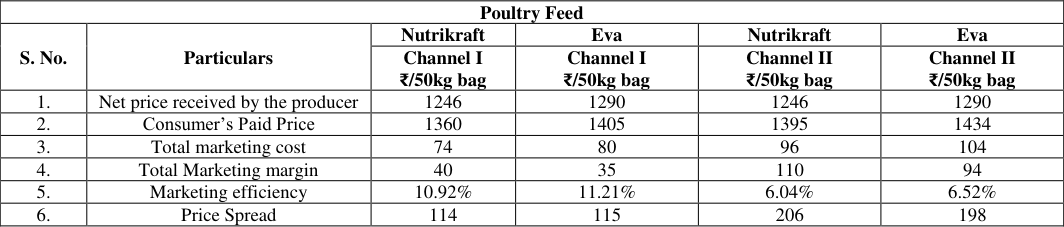 Table 4
Introduction
Poultry feed plays a pivotal role in the commercial poultry industry, as it directly influences the health, productivity, and economic viability of poultry farming. It refers to the specially formulated food provided to poultry birds such as chickens, ducks, turkeys, and other domesticated fowls, with the objective of ensuring optimal growth, weight gain, reproductive efficiency, and egg production. A scientifically balanced poultry feed contains essential nutrients including carbohydrates, proteins, fats, vitamins, minerals, and amino acids, tailored to meet the nutritional requirements of birds at various stages of development-such as starter, grower, and finisher phases. The formulation and quality of feed significantly impact the feed conversion ratio (FCR), which is a critical determinant of profitability in poultry farming. In India, the poultry sector has witnessed rapid expansion, particularly in rural and semi-urban areas, where it serves as a vital source of livelihood and nutritional security. The demand for high-quality, cost-effective feed has increased correspondingly, leading to the emergence of various feed brands and a competitive marketing landscape. Feed manufacturers are now focusing on market penetration, efficient distribution networks, and consumer satisfaction to maintain their position in the market. Despite technological advancements in feed production, challenges persist in terms of quality control, pricing, and accessibility in remote areas. Therefore, understanding the marketing dynamics of different poultry feed brands is essential for enhancing supply chain efficiency and supporting poultry farmers.
Research Methodology:
The present study employed a purposive-cum-random sampling method for the selection of the study area and respondents. The Chandauli district of Uttar Pradesh was selected purposively to minimize logistical challenges and time constraints for the investigator. Within the district, Dhanapur block was chosen based on its high concentration of poultry bird rearers.
A comprehensive list of villages within the selected block was prepared, and five percent of these villages with significant poultry-rearing activity were randomly selected. From these villages, a list of all poultry rearers was compiled and classified into three size categories based on rearing capacity: Small (less than 500 birds), Medium (501-2000 birds), and Large (more than 2000 birds). A total of 120 respondents were then randomly selected using proportionate sampling across these categories. Additionally, to analyze the marketing aspects, 10 wholesalers, 5 retailers, 5 poultry farm owners, and 5 consumers were selected. The study focused on evaluating marketing cost, marketing margin, price spread, and marketing efficiency. Primary data were collected through a well-structured and pre-tested schedule using the survey method via direct personal interviews. Secondary data were sourced from relevant books, journals, official reports, and records maintained at the district and block headquarters. The data collected were analyzed using appropriate statistical tools to derive meaningful insights. The information was gathered during the 2024-2025 Agricultural Year.
Analytical Tools
Analytical Tools
Conclusion
The study highlighted notable differences in the marketing of Nutrikraft and Eva Poultry Feed across two channels in the Chandauli district of Uttar Pradesh. Channel-I was preferred by a smaller proportion of respondents for Nutrikraft Poultry Feed (37.5%), while Channel-II was favored by the majority (62.5%). Conversely, for Eva Poultry Feed, Channel-II was preferred by a larger proportion (66.67%) compared to Channel-I (33.33%). The marketing efficiency was found to be higher in Channel-I for both products, with Nutrikraft at 10.92% and Eva at 11.21%, indicating that Channel-I offered greater cost efficiency. On the other hand, Channel-II exhibited higher price spreads and marketing margins, suggesting higher profitability for intermediaries but at a greater cost to consumers. The findings emphasize the trade-off between marketing efficiency and profitability, with Channel-I being more efficient and Channel-II offering greater margins for the intermediaries. These insights are valuable for stakeholders in the poultry feed industry, providing a better understanding of the dynamics of different marketing channels and assisting in the optimization of marketing strategies for both Nutrikraft and Eva Poultry Feeds in the region.
Figures and tables from the paper
| Sr. No. | Channel Type | Nutrikraft Poultry Feed | Eva Poultry Feed |
|---|---|---|---|
| 1. | Channel - I | 45 (37.50) | 40 (33.33) |
| 2. | Channel - II | 75 (62.50) | 80 (66.67) |
| Total | 120 (100.00) | 120 (100.00) |
Table text extracted from the original PDF; superscript letters are shown inline. The original table image is below.
View original table image
| S. No | Particulars | Nutrikraft Poultry Feed | Eva Poultry Feed |
|---|---|---|---|
| Value in Rupees/50kg bag | Value in Rupees/50kg bag | ||
| 1. | Producer sale price to wholesaler | 1320 | 1370 |
| 2. | Cost incurred by the producer | ||
| i | Packing cost | 11.00 | 13.00 |
| ii | Packing material cost | 10.00 | 11.00 |
| iii | Transportation cost | 12.00 | 10.00 |
| iv | Market cost | 10.00 | 10.00 |
| v | Labour cost | 07.00 | 07.00 |
| vi | Loading and Unloading cost | 05.00 | 06.00 |
| vii | Miscellaneous charges | 18.00 | 21.00 |
| viii. | Weighing charges | 2.00 | 2.00 |
| Total cost (i-viii) | 74.00 | 80.00 | |
| 3. | Net price received by producer | 1246 | 1290 |
| 4. | Wholesaler sale price to Consumer | 1360 | 1405 |
| 5. | Margin of Wholesaler | 40 | 35 |
| A. | Total Marketing cost | 74 | 80 |
| B. | Total Marketing Margin | 40 | 35 |
| Marketing Efficiency | 10.92% | 11.21% | |
| C. | Price Spread | 114 | 115 |
Table text extracted from the original PDF; superscript letters are shown inline. The original table image is below.
View original table image
| S. No | Particulars | Nutrikraft Poultry Feed | Eva Poultry Feed |
|---|---|---|---|
| Value in Rupees/50kg bag | Value in Rupees/50kg bag | ||
| 1. | Producer sale price to wholesaler | 1320 | 1370 |
| 2. | Cost incurred by the producer | ||
| i | Packing cost | 11.00 | 13.00 |
| ii | Packing material cost | 10.00 | 11.00 |
| iii | Transportation cost | 12.00 | 10.00 |
| iv | Market cost | 10.00 | 10.00 |
| v | Labour cost | 07.00 | 07.00 |
| vi | Loading and Unloading cost | 05.00 | 06.00 |
| vii | Miscellaneous charges | 18.00 | 21.00 |
| viii. | Weighing charges | 2.00 | 2.00 |
| Total cost (i-viii) | 74.00 | 80.00 | |
| 3. | Net price received by producer | 1246 | 1290 |
| 4. | Wholesaler sale price to Retailer | 1335 | 1390 |
| 5. | Marketing cost incurred by Wholesaler | ||
| i. | Loading & Unloading charges | 3 | 3 |
| ii. | Carriage up to shop | 2 | 3 |
| iii. | Weighting charges | 2 | 3 |
| iv. | Town charges | 5 | 5 |
| v. | Transportation | 4 | 4 |
| vi. | Losses & Miscellaneous charges | 6 | 6 |
| Total cost (i-vi) | 22 | 24 | |
| 6. | Margin of Wholesaler | 15 | 20 |
| 7. | Retailer Selling price to Consumer | 1430 | 1464 |
| 8. | Margin of Retailer | 95 | 74 |
| A. | Total Marketing cost | 96 | 104 |
| B. | Total Marketing Margin | 110 | 94 |
| Marketing Efficiency | 6.04% | 6.52% | |
| C. | Price Spread | 206 | 198 |
Table text extracted from the original PDF; superscript letters are shown inline. The original table image is below.
View original table image
| Poultry Feed | — | — | — | — | — |
|---|---|---|---|---|---|
| S. No. | Particulars | Nutrikraft | Eva | Nutrikraft | Eva |
| Channel I ₹/50kg bag | Channel I ₹/50kg bag | Channel II ₹/50kg bag | Channel II ₹/50kg bag | ||
| 1. | Net price received by the producer | 1246 | 1290 | 1246 | 1290 |
| 2. | Consumer’s Paid Price | 1360 | 1405 | 1395 | 1434 |
| 3. | Total marketing cost | 74 | 80 | 96 | 104 |
| 4. | Total Marketing margin | 40 | 35 | 110 | 94 |
| 5. | Marketing efficiency | 10.92% | 11.21% | 6.04% | 6.52% |
| 6. | Price Spread | 114 | 115 | 206 | 198 |
Table text extracted from the original PDF; superscript letters are shown inline. The original table image is below.
View original table image
References
10 in the original paper- Abadula TA, Jilo SA, Hussein JA, Abadura SZ. Poultry production status, major constraints, and future prospective. J World's Poult Sci. 2022;1(1):22-28.
- Achoja. A study on constraints in marketing of poultry feed in Delta Central Agricultural zone. J Consum Res. 2023;33(12).
- Asrar A, Ahmad I. Marketing strategy of animal feed for laying hens: Case study of PT. Cahaya Mario Brother Group. Indones J Econ Manag Sci. 2023;1:213126.
- Inaniya A. An assessment of marketing channels of poultry products and constraints faced by poultry producers in Udaipur and Ajmer districts of Rajasthan. Int J Curr Microbiol Appl Sci. 2021;10:1712-1717.
- Baliyan BO, Masuku MB. Socio-economic factors as determinants of farm management skills among broiler poultry producers in Botswana. Int J Mark Financ Serv Manag Res. 2017;2(4):109-117.
- Gbigbi TM, Chuks-Okonta VAA. Performance analysis of poultry feed marketers in Delta State, Nigeria. J Agric Econ Dev. 2020;9(1):1-10.
- Singh H, Masih VA. An economic analysis on marketing of Nutrikraft poultry feed in Chandauli District of Uttar Pradesh. Int J Innov Sci Res Technol. 2023;8(7):2590-2594.
- Rahman MM, Rahman MM, Alam MS, Alam MS. Socio-economic status of the farmers and economic analysis of poultry farming at Gazipur district in Bangladesh. Indian Vet J. 2005;82:407-409.
- Firdaus M, Yusuf M, Arsyad M. Profile of the poultry system and the socio-economic impact of native chicken farming in South Sulawesi, Indonesia. Anim Prod Sci. 2023;63:149-157.
- Nikita. Study on supply chain management of poultry feed on Udaipur and Ajmer district of Rajasthan. New Delhi: Oxford and IBH Publishing Co. Pvt. Ltd.; 2021. p.134.