
Research article · 2025 · Full text
International Journal of Advanced Chemistry ResearchEvaluation and comparison study of Sherqat and Tikrit drinking water treatment plants in Salah AL-Din Governorate, Iraq
Volume 7(5) · Pages 32–40 · DOI: 10.33545/26646781.2025.v7.i5a.277 ↗
Research areasWater Quality and Pollution Assessment
Abstract
Author-writtenHuman life in particular and all living things in general depend on water because it is required for many everyday tasks, such as industrial and agricultural operations. In order to compare the quality of water generated by the Tikrit Main Station and the Sherqat Main Station, two significant stations in the Salah al-Din Governorate, Iraq, this study looked at the most crucial physical and chemical traits for evaluating water quality. The raw source water, the station's filtered water, and the domestic network water were the three sources from which each station was assessed. The concentrations of total dissolved solids, turbidity, and total hardness were lower in Sherqat water than in Tikrit, indicating that the water quality in Sherqat was superior to that in Tikrit. Additionally, Tikrit has greater iron concentrations than Sherqat, which can be a sign of contamination and subpar water network conditions. The report suggested improving Tikrit's treatment procedures and making sure that consumer health regulations are followed.
Summary
Source-checkedPlain-language reading of the full paper, prepared with AI and checked against the text. Each point links to the authors' own words.
Why it matters
- Water is essential for all living things and is required for daily activities, including agricultural and industrial operations. View evidence ↗
- Due to global environmental challenges, preserving water quality and ensuring safety for users is critical. View evidence ↗
- The Sherqat and Tikrit water treatment plants in Iraq's Salah al-Din Governorate are designed to provide healthy potable water. View evidence ↗
The question
- The study aims to evaluate the efficiency of the Sherqat and Tikrit drinking water treatment plants during the winter of 2025. View evidence ↗
What they did
- Water quality was assessed at three points for each plant: the raw source water, the filtered water after treatment, and the water in the domestic network. View evidence ↗
- Data were analyzed using SPSS version 20 to calculate means and standard deviations, with t-tests used to identify significant differences at p < 0.05. View evidence ↗
What they found
- Total dissolved solids (TDS) were higher in Tikrit's raw water (256.3 ppm) compared to Sherqat's (238.3 ppm). View evidence ↗
- Chloride levels were significantly higher in Tikrit's raw water (23.23 vs 16.30 ppm) and network water (24.63 vs 19.10 ppm). View evidence ↗
- Alkalinity was significantly higher in Tikrit at all stages: raw (158.2 vs 156.1 ppm), post-filtration (167.1 vs 165.3 ppm), and network (176.9 vs 166.1 ppm). View evidence ↗
- Total hardness was higher in Tikrit across all stages: raw (227.3 vs 208 ppm), post-filtration (225.3 vs 211.2 ppm), and network (226.6 vs 209.5 ppm). View evidence ↗
- Iron concentrations were significantly higher in Tikrit's raw water (0.02 vs 0.01 ppm) and network water (0.02 vs 0.0097 ppm). View evidence ↗
What it means
- The authors conclude that the Sherqat main station is more efficient at water purification than the Tikrit main station. View evidence ↗
- The study recommends regular inspections of the treatment plants and the supply network to maintain acceptable water quality for consumers. View evidence ↗
Visual summary
3 visualsIllustrations explain the paper; charts are replotted from the paper's own table values.
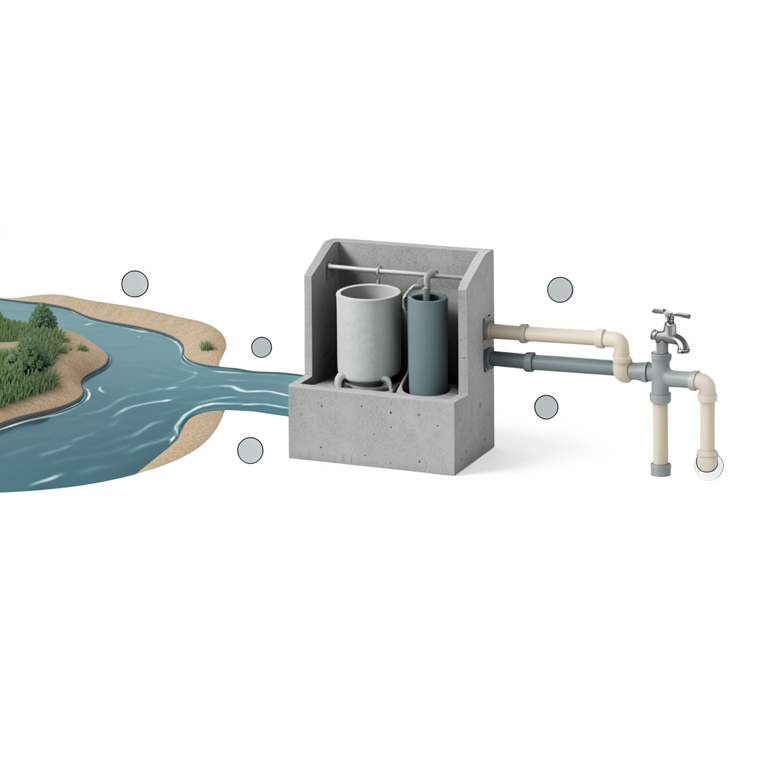
Water Sampling Workflow
AI-generated conceptual illustration (drinking water treatment plant infrastructure). It explains the idea and does not show study data.
View source evidence ↗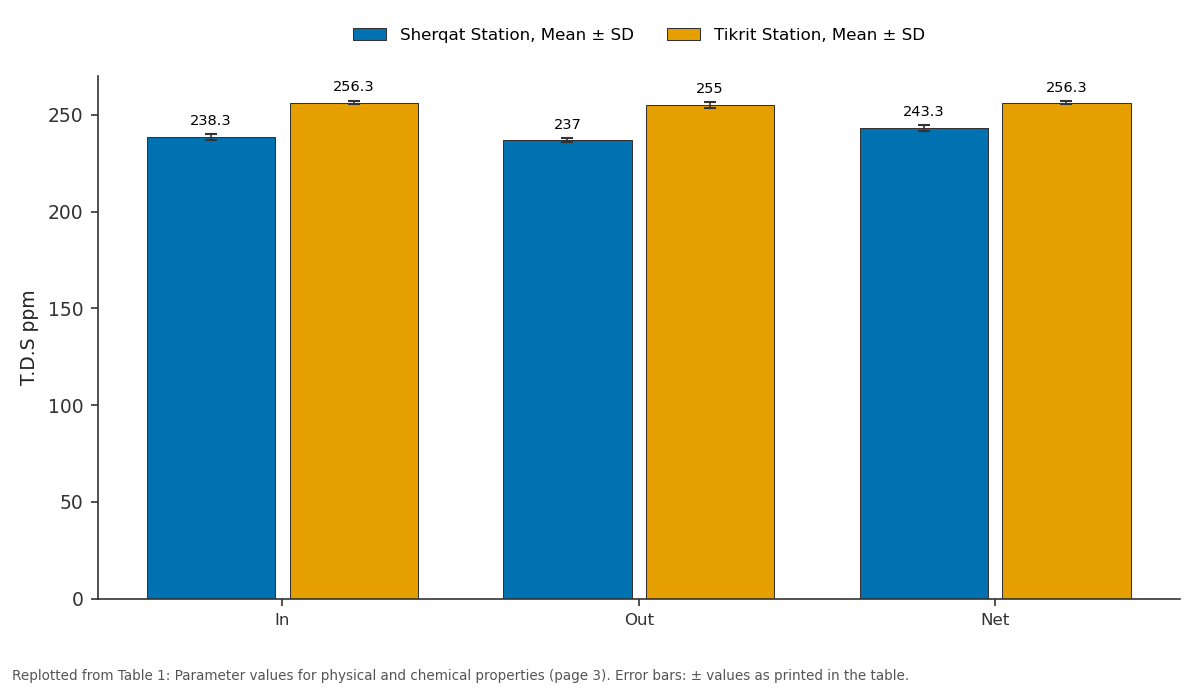
Sherqat Station, Mean ± SD and Tikrit Station, Mean ± SD: In vs Out vs Net
Replotted from Table 1 (page 3) of the original paper. Every bar is the paper's own table value.
View source evidence ↗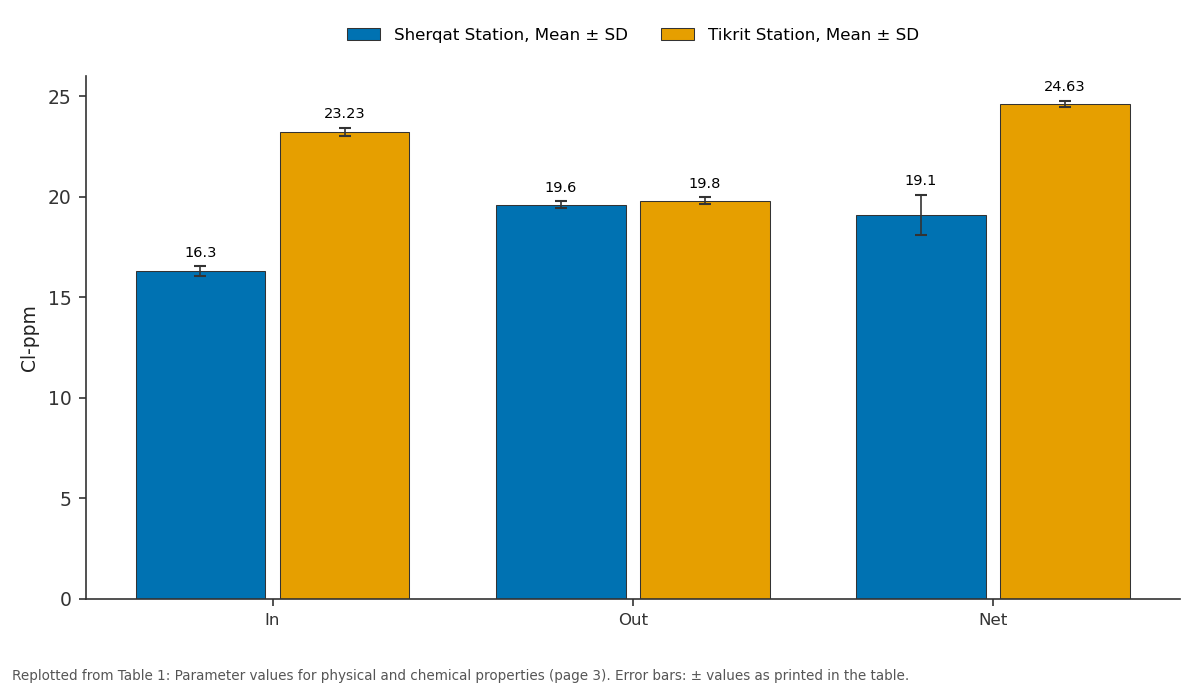
Sherqat Station, Mean ± SD and Tikrit Station, Mean ± SD: In vs Out vs Net
Replotted from Table 1 (page 3) of the original paper. Every bar is the paper's own table value.
View source evidence ↗Figures & tables
From the original paper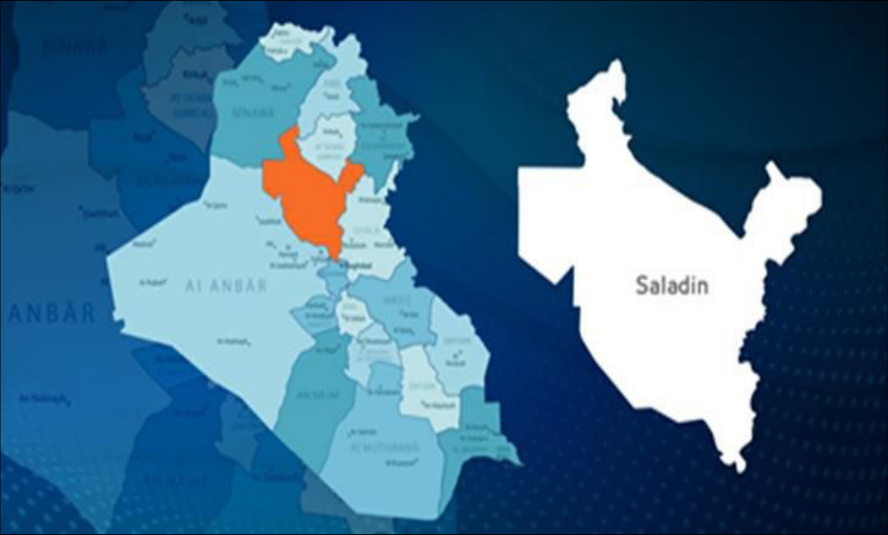 Figure 1
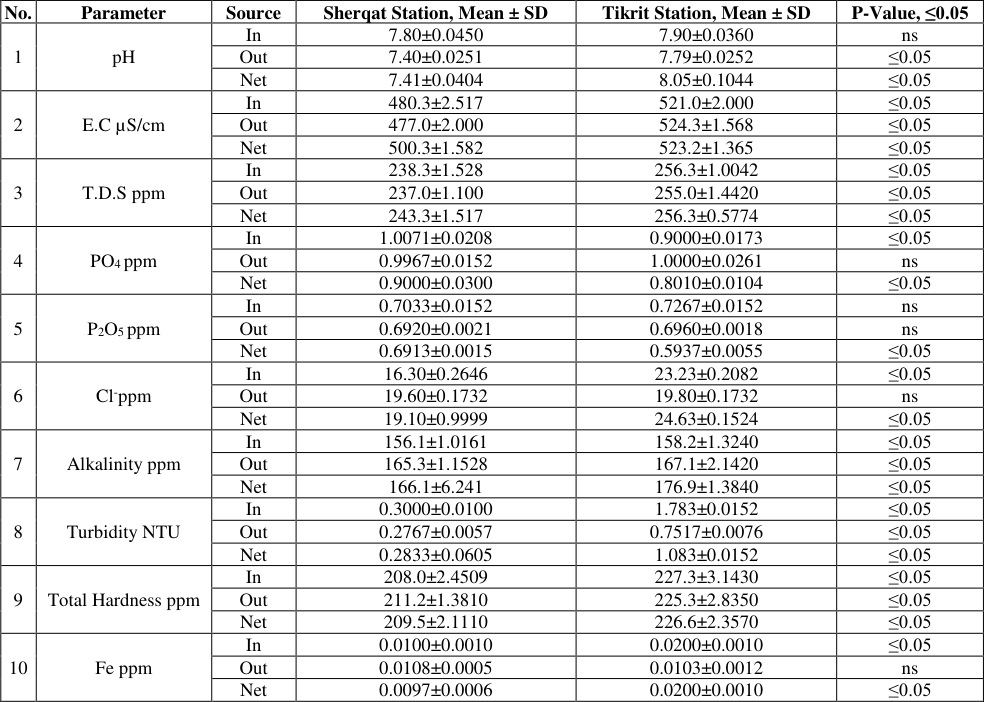 Table 1
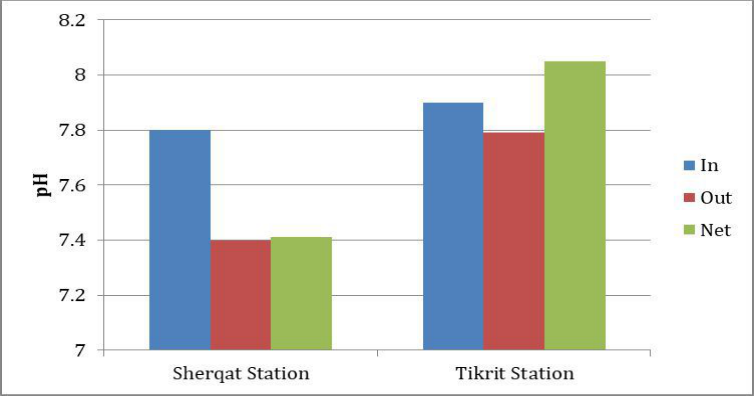 Figure 2
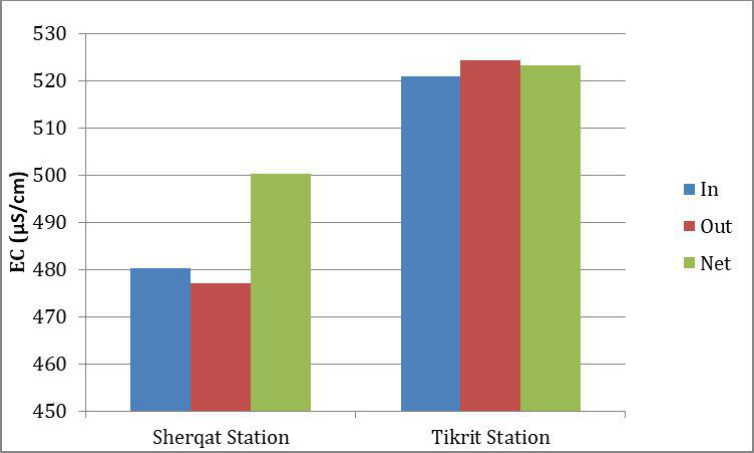 Figure 3
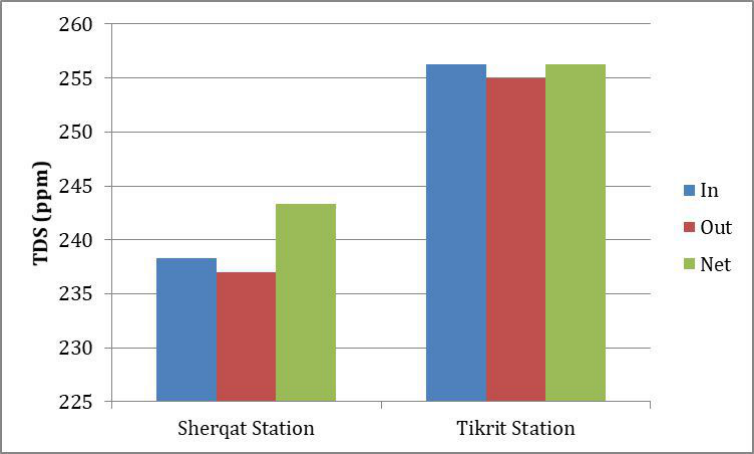 Figure 4
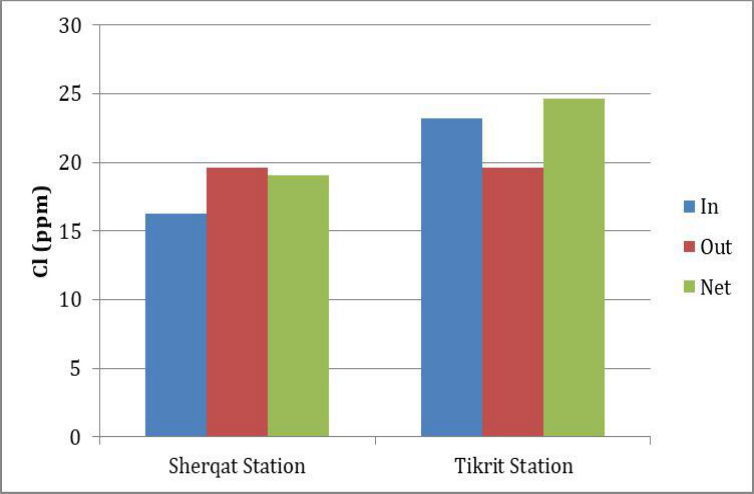 Figure 5
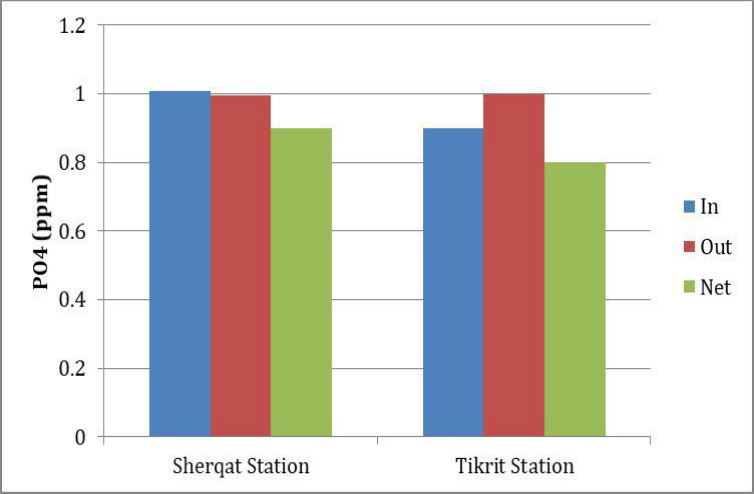 Figure 6
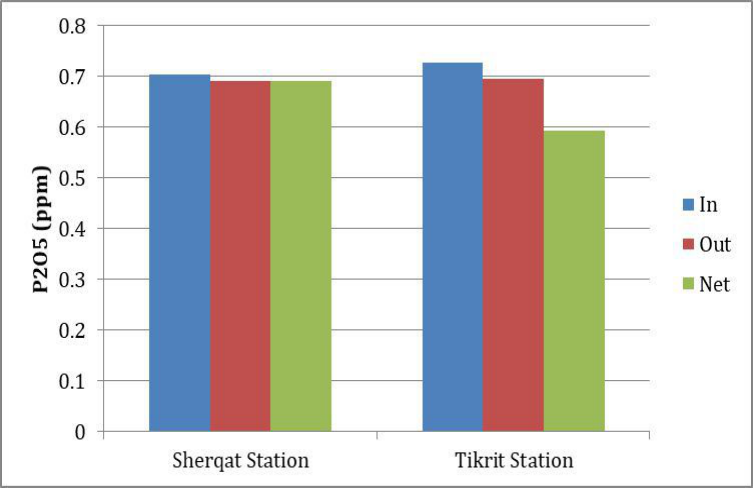 Figure 7
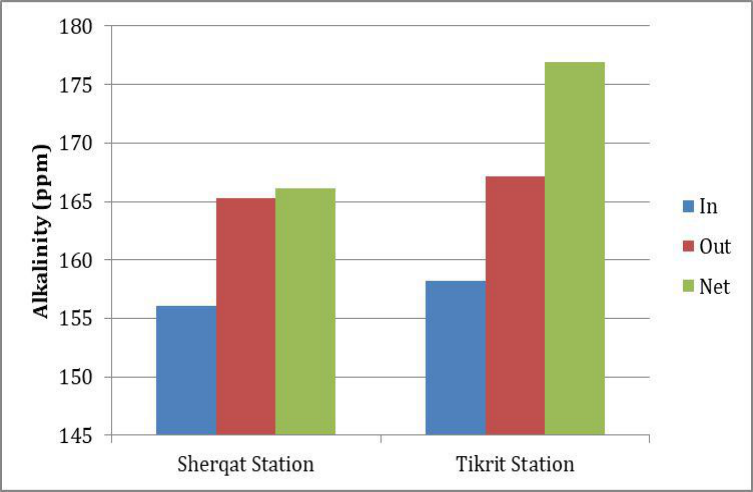 Figure 8
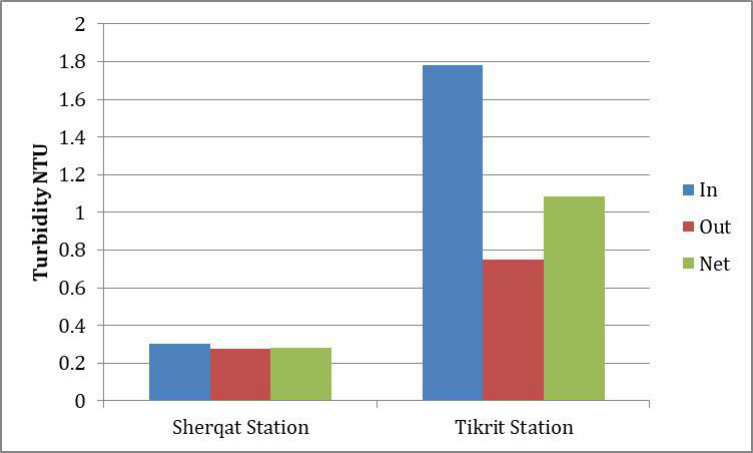 Figure 9
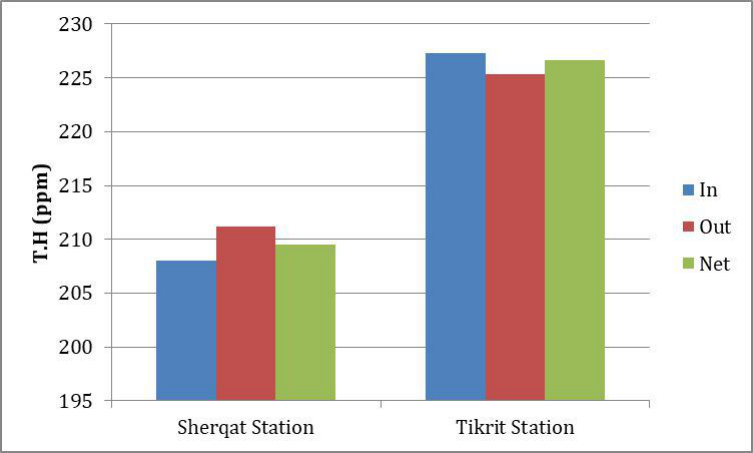 Figure 10
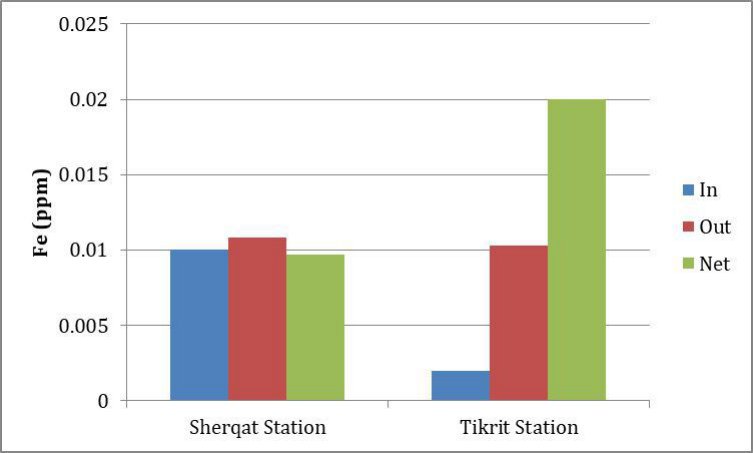 Figure 11
Introduction
Water is considered an essential and irreplaceable component of human life, crucial for several aspects of daily activities, including consumption, sanitation, and diverse industrial and agricultural operations [1] . In light of the increasing worldwide environmental challenges, especially regarding water resources, it is essential to strive for the preservation of water quality and ensure its safety for users. In this context, the importance of various water purification facilities has emerged to ensure the availability of water that is both safe for human use and of high quality. The primary goal of the Sherqat and Tikrit water treatment facilities in the Salah al-Din Governorate of Iraq is to supply potable water that is of a healthy grade. Consequently, the people who live in these two regions of the Salah al-Din Governorate place a high value on these two plants. The primary goal of this study was to evaluate the most crucial chemical characteristics for determining the quality of water, such as pH, which should be between 6.5 and 8.5. This pH value indicates how acidic or alkaline the water is. Apart from its significance for human health, pH can also have an impact on pipes and equipment because acidic water can corrode or destroy pipelines [2] . Attention was also paid to studying a very important indicator for assessing water quality. This indicator is considered a physical one, electrical conductivity. It can be defined as an indicator of the different ionic contents in water, including the various dissolved salts. Electrical conductivity is an important biological indicator for assessing water, as it represents the mineral content of the water [3] . In addition, total dissolved solids levels are an important indicator of the concentrations of all the different dissolved solids in the water, including minerals and salts, and therefore they also have a direct relationship with electrical conductivity [4] .
It's worth noting the importance of studying the level of one variable that is lacking in many water research studies: phosphate ions. This is a major pollutant that directly impacts water quality and is a result of industrial or agricultural waste. Chloride ions are also an important indicator of water quality, and their elevation is an indicator of industrial or sewage pollution [5] . Alkalinity is a measure of the amount of carbonate and bicarbonate salts present in water in their dissolved form and directly affects the acidity of water [6] . Turbidity, which causes visual dispersion of water, is a measure of pollutants and suspended particles in the water [7] . While the total hardness of water is an important and direct indicator of magnesium and calcium salts, these salts affect the quality of water as they affect the reactive processes of washing materials, including soap. In addition, the presence of these salts causes blockage of pipes carrying water or using water in industrial processes [8] . Iron is an important mineral in determining water quality. It is commonly found in various water sources. One of the effects it causes on water quality is a change in the taste and color of the water. It also has long-term harmful health effects due to its cumulative effect when the consumer uses the water for drinking [9] . The main objective of this study is to evaluate the efficiency of the two main drinking water treatment plants in Sherqat and Tikrit in Salah al-Din Governorate, Iraq, during the winter of 2025 AD. This is done by evaluating the most important chemical properties of the water at three locations in each plant, including the source water (before treatment), the resulting water (after treatment), and the local network water when it reaches the consumer. The subsequent chemical and physical parameters constituting water quality indicators were quantified, and samples were examined utilizing a suite of advanced tools and approved methodologies: The pH was assessed utilizing a pH-3310-JENWAY instrument (manufactured in Japan). The alkalinity of the three samples was assessed using this apparatus to guarantee precision. Electrical conductivity (EC) and total dissolved solids (TDS) were quantified utilizing an EC-meter-BC3020 manufactured in Singapore. Turbidity was quantified utilizing a turbidity meter manufactured in Taiwan. Total hardness was assessed on a HACH/DR3900, employing the 10293 Hardness, Ca/Mg methodology. Chloride was quantified via a HACH/DR3900 through the 10291 Chloride TNTplus methodology. Alkalinity was measured with a HACH/DR3900 employing the 10239 Alkalinity TNTplus technique. Iron was quantified utilizing a HACH/DR3900 through the 10306 Iron, HPT251n method (metal preparation set TNT890). Phosphate was quantified utilizing a HACH/DR3900 in accordance with Method 8007 Powder Pillows Persulfate UV Oxidation. P2O5 was quantified with Method 10127 TNTplus. The findings were statistically evaluated with SPSS version 20, and the mean and standard deviation were computed. A t-test was employed to compare two groups. Substantial differences between the two groups were identified at a probability threshold of p<0.05.
Results and Discussion
The results obtained from this study can be illustrated in (Table 1). showing that Tikrit's network water exhibits greater alkalinity. The water in Tikrit may have elevated levels of carbonates and bicarbonates, resulting in increased alkalinity. The results of the current study are consistent with some previous studies on the environmental reality of water treatment plants in the districts of Al-Awja and Al-Zalaya in Salah al-Din Governorate [10] .
| No. | Parameter | Source | Sherqat Station, Mean ± SD | Tikrit Station, Mean ± SD | P-Value, ≤0.05 |
|---|---|---|---|---|---|
| 1 | pH | In | 7.80±0.0450 | 7.90±0.0360 | ns |
| Out | 7.40±0.0251 | 7.79±0.0252 | ≤0.05 | ||
| Net | 7.41±0.0404 | 8.05±0.1044 | ≤0.05 | ||
| 2 | E.C µS/cm | In | 480.3±2.517 | 521.0±2.000 | ≤0.05 |
| Out | 477.0±2.000 | 524.3±1.568 | ≤0.05 | ||
| Net | 500.3±1.582 | 523.2±1.365 | ≤0.05 | ||
| 3 | T.D.S ppm | In | 238.3±1.528 | 256.3±1.0042 | ≤0.05 |
| Out | 237.0±1.100 | 255.0±1.4420 | ≤0.05 | ||
| Net | 243.3±1.517 | 256.3±0.5774 | ≤0.05 | ||
| 4 | PO4 ppm | In | 1.0071±0.0208 | 0.9000±0.0173 | ≤0.05 |
| Out | 0.9967±0.0152 | 1.0000±0.0261 | ns | ||
| Net | 0.9000±0.0300 | 0.8010±0.0104 | ≤0.05 | ||
| 5 | P2O5 ppm | In | 0.7033±0.0152 | 0.7267±0.0152 | ns |
| Out | 0.6920±0.0021 | 0.6960±0.0018 | ns | ||
| Net | 0.6913±0.0015 | 0.5937±0.0055 | ≤0.05 | ||
| 6 | Cl-ppm | In | 16.30±0.2646 | 23.23±0.2082 | ≤0.05 |
| Out | 19.60±0.1732 | 19.80±0.1732 | ns | ||
| Net | 19.10±0.9999 | 24.63±0.1524 | ≤0.05 | ||
| 7 | Alkalinity ppm | In | 156.1±1.0161 | 158.2±1.3240 | ≤0.05 |
| Out | 165.3±1.1528 | 167.1±2.1420 | ≤0.05 | ||
| Net | 166.1±6.241 | 176.9±1.3840 | ≤0.05 | ||
| 8 | Turbidity NTU | In | 0.3000±0.0100 | 1.783±0.0152 | ≤0.05 |
| Out | 0.2767±0.0057 | 0.7517±0.0076 | ≤0.05 | ||
| Net | 0.2833±0.0605 | 1.083±0.0152 | ≤0.05 | ||
| 9 | Total Hardness ppm | In | 208.0±2.4509 | 227.3±3.1430 | ≤0.05 |
| Out | 211.2±1.3810 | 225.3±2.8350 | ≤0.05 | ||
| Net | 209.5±2.1110 | 226.6±2.3570 | ≤0.05 | ||
| 10 | Fe ppm | In | 0.0100±0.0010 | 0.0200±0.0010 | ≤0.05 |
| Out | 0.0108±0.0005 | 0.0103±0.0012 | ns | ||
| Net | 0.0097±0.0006 | 0.0200±0.0010 | ≤0.05 |
Table text extracted from the original PDF; superscript letters are shown inline. The original table image is below.
View original table image
Fig 2:
pH values for the studied water models
Electrical Conductivity (EC)
The results demonstrated a statistically significant difference at p≤0.05 for all examined cases. The maximum conductivity of incoming water (raw water) was observed at 521 µS/cm at the Tikrit station, in contrast to 480.3 µS/cm in the Sherqat station. The conductivity of the effluent water post-filtration was higher in Tikrit at 524.3 than in Sherqat, which recorded 477. The conductivity of network water was 523.2 in Tikrit, compared to 500.3 in Sherqat, as illustrated in Table (1) and Figure (3), indicating that the filtration operations had minimal impact on conductivity. The disparity in conductivity persists between the two locations, with Tikrit exhibiting higher levels. Electrical conductivity indicates the concentration of dissolved salts in water, suggesting that Tikrit water has a higher content of salts, b including chlorides, sulfates, and sodium. Moreover, it may suggest that the Tikrit water supply is more contaminated than the Sherqat water source [11] . The results of the current study are consistent with some previous studies, Environmental and microbiological study solutions to evaluate the drinking water purification plant for the city of Al-Dur, Salah Al-Din [12] . But it differs from the results of the study conducted by Darwish and others about Evaluation of the water quality of the Tigris River using diatom communities between Aziziyah and Kut/Iraq [13] .
Fig 3:
EC values for the studied water models
Total Dissolved Salts (TDS)
The results demonstrated a significant difference at p≤0.05 for all examined cases. The maximum concentration of total dissolved solids was observed in the entering water in Tikrit, at 256.3 ppm, in contrast to 238.3 ppm in Sherqat. The outgoing water exhibited a consistent difference, with a negligible reduction observed at both stations post-filtration, as illustrated in Table 1 and Figure 4. In the instance of the network water, the disparity persisted, with Tikrit maintaining a higher level. The data may suggest an elevation in dissolved salts and minerals in the Tikrit water, mirroring the characteristics of the raw water entering the station. Moreover, the filtration operations may fail to eliminate all dissolved materials, resulting in a persistent disparity between the two stations post-treatment [11] . The results of the current study are consistent with the study conducted by Al-Hamdani and others about a study of the quality of drinking water for some water purification projects and water transport networks within the city of Mosul [14] . But it differs from the results of the study about evaluation of the efficiency of four drinking water treatment plants in Salah al-Din Governorate [15] .
Fig 4:
TDS for the studied water models
Chloride (CL)
The chloride results in raw water exhibited a significant difference at p≤0.05, with the concentration in incoming Tikrit water surpassing that of Sherqat (23.23 vs. 16.30 ppm). However, the post-filtration water from the stations showed comparable concentrations, with no significant difference observed. The network water exhibited a significant difference at p≤0.05, with chloride levels of 24.63 in Tikrit and 19.10 in Sherqat, as illustrated in Table
(1) and Figure (5). The elevated chloride levels in raw water may stem from the flow of industrial or agricultural effluents into nearby sources around Tikrit [16] . The results of the current study are consistent with some previous studies [13] . But it differs from the results of the study on the environmental reality of water treatment plants in the districts of Al-Awja and Al-Zalaya in Salah al-Din Governorate [10] .
Phosphate PO4 and P2O5
Table (1) and Figures (6) and (7) indicate that the values between the two stations are closely aligned at all stages, with some differences being negligible. This suggests that the raw water source exhibits comparable phosphorus concentrations, as both stations derive their water from a shared river source, resulting in analogous phosphorus levels. Phosphorus typically originates from agricultural sources or industrial effluents, hence there may be little changes in these parameters between Sherqat and Tikrit [17] .
Alkalinity
The alkalinity levels in Tikrit were marginally elevated compared to Sherqat, both before to and following filtration, as well as in the network water, suggesting that Tikrit's water had a higher concentration of bicarbonates and carbonates. The measured alkalinity data exhibited a statistically significant difference at p≤0.05 across all stages.
The alkalinity of the incoming water in Tikrit was measured at 158.2 ppm, in contrast to 156.1 ppm in Sherqat. The outgoing water in Tikrit exhibited a concentration of 167.1 ppm, compared to 165.3 ppm in Sherqat. Additionally, the network water in Tikrit was recorded at 176.9 ppm, while Sherqat's was 166.1 ppm, as illustrated in Table (1) and Figure (8). The water in Tikrit may originate from a source rich in carbonate rocks, resulting in the dissolution of increased bicarbonates [6] .
Fig 8:
Alkalinity for the studied water models
Turbidity
The turbidity data indicated a statistically significant difference at p≤0.05 across all stages. The water at Tikrit station exhibited more turbidity than that of Sherqat (1.78 vs. 0.30 NTU), signifying a higher concentration of suspended particles in Tikrit water. Turbidity in Tikrit postfilter was elevated (0.75) compared to Sherqat (0.27), indicating either reduced filtration efficiency in Tikrit or a higher level of pollution in the incoming water. The turbidity value of the network water was 1.08 in Tikrit compared to 0.28 in Sherqat, as illustrated in Table 1 and Figure 9. This rise is attributable to the prevalence of suspended particulates and contaminants inside the network, coupled with insufficient maintenance and treatment of the system. The elevated turbidity in the raw water of Tikrit may result from heightened human or industrial activity compared to Sherqat, leading to an increase in suspended particulates. The water flow in Tikrit may be more rapid, resulting in heightened sediment disruption and enhanced turbidity. 1) and Figure (10). The elevated hardness of Tikrit water may be attributed to its higher concentrations of magnesium and calcium, derived from the surrounding rocks or soil [18] . The results of the current study are consistent with a statistical analytical study of Tigris River water and drinking water in some locations in Mosul city [19] . But it differs from the results of the study about evaluation of the efficiency of four drinking water treatment plants in Salah al-Din Governorate [15] .
Iron Fe
The water in Tikrit exhibits an elevated iron concentration, demonstrating a statistically significant increase at p≤0.05, with a level of 0.02 ppm, in contrast to 0.01 ppm in Sherqat. Nonetheless, the effluent water post-filtration exhibited no substantial variation, although the iron concentration shown a notable rise at p≤0.05 for the Tikrit network water, measuring 0.02 ppm in contrast to 0.0097 ppm in Sherqat, as illustrated in Table (1) and Figure (11). The pipes or infrastructure in Tikrit may be more prone to corrosion, resulting in elevated iron concentration. The geological disparities between the two regions may account for the varying solubility of iron in the raw water, or the variances in the type and quantity of pollutants discharged into the water in each region [20] . The results of the current study are consistent with A study of the impact of heavy metal pollution on some types of soil in Tikrit city [21] . The water in Tikrit exhibited greater turbidity and elevated levels of salts and dissolved substances, signifying a variation in the water source and its environmental impact.
We conclude from this study that the Sherqat main station was more efficient than the Tikrit main station in water purification. The evaluated indicators were higher in Tikrit than in Sherqat, namely total dissolved solids and electrical conductivity, in addition to hardness, calcium, magnesium, and pH. This directly impacts human water consumption in areas that rely primarily on these two stations. An elevated concentration of iron was also observed in Tikrit's water, which may indicate a deterioration in the water supply network. The study recommends periodic inspections of both stations and the water supply network to ensure that water of acceptable quality is delivered to consumers.
Figures and tables from the paper
References
16 in the original paper- Franjić S. Water is a unique natural resource. J Toxicol Environ Sci. 2024;2(1):67-72.
- Thirumoorthy P, et al. Assessment of groundwater quality in Perundurai region of south India using water quality index and statistical modelling. Grounds Sustain Dev. 2024;25:101104.
- Mahdi AM, Salman SA. Assessment of some heavy metals and study of some physical and chemical characteristics of drinking water in the central water purification station, Samarra city, Iraq. In: AIP Conference Proceedings. AIP Publishing, 2022.
- Patra A K, et al. Effects of the concentration and nature of total dissolved solids in drinking water on feed intake, nutrient digestion, energy balance, methane emission, ruminal fermentation, and blood constituents in different breeds of young goats and hair sheep. Anim Nutr. 2024;16:84-95.
- EDO G I, et al. Impact of environmental pollution from human activities on water, air quality and climate change. Ecol Frontiers. 2024.
- Chen Y, et al. Correlation analysis between pH value of Yingna River with environmental factors and phytoplankton in China based on multivariable statistics analysis. Algal Res. 2025;103991.
- Matos T, et al. A review of methods and instruments to monitor turbidity and suspended sediment concentration. J Water Process Eng. 2024;64:105624.
- Saleem M, Ali M, Saeed A. Preparation of soap and detergents with potential use of biochemical methods. In: Recent Advances in Industrial Biochemistry. Cham: Springer International Publishing, 2024. p. 433-446.
- Majeed AS, et al. Evaluating the effectiveness and risks of bread fortification programs in the Middle Eastern region: A comprehensive review. Front Public Health. 2025;13:1530380.
- Ibrahim MSR. The environmental reality of water treatment plants in Al-Awja and Al-Zalaya districts in Salah Al-Din Governorate [master's thesis]. Tikrit: College of Science, Tikrit University, 2020.
- Jubori ALMAH, Falmn S, Erdeni AA. Evaluation of some chemical properties and heavy metals excreted from Tikrit Teaching Hospital in Saladin Governorate. Egyptian J Aquat Biol Fish. 2024;28(4).
- Aziz ABS. Environmental and microbiological study to evaluate the drinking water purification plant in AlDour city-Salah Al-Din [master's thesis]. Tikrit: College of Education for Girls, Tikrit University, 2015.
- Darwish SF. Evaluation of the water quality of the Tigris River using diatom communities between Aziziyah and Kut [Ph.D. Thesis]. Tikrit: College of Science, Tikrit University, 2017.
- Hamdani ALMR, Fadl MN. A study of the quality of drinking water for some water purification projects and water transport networks within the city of Mosul. Iraqi J Sci. 2015;56(3):2561-73.
- Fartum ZFA. Evaluation of the efficiency of four drinking water treatment plants in Salah al-Din Governorate [Master's Thesis]. Tikrit: College of Science, Tikrit University, 2018.
- Ayeni SS. Impact of different land use types on groundwater quality in Ibadan, Nigeria. Sci Afr. 2024;23:e01994.