
Research article · 2025 · Full text
International Journal of Horticulture and Food ScienceFactors influencing the purchasing decision and constraints involved in consumption of ice cream
Volume 7(5) · Pages 55–57 · DOI: 10.33545/26631067.2025.v7.i5a.297 ↗
Research areasNutrition and Health Studies
Abstract
Author-writtenIndian consumers\r\nare very impulsive in their food habits especially in consuming ice-cream. Ice\r\ncream considered as an indulgence product favored by children and adults in\r\nIndia, with a higher degree of brand loyalty visible among adults. The most\r\nconsumable dairy product is ice cream as it is typically eaten as a snack or\r\ndessert. The present study was carried out to assess the factors influencing\r\nthe purchasing decision and constraints involved in consumption of ice cream in\r\nChennai city. A total sample of\r\n200 consumers of TANUVAS dairy products were selected by a simple random sampling method and a survey\r\nmethod was adopted for the collection of primary data with the help of well-structured\r\nand pre tested interview schedule. revealed that the variables family size,\r\nmonthly family income and presence of children in the family were found to be\r\npositively influencing the consumption of ice cream. The constraint analysis\r\nrevealed that not available in preferred quantity was the major constraint in\r\nconsumption of ice cream followed by unreliable supply, poor packaging and inconvenient\r\nstore timings were the major constraint involved in ice cream consumption. This\r\nstudy opens up new grounds for further research in the area of ice cream\r\nindustry. Further studies can be done to find out implications of other\r\nmarketing concepts in ice cream sector.
Summary
Source-checkedPlain-language reading of the full paper, prepared with AI and checked against the text. Each point links to the authors' own words.
Why it matters
- India is the world's largest milk producer, holding a 20.17% share of total global production. View evidence ↗
- The Indian ice cream market is valued at Rs 3,000 crore, with the unorganized sector accounting for approximately Rs 2,000 crore of that value. View evidence ↗
- In India, ice cream is viewed as an indulgence product popular with both children and adults, though adults show higher brand loyalty. View evidence ↗
The question
- The study aimed to identify the factors that influence purchasing decisions and the constraints associated with ice cream consumption in Chennai city. View evidence ↗
What they did
- A total of 200 consumers were sampled, with 100 individuals selected via simple random sampling from each of the two retail outlets. View evidence ↗
- Primary data was collected using a survey method involving a pre-tested and well-structured interview schedule. View evidence ↗
- A semi-log regression function was used to analyze the relationship between socio-demographic factors and the quantity of ice cream consumed per household per month. View evidence ↗
- Garret's ranking technique was employed to determine the order of importance of constraints faced by urban consumers. View evidence ↗
What they found
- The regression model had a good fit, explaining 66.60% of the variation in ice cream consumption (Adjusted R² = 0.666). View evidence ↗
- Family size positively influenced consumption, where a one-unit change in size altered monthly household consumption by 37.50% from the mean. View evidence ↗
- Monthly family income had a positive effect, increasing consumption by 52.50% from the mean, indicating income elastic demand. View evidence ↗
- The presence of a child in the family was the strongest positive factor, associated with a 111.11% variation in household ice cream consumption. View evidence ↗
- The primary constraint for consumers was the lack of availability in preferred quantities, followed by unreliable supply, poor packaging, and inconvenient store timings. View evidence ↗
- According to the ranking scores, 'Not available in preferred quantity' was ranked first with a score of 77.2. View evidence ↗
What it means
- The authors conclude that there is high demand for ice cream based on taste, freshness, and safety, and that consumers specifically desire more variety in available quantities. View evidence ↗
- The authors suggest that further research is needed to explore the implications of other marketing concepts within the ice cream sector. View evidence ↗
Visual summary
1 visualsIllustrations explain the paper; charts are replotted from the paper's own table values.
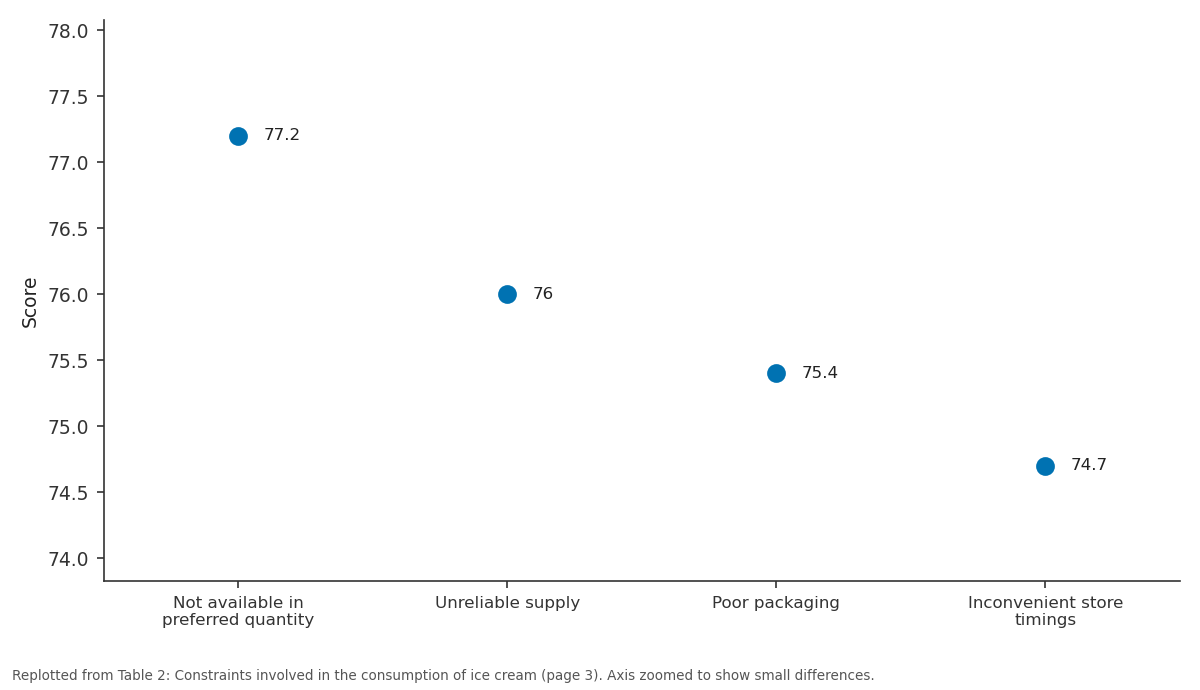
Ice cream / Score: Not available in... vs Unreliable supply vs Poor packaging vs Inconvenient store...
Replotted from Table 2 (page 3) of the original paper. Every bar is the paper's own table value.
View source evidence ↗Figures & tables
From the original paper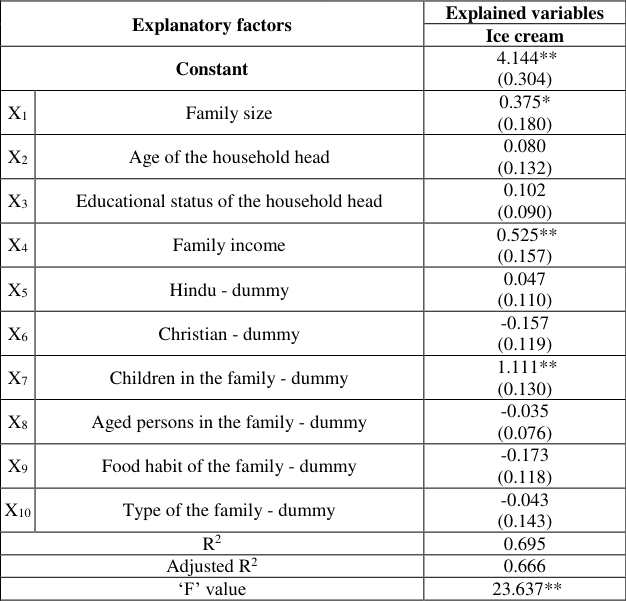 Table 1
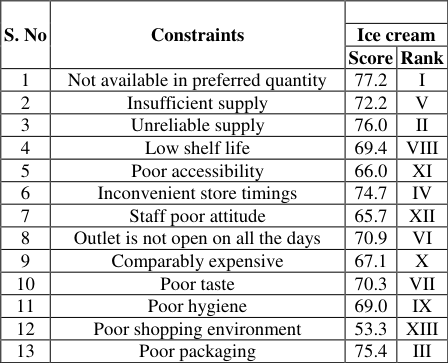 Table 2
Introduction
Dairying in India has come forth as an important sub-sector with an encouraging growth rate of five per cent over the years. It also plays a significant role in changing the social and economic status of people in India by providing a subsidiary source of income. India has emerged as the largest producer of milk with 20.17 percent share in total milk production in the world (Animal Husbandry Policy Note, 2020-21). The milk group forms the bulk of the livestock GVA (Gross Value Added), and its value-output is growing at 13 per cent (Pai, 2020). The total milk production in the country was in steady rise from 1950-51 (17 million tonnes) in the year 1950-51 and it reached 187.7 million tonnes in the year 2018-19 (Basic Animal Husbandry Statistics, 2019). During the post-independence period, the dairy sector showed increase in growth rate (Ashish, 2017) [4] . The main product of the study is ice cream, a most consumable dairy products typically eaten as a snack or dessert. Indian consumers are very impulsive in their food habits especially in consuming ice-cream. Ice cream considered as an indulgence product favored by children and adults in India, with a higher degree of brand loyalty visible among adults. India's current Ice cream market is worth Rs 3,000cr, including the unorganized sector which estimated to be approximately Rs 2000cr. It is expected that this market would grow at a compound annual growth rate (CAGR) of 17% between 2012 and 2017. Although, the unorganized sector enjoys a bigger share in the Indian Ice cream market and has deeper penetration in the rural and semi-rural areas in India. India is the most rapid growing ice cream market globally, with ice cream treats fast becoming a part of Indian culture. Indian consumers are turning into regular patrons of ice cream parlours, helping to fuel greater interest in packaged offerings in the country. According to a new report by Canadean, consumption of ice cream for each person in India was the lowest across major global markets in 2013, but is set to rise fast as consumers come to associate ice cream with fun experiences shared with friends and family. Therefore, it is essential to study the various factors associated with ice cream consumption.
Methodology
For this research work, two retail outlets of Tamil Nadu Veterinary and Animal Sciences University (TANUVAS) in Chennai metro city, the capital of Tamil Nadu was purposively selected viz., one at Madras Veterinary College and other at College of Food and Dairy Technology, Koduvalli were selected for the study. From each outlet, 100 dairy product consumers were selected by a simple random sampling procedure thus yielding a total sample size of 200 dairy products consumers for the study. A survey method was adopted for the collection of primary data from consumers with the help of well-structured and pre tested interview schedule. The interview schedule had the demographic and socioeconomic details of the household consumers as factors for the study and consumer preference for dairy products. The data collected from household consumers were tabulated and analyzed. The tools used for the analysis of the data are presented and discussed below.
Functional analysis
In order to assess the interrelationships between consumption of Ice-cream and the socio-demographic factors, as described by Rani et al. (1999) [2] , Semi-log function was fitted. The functional form was as below:
Garret's Ranking Technique
Garret's ranking technique was adopted to rank the constraints faced by urban consumers in the study area. A list of constraints was given to the consumers to rank it (1 to 13). The constraints are not available in preferred quantity, insufficient supply, unreliable supply, low shelf life, poor accessibility, inconvenient store timings, staff poor attitude, outlet is not open on all the days, comparably expensive, poor taste, poor hygiene, poor shopping environment and poor packaging. The order of merit given by the respondents was converted into ranks (Garret and Woodworth, 1971) [1] .
Percent position =
Where, Rij= Rank given for i th factor by j th individual Nj= Number of factors ranked by j th individual. The percent position of each rank thus obtained was converted into scores by referring to table given by Garret. For each reason, the scores of the individual respondents were added together and divided by the total number of respondents for whom scores were given and thus based on the mean scores, the ranks were given. These mean scores for all the reasons were arranged in descending order and the most important reason for the preference of dairy products was ranked first and the least important reason was ranked as the last.
Results and Discussion
Results and Discussion
Factors influencing the consumption of Ice-cream
In order to examine whether the differences in consumption pattern of Ice-cream could be attributed to variations in the socio-economic factors such as family size, religion, age of the household head, education, income level, presence of aged person, type of family and food habit, a separate semilog regression function was fitted and exhibited in Table 1. The semi-log functional model showed a good fit with the adjusted R 2 of 0.666, indicating that 66.60 per cent of variation in the dependent variable was explained by the independent variables incorporated. The ANOVA also exhibited that the model had a good fit with a significant 'F' value of 23.637. Of the variables used to explain the variation in the consumption of ice cream in Chennai city, family size, monthly family income and presence of children in the family were found to be positively influencing the consumption of ice cream. The results indicated that a unit change in the family size could alter the monthly household consumption of ice cream by 37.50 per cent, from its mean level, ceteris paribus. The monthly family income positively influenced the consumption of ice cream by 52.50 per cent from the mean level, which confirms the income elastic demand for milk products, ceteris paribus. The per cent variation in the household ice cream consumption as a result of having a child in the family was estimated to be 111.11, ceteris paribus. This might be due to the children were highly skewed towards ice cream consumption as the city is hot and humid.
| Explanatory factors | — | Explained variables |
|---|---|---|
| Ice cream | ||
| Constant | 4.144** (0.304) | |
| X1 | Family size | 0.375* (0.180) |
| X2 | Age of the household head | 0.080 (0.132) |
| X3 | Educational status of the household head | 0.102 (0.090) |
| X4 | Family income | 0.525** (0.157) |
| X5 | Hindu - dummy | 0.047 (0.110) |
| X6 | Christian - dummy | -0.157 (0.119) |
| X7 | Children in the family - dummy | 1.111** (0.130) |
| X8 | Aged persons in the family - dummy | -0.035 (0.076) |
| X9 | Food habit of the family - dummy | -0.173 (0.118) |
| X10 | Type of the family - dummy | -0.043 (0.143) |
| R2 | 0.695 | |
| Adjusted R2 | 0.666 | |
| ‘F’ value | 23.637** |
Table text extracted from the original PDF; superscript letters are shown inline. The original table image is below.
View original table image
Constraints involved in consumption of ice cream
The ranks for the constraint involved in consumption of ice cream were collected from the sample household consumers, scores were calculated and compared for their order of importance. Based on the total scores obtained for each constraint, they were ranked and the results are presented in Table 2. The results revealed that not available in preferred quantity was the major constraint in consumption of ice cream followed by unreliable supply, poor packaging and inconvenient store timings were the major constraint involved in ice cream consumption. This indicates that consumers want the product in different quantities and ice cream was in high demand as taste, freshness and safety was major reason for their preference towards ice cream.
| S. No | Constraints | — | — |
|---|---|---|---|
| Ice cream | |||
| Score | Rank | ||
| 1 | Not available in preferred quantity | 77.2 | I |
| 2 | Insufficient supply | 72.2 | V |
| 3 | Unreliable supply | 76.0 | II |
| 4 | Low shelf life | 69.4 | VIII |
| 5 | Poor accessibility | 66.0 | XI |
| 6 | Inconvenient store timings | 74.7 | IV |
| 7 | Staff poor attitude | 65.7 | XII |
| 8 | Outlet is not open on all the days | 70.9 | VI |
| 9 | Comparably expensive | 67.1 | X |
| 10 | Poor taste | 70.3 | VII |
| 11 | Poor hygiene | 69.0 | IX |
| 12 | Poor shopping environment | 53.3 | XIII |
| 13 | Poor packaging | 75.4 | III |
Table text extracted from the original PDF; superscript letters are shown inline. The original table image is below.
View original table image
Conclusion
The paper on factors influencing the purchasing decision and constraints involved in consumption of ice cream revealed that the variables family size, monthly family income and presence of children in the family were found to be positively influencing the consumption of ice cream. The constraint analysis revealed that not available in preferred quantity was the major constraint in consumption of ice cream followed by unreliable supply, poor packaging and inconvenient store timings were the major constraint involved in ice cream consumption. In spite of these limitations this research provides valuable information related to consumer behavior. The behavior of consumers is affected by various factors like price of product, taste, quality and brand image, advertisement, packaging, design etc. This study opens up new grounds for further research in the area of ice cream industry. Further studies can be done to find out implications of other marketing concepts in ice cream sector.
References
5 in the original paper- Garret HE, Woodworth RS. Statistics in Psychology and Education. Bombay: Vakils, Feffer and Simons Pvt. Ltd.; 1969. p. 329.
- Rani D, Selvam S, Safiullah AM, Prabakaran R. Consumption pattern and consumer preference for milk products in Madras city. Indian J Agric Mark. 1999;13(1):36-39.
- Pai TVM. Multiplexed maximization of farmer earnings and national food security strategies based on compositional Agri-GVA trendlines. The Sunday Guardian. 2020 Jun 14-20.
- Ashish. Innovating Institutional support for sustainable production of dairy industry in the changing paradigms. Int J Livest Res. 2017;7(5):50-59.
- Phisolayabutra P. Ice-cream purchasing behavior among people in Bangkok and factors influencing their decision in purchasing. Thammasat University; 2005.