
Research article · 2025 · Full text
International Journal of Advanced Chemistry ResearchCampus groundwater quality index of Akperan Orshi Polytechnic Yandev
Volume 7(5) · Pages 14–20 · DOI: 10.33545/26646781.2025.v7.i5a.274 ↗
Research areasWater Quality and Pollution Assessment
Abstract
Author-writtenTen sources of groundwater of Akperan Orshi Polytechnic, Yandev, Gboko, Benue State, Nigeria, covering 5 boreholes and 5 shallow wells were analysed for 21 physico-chemical parameters and coliforms using standard methods. The data obtained from the analysis were subjected to a two-tailed T-Test and showed no significant difference (p>0.05). The concentrations of the parameters were compared with World Health Organization (WHO) permissible limits. The contamination of iron above the WHO permissible level of 0.30 mg/L was recorded in 7 out of 10 water resources. Manganese was detected in only three shallow wells with SW2 having a value of 0.0972 mg/L above the WHO permissible level of 0.05 mg/L. Lead was detected in only two (2) shallow well water resources with SW2 having a value of 0.0936 mg/L which is above the WHO permissible level of 0.05 mg/L. Only SW2 had an estimated total coliform value of 2 MPN index/100 mL and faecal/them tolerant coliform value of 1 MPN index/100 mL above the WHO limit. SW2 poses a health risk as it is the only water source that is contaminated with Fe, Mn, Pb, total and thermo tolerant coliforms above the WHO permissible levels. SW2 is uncovered and without a stage and wall head, making it liable to seepage of run-off water. The estimated Water Quality Index (WQI) for the borehole water (BH) was 32 and shallow well water (SW) was 48, showing excellent water quality for both, though, based on the values, the quality of BH is better.
Summary
Source-checkedPlain-language reading of the full paper, prepared with AI and checked against the text. Each point links to the authors' own words.
Why it matters
- Safe drinking water is defined by the WHO as water that does not pose a significant health risk over a lifetime of consumption. View evidence ↗
- Most water-related health issues stem from microbial or chemical contamination. View evidence ↗
- Monitoring water quality in rural areas is necessary to identify supply quality and encourage government intervention. View evidence ↗
The question
- The study aimed to analyze 21 physico-chemical parameters and coliform levels in ten groundwater sources (5 boreholes and 5 shallow wells) at Akperan Orshi Polytechnic, Yandev. View evidence ↗
What they did
- Water samples were collected from five boreholes and five shallow wells across the Akperan Orshi Polytechnic campus in Nigeria. View evidence ↗
- The analysis utilized both classical and instrumental methods following standard operating procedures. View evidence ↗
- Data analysis involved a T-Test to compare borehole and shallow well means, and the Water Quality Index (WQI) to estimate overall quality. View evidence ↗
What they found
- Manganese was found in three shallow wells, with source SW2 exceeding the WHO limit of 0.05 mg/L at a value of 0.0972 mg/L. View evidence ↗
- Lead was detected in two shallow wells, and source SW2 exceeded the WHO limit of 0.05 mg/L with a value of 0.0936 mg/L. View evidence ↗
- Only source SW2 exceeded WHO limits for coliforms, with total coliforms at 2 MPN index/100 mL and faecal coliforms at 1 MPN index/100 mL. View evidence ↗
- The Water Quality Index (WQI) was 32 for borehole water and 48 for shallow well water, both of which are categorized as excellent quality. View evidence ↗
- A two-tailed T-Test showed no significant difference (p > 0.05) between the analyzed water sources. View evidence ↗
What it means
- The authors conclude that source SW2 poses a health risk because it is the only source where iron, manganese, lead, and coliforms all exceed WHO limits. View evidence ↗
- The authors recommend that water from shallow well SW2 should not be consumed without boiling. View evidence ↗
Visual summary
2 visualsIllustrations explain the paper; charts are replotted from the paper's own table values.
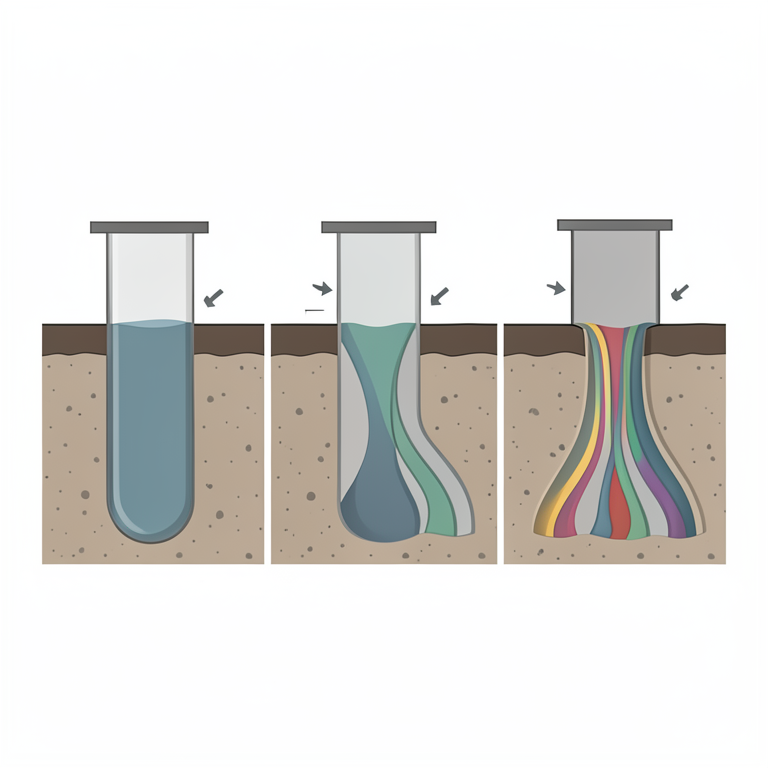
Contamination Profile of SW2
AI-generated conceptual illustration (Groundwater wells in a campus setting). It explains the idea and does not show study data.
View source evidence ↗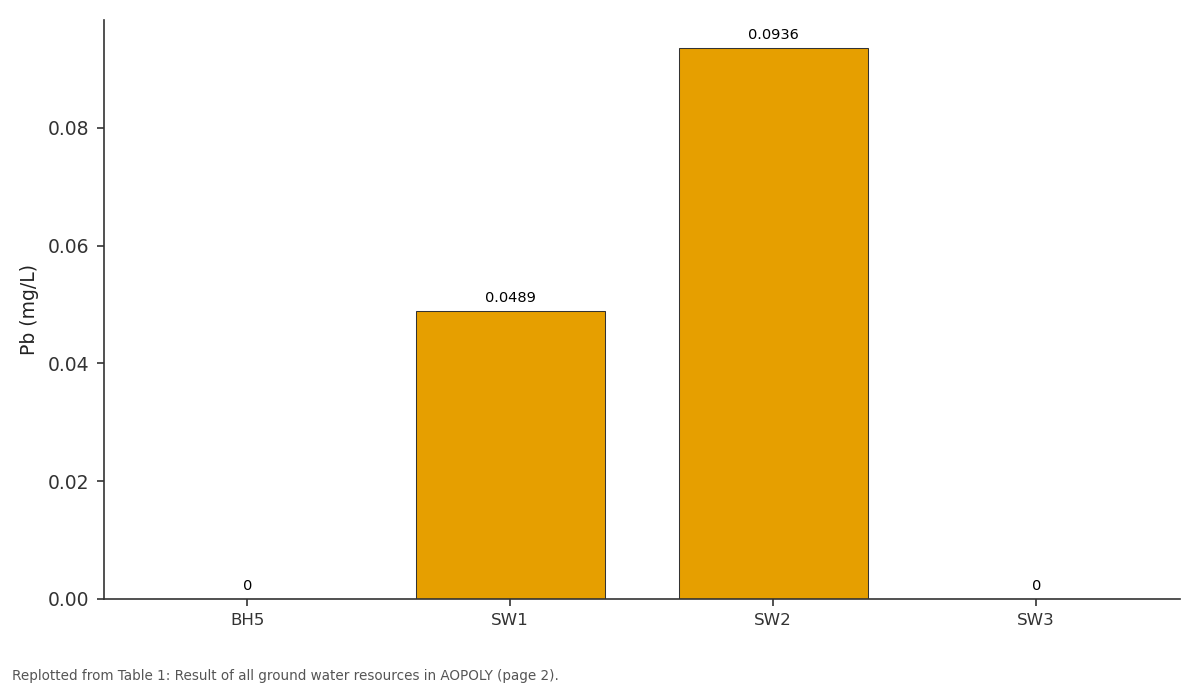
Pb (mg/L): BH5 vs SW1 vs SW2 vs SW3
Replotted from Table 1 (page 2) of the original paper. Every bar is the paper's own table value.
View source evidence ↗Figures & tables
From the original paper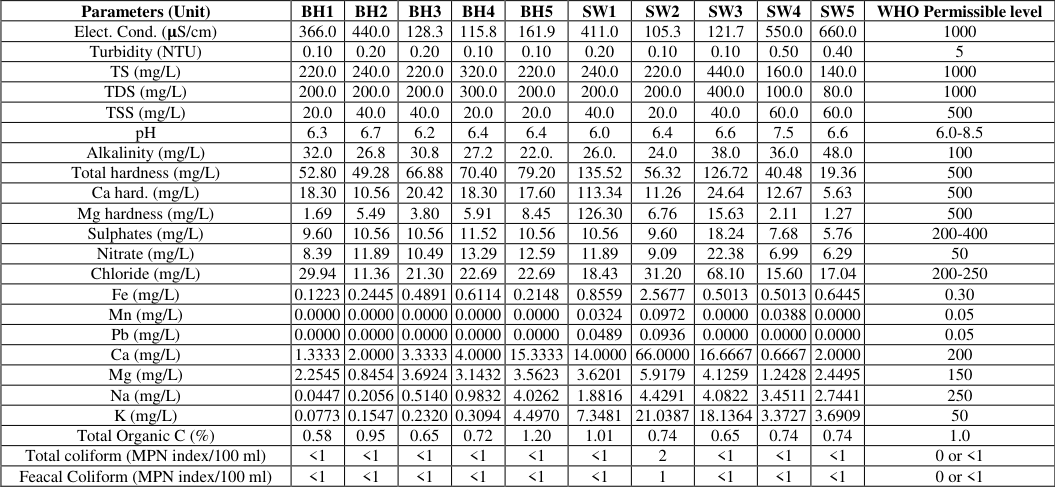 Table 1
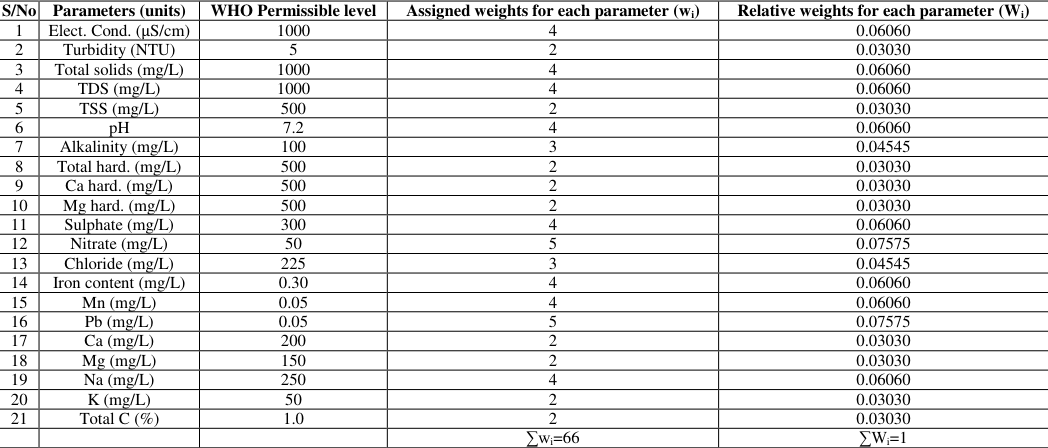 Table 2
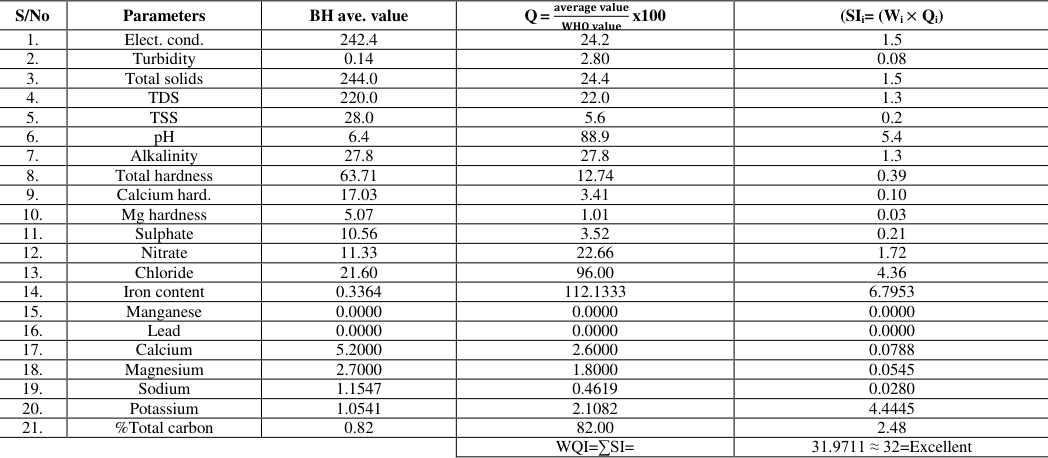 Table 3
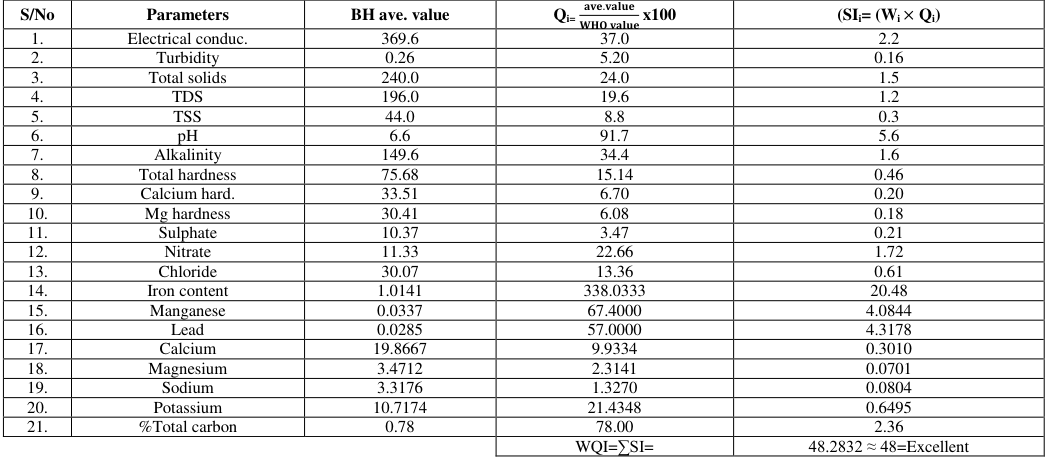 Table 4
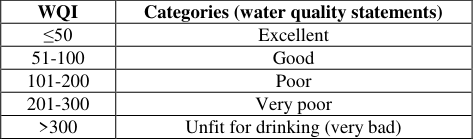 Table 5
Introduction
Water for household consumption should be safe and acceptable. Safe drinking-water, as defined by the Guidelines of World Health Organization, WHO, is water which does not present any significant risk to health over a lifetime of consumption, including different sensitivities that may occur between life stages. Water which is meant for household use must be of good quality. The great majority of evident water-related health problems are as the result of chemical and microbial (bacteriological, viral, protozoan or other biological) contamination. The pathogens that may be transmitted through contaminated drinking-water are diverse (WHO, 2022) [27] . Most chemicals arising in drinking-water are of health concern only after extended exposure for years, rather than months. Significant problems, even crises, can occur, when chemicals posing high health risk are widespread but their presence is unknown; because their long-term health effect is caused by chronic exposure as opposed to acute exposure (WHO, 2023) [28] . The concentration at which constituents are objectionable to consumers is variable and dependent on individual and local factors, including the quality of the water to which the community is accustomed with and a variety of social, environmental and cultural considerations. Guideline values have not been established for constituents influencing water quality which have no direct links to adverse health impacts (WHO, 2022) [27] . Providing safe drinking water is one of the most complex challenges facing African rural communities. Increased human activities (urbanization, industrialization, agriculture, open grazing and domestic activities have not only rendered most water bodies (streams, lakes, rivers, ponds, dams, open wells and canals) unfit for domestic purposes, but breeding ground for most deadly pathogens. As a result of industrialization and urbanization, people migrate to townships and the populations in these cities become too high; so is the need for water.
It is pertinent to observe that there are several human activities, which have indirect and devastating effects on ground water quality. Such activities include accidental or unauthorized release of chemical substances; discharge of untreated effluents, leaching of noxious liquids from solid waste deposits, surface runoff, discharge of untreated sewage, operation of un-authorized dumpsite from people around the area. These pollutants or contaminants are carried by water and water moves easily (percolates) through the soil and underlying rocks. Percolation occurs particularly where the soil is sandy, consists of gravels, or is porous like limestone bedrock (Wuave, 2024) [29] . Government of most countries of the world, claim to provide water for her populace. But where portable water supply is provided, the supplies are unreliable and insufficient; forcing residence to reverse to traditional and contaminated water sources. It is therefore imperative to monitor the physico-chemical and microbial quality of water supply in rural areas in other to highlight the quality of water supply and to provide the impetus for sustained government intervention (Essamlali, Nhaila & El Khaili, 2024) [15] . Water from all boreholes and wells for human consumption ought to meet the standards laid down by World Health Organization for drinking water to make the water potable. Improving access to safe drinking-water can result in tangible benefits to health. According to American Water Works Association, (AWWA), the quality of water is determined according to its physical, chemical and biological parameters (AWWA, 2013) [6] . Water analysis is therefore very important aspect of water-use culture. Every effort should therefore, be made to achieve a drinking-water quality as safe as practicable and one of the ways of improving access to safe drinking-water is through water analyses.
Materials and Methods
Sample Collection: Ten (10) samples of water consisting of five (5) samples from boreholes and five (5) samples from shallow wells were collected from various locations in Akperan Orshi Polytechnic, Yandev, Gboko, Benue State, Nigeria, following standard procedures.
Methods of Analysis
Water samples collected were analysed by both classical and instrumental methods prescribed by standard methods for the analysis of water, following Standard Operating Procedures (SOPs). Electrical conductivity was determined using a digital conductivity meter, turbidity was determined using a digital turbidity meter, TOTAL SOLIDS (TS) was determined using gravimetric analysis, Total Dissolved Solids (TDS) was determined using gravimetric analysis, pH was determined using a digital pH meter which was determined at the point of sampling because pH changes or fluctuates with time, alkalinity was measured using titremetry, total hardness was measured using titremetry, calcium hardness was measured using titration and magnesium hardness was measured using titration. Sulphate was determined by back titration method with magnesium chloride using Eriochrome Black T indicator, nitrate was determined by the phenoldisulphonic acid method, chloride content was determined by Mohr's or Argentometric method (precipitation).
Metals were determined through instrumental methods using Atomic Absorption Spectrophotometer (AAS). The metals determined here are classified into three groups. These include; heavy metals, alkaline earth metals and alkali metals. Wet-oxidation method called Walkey-Black method was used for this analysis. The method is not suitable for the determination of volatile organic constituents (International Organization for Standardization, 2023; APHA, 2022; APHA-AWWA-WEF, 1999) [5] . The analysis covered total and thermotolerant coliform (most often called faecal coliform). Coliform bacteria and was determined using Most Probable Number (MPN) method (APHA-AWWA-WEF, 1999) [5] .
Data analysis
The data was analysed using T-Test; comparing the mean values of borehole water resources with shallow well water resources. The overall water quality was estimated using Water Quality Index (WQI).
Results
Results
Discussion of Result
The results of the analysis were compared with the World Health Organization (WHO) permissible limits, highlighting potential health implications.
Electrical Conductivity
The levels electrical conductivity for all the water samples was below WHO permissible level of 1000 µS/cm. The average electrical conductivity in shallow well water with calculated to be 369.6 µS/cm was higher than the average of borehole water with a value of 242. [22] .
Turbidity
The values for turbidity for all samples were below WHO permissible level of 5 NTU. SW4 recorded the highest value of 0.50 NTU. The average value for shallow well water resources with the value of 0.26 NTU was higher than the average value for borehole water resources with the value of 0.14 NTU. Low values of turbidity have been reported in groundwater in Gboko, Benue State. Low values of turbidity can only be observed in properly built or protected wells or wells which receive seepage of runoff water (Chukwu, Chime, Okoro Ahmadu, 2022) [11] .
Solids in water
All the values for TS, TDS and TSS were all below the WHO permissible level of 1000 mg/L, 1000 mg/L and 500 mg/L respectively. The trend here showed TS>TDS>TSS. The average values were generally higher in shallow well water resources than the borehole water resources. Shallow well water resources has the following average values of 240.0 mg/L and 196.0 mg/L for TS and TDS which were lower than the average values for borehole water resources of 244.0 mg/L and 220.0 mg/L for TS and TDS though, the average value for TSS in shallow well water resources 44.0 mg/L was higher in value than the average value of TSS in borehole water resources with an average value of 28.0 mg/L. Low values of solids have been reported in groundwater in Gboko, Benue State (Okoye & Nyietagher, 2009) [22] . The general low values of total solids in water correlated with low values of electrical conductivity as low amount of dissolved solids results in low conductivity (Ovem, Ovem & Ezeweali, 2014) [24] .
pH Levels
The pH levels were all within the WHO range of 6.0-8.5.
The average value for shallow water resources of 6.6 was higher than that of borehole water resources which was 6.4.
The low average pH values of the water resources are consistent with published studies, which indicate that the pH of ground waters in Nigeria were predominantly acidic. If pH values are higher than the permissible limit, the water is hard. Hard water is not harmful for consumption but wastes soap. Reported values include: an average of 6.00 to 6.45 in Gboko (Akertyo, Onah, Adimanyi & Nyajo, 2024) [2] , 4.3 to 7.8 in Lagos, 4.8 to 5.1 in Onitsha, average of 5.5 in Benin and 5.5 to 7.2 in Akure; this signifies soft water (Okoye & Nyietagher, 2009) [22] .
Alkalinity levels
All the values for alkalinity were below the WHO limit of 100 mg/L. For all the water resources, the range was 22.0 mg/L for BH3 to 48.0 mg/L for SW5. The calculated average value of alkalinity was higher in shallow well water resources (34. [13] . [22,20] .
Hardness levels
Hardness levels
Sulphate levels
The sulphate levels for all the water samples were far below the WHO permissible range of 200-400 mg/L. The average value sulphate in borehole water resources was estimated to be 10.56 mg/L which was slightly than the estimated average value of sulphate in shallow well water resources which was 10.37 mg/L. The major physiological effects resulting from the ingestion of large quantities of sulphate are catharsis, dehydration, and gastrointestinal irritation. Water containing magnesium sulphate at levels above 600 mg/L acts as a purgative in humans. The presence of sulphate in drinking water can also result in a noticeable bitter taste; the lowest taste threshold concentration for sulphate is approximately 250 mg/L, as the sodium salt. Sulphate may contribute to the corrosion of water-based distribution systems. Low values of sulphate have been reported in groundwater in Benue State (Edaba, 2023) [12] .
Nitrates Levels
The concentration of nitrates for all samples of water analysed were below the WHO permissible level of 50 mg/L. The values ranged from 6.29 mg/L for SW5 to 22.38 mg/L for SW3 showing a wide range of values across the shallow well water resources compared to the range in borehole water resources which is 8.39 mg/L to 13.29 mg/L. The average value of nitrates in the two sources of water resources was 11.33 mg/L; same in value. Nitrates change to nitrite in the body, which reduces oxygen uptake by hemoglobin. Nitrate in drinking water has long been considered a health threat for its ability to induce methemoglobinemia ('blue-baby syndrome') especially in bottle-fed infants (Levine, 2023) [18] and this health outcome is the basis of the Environmental Protection Agency's maximum contaminant level. It is also responsible for cyanosis and asphyxia in infants under three (3) months.
Groundwater that is not properly protected, underlying agricultural uses often has elevated nitrate levels due to runoff of nitrogen fertilizers. Intake of nitrate from drinking water and dietary sources may cause increased exposure to Nitroso compounds through endogenous nitrosation.
Pregnant women who drink nitrate contaminated water may be at risk of having spontaneous abortions or giving births to infants with congenital malformations especially, of the central nervous system. High concentrations have also been cited as a risk factor in developing gastric and intestinal cancer. Low Nitrate values have been reported in groundwater in Gboko, Benue State (Omonona & Okogbue, 2021) [23] . Exposure to nitrates in drinking water at concentration levels below the maximum contaminant level of nitrate is not only associated with pancreatic cancer as thought but, pose a risk in pregnant women (Omonona & Okogbue, 2021) [23] .
Chloride Levels
The chloride levels were far below the WHO permissible range of 200-250 mg/L in drinking water. For shallow wells, the range of values was 17.04 mg/L for SW1 to 68.10 mg/L for SW3 while the range of value for borehole water was 11.36 mg/L for BH2 to 29.94 mg/L for BH1. The least value for chlorides was 11.36 mg/L for BH2 while the highest value was 68.10 mg/L for SW3. The average value of shallow well water resources which is 30.07 mg/L was higher than the average value for borehole water resources which is 21.60 mg/L. There is no known evidence that chlorides constitute any human health hazard. For this reason, chlorides are generally limited to 250 mg/L in supplies intended for public use because beyond such concentration, they impart taste. However, when concentration of free chlorine in water after chlorination is above the guideline value of 250 mg/L, it could result in irritation of the esophagus, a burning sensation in the mouth and throat, and spontaneous vomiting (WHO, 2022) [27] . Low chloride values have been reported in groundwater in Benue State (Ohiaba, Idakwoji, Umar, David, Idenyi, Imarhiagbe & Egbunu, 2023) [21] .
Iron (Fe) Levels
The concentration of iron was found to be relatively higher in swallow wells than in borehole water with the average value for borehole being 0.3346 mg/L and shallow wells 1.0141 mg/L where both were above the WHO limit of 0.30 mg/L. SW2 recorded the highest value of 2.5677 mg/L while BH1 recorded the lowest value of 0.1223 mg/L. Elevated iron levels in water can lead to undesirable effects such as a metallic taste, staining of plumbing and laundry, and may promote the growth of iron bacteria, potentially leading to pipe clogging issues (WHO, 2022) [27] . The contamination of iron in water far above the permissible level can impart a metallic taste in the water. The presence of high iron levels in shallow wells can be attributed to natural sources, including rock and soil leaching, or anthropogenic activities such as corrosion from nearby metal structures and waste runoff (Kumar & Ghosh, 2019) [17] . Elevated levels of iron in groundwater have been reported in groundwater in Katsina-Ala, a neighboring town to Gboko in Benue State (Ogbane et al., 2022) [20] .
Manganese (Mn) Levels
Borehole samples do not show any detectable levels of manganese, while shallow wells show the concentrations of 0.0324 mg/L for SW1 and 0.0972 mg/L for SW2, with SW2 exceeding the WHO limit of 0.05 mg/L. Elevated manganese levels in drinking water can imparts water taste, stain plumbing fixtures, and, with prolonged exposure, may lead to neurological issues, particularly in children (WHO, 2022). Low to moderately high values of manganese have been reported in groundwater sources in Benue State (Tsor, Biam, Terver, Amon & Jombo, 2022) [25] . The elevated manganese levels in shallow wells might arise from natural sources such as soil and geological formations, as well as from fertilizers or other agricultural runoff (Ahmad, 2019) [1] .
Lead (Pb) Levels
While lead was not detected in borehole water samples, it was detected in two shallow wells. SWI recorded the lead concentrations of 0.0489 mg/L and SW2, 0.0936 mg/L. The concentration of lead in SW2 was above the WHO permissible level of 0.05 mg/L. The average value of lead for borehole was 0.000 mg/L and 0.0285 mg/L for shallow wells. Long time exposure to lead, even at low level (just above the WHO permissible level), is known to have severe health impacts, including neurotoxic effects, developmental delays in children, and cardiovascular issues in adults (USEPA, 2021) [26] . Other effects of consuming water extremely contaminated by lead are enzyme inhibition, kidney impairment, neurological disorders, tetratogenic effect, and carcinogenic effect (Edeonovo, 2010) [13] . Likely sources of lead contamination in shallow wells include corrosion of lead-containing materials washed into it, runoff from agricultural areas, or polluted soil and sediment or wells dug near dumpsites. Low values of lead have been reported in groundwater sources in Benue State (Tsor et al., 2022) [25] .
Calcium (Ca) Levels
Calcium concentrations in all water samples were well within the WHO limit of 200 mg/L, the values ranged from 1.3333 mg/L (BH1) to 66.0000 mg/L (SW2). The average value calculated was 5.2000 mg/L for BH and 19.8667 mg/L for SW. This shows that the concentration of calcium was higher in shallow well water than in borehole. Moderate concentrations of calcium have been reported in groundwater in Katsina-Ala, Benue State (Ogbane et al., 2022) [20] . Calcium in drinking water is generally beneficial, contributing to good bone health; however, excessive levels can contribute to water hardness, causing scaling in pipes and affecting water-processing appliances. The presence of calcium in water sources is often due to natural dissolution of calcium-bearing minerals in the soil (Okoye & Nyietagher, 2009) [22] .
Magnesium levels ranged from 0.8454 mg/L for BH2 to 5.9179 mg/L for SW2 and all the values were within the WHO permissible level of 150 mg/L. The average value of magnesium in shallow well water which was 3.4712 mg/L was higher than the average value of magnesium in borehole water (2.7000 mg/L). Magnesium in drinking water is beneficial though, it can cause hardness of water Moderate levels of magnesium have been reported in groundwater in Katsina-Ala, Benue State (Ogbane et al., 2022) [20] .
Sodium (Na) Levels
Sodium levels in both borehole and shallow well samples were below the WHO recommended limit of 250 mg/L. Borehole sodium levels range from 0.0447 mg/L to 0.9832 mg/L, while shallow wells show higher but still acceptable levels of 1.8816 mg/L to 4.4291 mg/L. The average value of sodium in shallow well water was 3.3176 mg/L which was higher than the average value of sodium in borehole water with a value of 1.1547 mg/L. Elevated sodium concentrations in drinking water could lead to potential health issues like hypertension by use of such water sources over time (WHO, 2023) [28] . Sodium in groundwater sources is commonly due to geological leaching (Aluko & Odusanya, 2021) [3] . Low values of sodium have been reported in groundwater sources in Benue State (Buba, Ujah & Ibrahim, 2021) [8] .
Potassium (K) Levels
Potassium levels in both borehole and shallow well samples were below the WHO recommended limit of 50 mg/L. Potassium levels were generally low in borehole samples, with values ranging from 0.0773 mg/L to 4.4970 mg/L, while shallow well samples show higher potassium concentrations which ranged from 3.3727 mg/L to 21.0387 mg/L, both still within the permissible limit of 50 mg/L. The average value of potassium in shallow well water which was 10.7174 mg/L was higher than the average value of potassium in borehole water which was 1.0541 mg/L. Although potassium is usually non-toxic at these levels, high concentrations can a pose risk to individuals with kidney disorders (EPA, 2022) [14] . Sources of potassium in water may include natural mineral deposits or anthropogenic influences such as fertilizer application or wastewater discharge from agricultural operations (Chaudhary & Bhardwaj, 2020) [9] . Low values of potassium have been reported in groundwater sources in Benue State (Buba et al., 2021) [8] .
Total organic carbon (TOC)
All samples contain the total organic within the WHO permissible level of 1% except BH5 which the percentage composition was 1.20% and SW1 with a value of 1.01%. The average percentage value of TOC in borehole water was 0.82% which was higher than the average value of TOC in borehole water with a value of 0.78%. Presence of organic matter in water causes decay and their putrefaction causes odour and deprivation of oxygen in water (Nkurumah, 2011) [19] . Moderate levels of total organic carbon has been reported in groundwater sources in Nigeria (Edeonovo, 2010) [13] .
Coliform
The results for total coliform show that most of the water resources analyzed were within WHO permissible level of <1 MPN index/100 mL which is equivalent to 0 CFU/mL (Coliform Forming Unit per milliliter). Only the estimated values of total coliform in SW2 with a value of 2 MPN index/100 mL and feacal coliform in SW2 with a value of 1 MPN index/100 mL were above the WHO permissible level of <1 MPN index/100 mL. The presence of thermo tolerant/faecal coliform populations in the shallow well water SW2 samples is an indicator of poor sanitary conditions, lack of a proper well cover with the cover being in a poor condition, lack of a standing stage, broken well head, and unhygienic handling of solid wastes around the well might have led to contamination of the well with microbial organisms. Microorganisms like Escherichia coli (E. coli) which is the major thermotolorant coliforms or feacal coliforms should not be present in drinking water (Nkurumah, 2011) [19] as it poses health challenges of causing diarrhea. Moderate levels of coliform contamination have been reported in groundwater sources of Gboko locality (Akertyo et al., 2024) [2] and Makurdi, all in Benue State (Ohiaba, Idakwoji, Umar, David, Idenyi, Imarhiagbe & Egbunu, 2023) [21] .
Conclusion
The contamination of iron was above the WHO permissible level of 0.30 mg/L and covered seven (7) water resources, out of ten (10) water resources. Contamination of drinking water with iron does not pose much health risk as it only imparts a metallic taste on the water. The result of manganese shows that though it was detected in only three shallow wells, the value for SW2 recorded at 0.0972 mg/L was above the WHO permissible level of 0.05 mg/L and elevated manganese levels in drinking water can imparts a metallic taste. Lead was detected only in two (2) shallow well water resources; SW1 with a value of 0.0489 mg/L and SW2 with a value of 0.0936 mg/L which is above the WHO permissible level of 0.05 mg/L. prolong consumption of water from SW2 poses the risk of enzyme inhibition, kidney impairment, neurological disorders, tetratogenic effect, and carcinogenic effect. The coliform analysis showed that only one (1) shallow well water resources which is SW2 was contaminated by coliform with a total coliform estimated value of 2 MPN index/100 ml and feacal/themotolerant coliform value of 1 MPN index/100 ml. This shallow well water poses a risk and water from it should not be consumed by humans without boiling. In summary, SW2 poses a health risk as it is the only water source analysed that the contamination of Fe, Mn, Pb, total and feacal/thermotolerant coliforms are all above the WHO permissible levels. Generally, the quality of the water resources based on the analysed parameters was excellent. In conclusion, the quality of both the borehole water resources and the shallow well water resources analysed were generally excellent. The WQI for the borehole water (BH) and shallow well water (SW) were 32 and 48, manning that the water quality were respectively excellent though, the quality of BH is classified as being better because the smaller the WQI value, the better the quality of water.
Figures and tables from the paper
| Parameters (Unit) | BH1 | BH2 | BH3 | BH4 | BH5 | SW1 | SW2 | SW3 | SW4 | SW5 | WHO Permissible level |
|---|---|---|---|---|---|---|---|---|---|---|---|
| Elect. Cond. (𝛍S/cm) | 366.0 | 440.0 | 128.3 | 115.8 | 161.9 | 411.0 | 105.3 | 121.7 | 550.0 | 660.0 | 1000 |
| Turbidity (NTU) | 0.10 | 0.20 | 0.20 | 0.10 | 0.10 | 0.20 | 0.10 | 0.10 | 0.50 | 0.40 | 5 |
| TS (mg/L) | 220.0 | 240.0 | 220.0 | 320.0 | 220.0 | 240.0 | 220.0 | 440.0 | 160.0 | 140.0 | 1000 |
| TDS (mg/L) | 200.0 | 200.0 | 200.0 | 300.0 | 200.0 | 200.0 | 200.0 | 400.0 | 100.0 | 80.0 | 1000 |
| TSS (mg/L) | 20.0 | 40.0 | 40.0 | 20.0 | 20.0 | 40.0 | 20.0 | 40.0 | 60.0 | 60.0 | 500 |
| pH | 6.3 | 6.7 | 6.2 | 6.4 | 6.4 | 6.0 | 6.4 | 6.6 | 7.5 | 6.6 | 6.0-8.5 |
| Alkalinity (mg/L) | 32.0 | 26.8 | 30.8 | 27.2 | 22.0. | 26.0. | 24.0 | 38.0 | 36.0 | 48.0 | 100 |
| Total hardness (mg/L) | 52.80 | 49.28 | 66.88 | 70.40 | 79.20 | 135.52 | 56.32 | 126.72 | 40.48 | 19.36 | 500 |
| Ca hard. (mg/L) | 18.30 | 10.56 | 20.42 | 18.30 | 17.60 | 113.34 | 11.26 | 24.64 | 12.67 | 5.63 | 500 |
| Mg hardness (mg/L) | 1.69 | 5.49 | 3.80 | 5.91 | 8.45 | 126.30 | 6.76 | 15.63 | 2.11 | 1.27 | 500 |
| Sulphates (mg/L) | 9.60 | 10.56 | 10.56 | 11.52 | 10.56 | 10.56 | 9.60 | 18.24 | 7.68 | 5.76 | 200-400 |
| Nitrate (mg/L) | 8.39 | 11.89 | 10.49 | 13.29 | 12.59 | 11.89 | 9.09 | 22.38 | 6.99 | 6.29 | 50 |
| Chloride (mg/L) | 29.94 | 11.36 | 21.30 | 22.69 | 22.69 | 18.43 | 31.20 | 68.10 | 15.60 | 17.04 | 200-250 |
| Fe (mg/L) | 0.1223 | 0.2445 | 0.4891 | 0.6114 | 0.2148 | 0.8559 | 2.5677 | 0.5013 | 0.5013 | 0.6445 | 0.30 |
| Mn (mg/L) | 0.0000 | 0.0000 | 0.0000 | 0.0000 | 0.0000 | 0.0324 | 0.0972 | 0.0000 | 0.0388 | 0.0000 | 0.05 |
| Pb (mg/L) | 0.0000 | 0.0000 | 0.0000 | 0.0000 | 0.0000 | 0.0489 | 0.0936 | 0.0000 | 0.0000 | 0.0000 | 0.05 |
| Ca (mg/L) | 1.3333 | 2.0000 | 3.3333 | 4.0000 | 15.3333 | 14.0000 | 66.0000 | 16.6667 | 0.6667 | 2.0000 | 200 |
| Mg (mg/L) | 2.2545 | 0.8454 | 3.6924 | 3.1432 | 3.5623 | 3.6201 | 5.9179 | 4.1259 | 1.2428 | 2.4495 | 150 |
| Na (mg/L) | 0.0447 | 0.2056 | 0.5140 | 0.9832 | 4.0262 | 1.8816 | 4.4291 | 4.0822 | 3.4511 | 2.7441 | 250 |
| K (mg/L) | 0.0773 | 0.1547 | 0.2320 | 0.3094 | 4.4970 | 7.3481 | 21.0387 | 18.1364 | 3.3727 | 3.6909 | 50 |
| Total Organic C (%) | 0.58 | 0.95 | 0.65 | 0.72 | 1.20 | 1.01 | 0.74 | 0.65 | 0.74 | 0.74 | 1.0 |
| Total coliform (MPN index/100 ml) | <1 | <1 | <1 | <1 | <1 | <1 | 2 | <1 | <1 | <1 | 0 or <1 |
| Feacal Coliform (MPN index/100 ml) | <1 | <1 | <1 | <1 | <1 | <1 | 1 | <1 | <1 | <1 | 0 or <1 |
Table text extracted from the original PDF; superscript letters are shown inline. The original table image is below.
View original table image
| S/No | Parameters (units) | WHO Permissible level | Assigned weights for each parameter (w) i | Relative weights for each parameter (W) i |
|---|---|---|---|---|
| 1 | Elect. Cond. (μS/cm) | 1000 | 4 | 0.06060 |
| 2 | Turbidity (NTU) | 5 | 2 | 0.03030 |
| 3 | Total solids (mg/L) | 1000 | 4 | 0.06060 |
| 4 | TDS (mg/L) | 1000 | 4 | 0.06060 |
| 5 | TSS (mg/L) | 500 | 2 | 0.03030 |
| 6 | pH | 7.2 | 4 | 0.06060 |
| 7 | Alkalinity (mg/L) | 100 | 3 | 0.04545 |
| 8 | Total hard. (mg/L) | 500 | 2 | 0.03030 |
| 9 | Ca hard. (mg/L) | 500 | 2 | 0.03030 |
| 10 | Mg hard. (mg/L) | 500 | 2 | 0.03030 |
| 11 | Sulphate (mg/L) | 300 | 4 | 0.06060 |
| 12 | Nitrate (mg/L) | 50 | 5 | 0.07575 |
| 13 | Chloride (mg/L) | 225 | 3 | 0.04545 |
| 14 | Iron content (mg/L) | 0.30 | 4 | 0.06060 |
| 15 | Mn (mg/L) | 0.05 | 4 | 0.06060 |
| 16 | Pb (mg/L) | 0.05 | 5 | 0.07575 |
| 17 | Ca (mg/L) | 200 | 2 | 0.03030 |
| 18 | Mg (mg/L) | 150 | 2 | 0.03030 |
| 19 | Na (mg/L) | 250 | 4 | 0.06060 |
| 20 | K (mg/L) | 50 | 2 | 0.03030 |
| 21 | Total C (%) | 1.0 | 2 | 0.03030 |
| ∑w=66 i | ∑W=1 i |
Table text extracted from the original PDF; superscript letters are shown inline. The original table image is below.
View original table image
| S/No | Parameters | BH ave. value | Q= 𝐚𝐯𝐞𝐫𝐚𝐠𝐞 𝐯𝐚𝐥𝐮𝐞 x100 𝐖𝐇𝐎𝐯𝐚𝐥𝐮𝐞 | (SI= (W× Q) i i i |
|---|---|---|---|---|
| 1. | Elect. cond. | 242.4 | 24.2 | 1.5 |
| 2. | Turbidity | 0.14 | 2.80 | 0.08 |
| 3. | Total solids | 244.0 | 24.4 | 1.5 |
| 4. | TDS | 220.0 | 22.0 | 1.3 |
| 5. | TSS | 28.0 | 5.6 | 0.2 |
| 6. | pH | 6.4 | 88.9 | 5.4 |
| 7. | Alkalinity | 27.8 | 27.8 | 1.3 |
| 8. | Total hardness | 63.71 | 12.74 | 0.39 |
| 9. | Calcium hard. | 17.03 | 3.41 | 0.10 |
| 10. | Mg hardness | 5.07 | 1.01 | 0.03 |
| 11. | Sulphate | 10.56 | 3.52 | 0.21 |
| 12. | Nitrate | 11.33 | 22.66 | 1.72 |
| 13. | Chloride | 21.60 | 96.00 | 4.36 |
| 14. | Iron content | 0.3364 | 112.1333 | 6.7953 |
| 15. | Manganese | 0.0000 | 0.0000 | 0.0000 |
| 16. | Lead | 0.0000 | 0.0000 | 0.0000 |
| 17. | Calcium | 5.2000 | 2.6000 | 0.0788 |
| 18. | Magnesium | 2.7000 | 1.8000 | 0.0545 |
| 19. | Sodium | 1.1547 | 0.4619 | 0.0280 |
| 20. | Potassium | 1.0541 | 2.1082 | 4.4445 |
| 21. | %Total carbon | 0.82 | 82.00 | 2.48 |
| WQI=∑SI= | 31.9711 ≈ 32=Excellent |
Table text extracted from the original PDF; superscript letters are shown inline. The original table image is below.
View original table image
| S/No | Parameters | BH ave. value | Q 𝐚𝐯𝐞.𝐯𝐚𝐥𝐮𝐞 x100 i=𝐖𝐇𝐎𝐯𝐚𝐥𝐮𝐞 | (SI= (W× Q) i i i |
|---|---|---|---|---|
| 1. | Electrical conduc. | 369.6 | 37.0 | 2.2 |
| 2. | Turbidity | 0.26 | 5.20 | 0.16 |
| 3. | Total solids | 240.0 | 24.0 | 1.5 |
| 4. | TDS | 196.0 | 19.6 | 1.2 |
| 5. | TSS | 44.0 | 8.8 | 0.3 |
| 6. | pH | 6.6 | 91.7 | 5.6 |
| 7. | Alkalinity | 149.6 | 34.4 | 1.6 |
| 8. | Total hardness | 75.68 | 15.14 | 0.46 |
| 9. | Calcium hard. | 33.51 | 6.70 | 0.20 |
| 10. | Mg hardness | 30.41 | 6.08 | 0.18 |
| 11. | Sulphate | 10.37 | 3.47 | 0.21 |
| 12. | Nitrate | 11.33 | 22.66 | 1.72 |
| 13. | Chloride | 30.07 | 13.36 | 0.61 |
| 14. | Iron content | 1.0141 | 338.0333 | 20.48 |
| 15. | Manganese | 0.0337 | 67.4000 | 4.0844 |
| 16. | Lead | 0.0285 | 57.0000 | 4.3178 |
| 17. | Calcium | 19.8667 | 9.9334 | 0.3010 |
| 18. | Magnesium | 3.4712 | 2.3141 | 0.0701 |
| 19. | Sodium | 3.3176 | 1.3270 | 0.0804 |
| 20. | Potassium | 10.7174 | 21.4348 | 0.6495 |
| 21. | %Total carbon | 0.78 | 78.00 | 2.36 |
| WQI=∑SI= | 48.2832 ≈ 48=Excellent |
Table text extracted from the original PDF; superscript letters are shown inline. The original table image is below.
View original table image
| WQI | Categories (water quality statements) |
|---|---|
| ≤50 | Excellent |
| 51-100 | Good |
| 101-200 | Poor |
| 201-300 | Very poor |
| >300 | Unfit for drinking (very bad) |
Table text extracted from the original PDF; superscript letters are shown inline. The original table image is below.
View original table image
References
29 in the original paper- Ahmad S. Agricultural runoff and its effects on groundwater quality. Agricultural Water Journal. 2019;35(3):255-270.
- Akertyo FD, Onah MA, Adimanyi O, Nyajo A. Assessment of hand-dug well water quality in Apeinumbu, community of Yandev, Gboko Local Government Area, Benue State Nigeria: Implications for public health. International Journal of Research and Scientific Innovation. 2024;11(8):530-546.
- Aluko B, Odusanya J. Sources of sodium in groundwater and health implications. Environmental Health Perspectives. 2021;129(7):785-790.
- APHA. Standard methods for examination of water and wastewater. New York: American Public Health Association, 2022.
- APHA-AWWA-WEF. Standard methods for examination of water and wastewater. New York: American Public Health Association-American Water Works-Water Environment Federation, 1999.
- AWWA. Simplified procedures for water examination. Manual M12. New York: American Water Works Association, 2013, p. 52-54.
- Azis A, Yusuf H. Water turbidity impact on discharge decrease of groundwater recharge in recharge reservoir. Procedia Engineering. 2015;125:199-206.
- Buba AA, Ujah LS, Ibrahim V. Water quality index and hydro geochemistry of Otukpo area, Benue State, North Central Nigeria. Journal of Tropical Resources and Sustainable Science. 2021;6:4-14.
- Chaudhary M, Bhardwaj R. Agricultural practices and potassium enrichment in water sources. Agricultural Water Management. 2020;45(2):312-320.
- Chidinma O, Okechukwu KW. Determination of heavy metal levels in surface water and sediment of Mini-Ezi stream, Elele-Alimini, Rivers State, Nigeria. Research Gate, 2022. DOI: 10.33886/ajpas.
- Chuckwu EO, Chime CV, Okoro AD, Ahmadu M. Physicochemical and microbial analysis of surface water quality at Mbagule-Ipav, Gboko LGA, Benue State, Nigeria for drinking purpose. International Journal of Advanced Science and Engineering. 2022;7(3):137-143.
- Edaba OV. Groundwater x-ray fluorescence analysis to detect solid mineral resources in Benue State, Nigeria. Nigerian Annals of Pure and Applied Sciences. 2023;6(1):142-153.
- Edeonovo MJ. Quality assessment of borehole water in Enugu urban. [Unpublished Master's Thesis]. Awka: Nnamdi Azikiwe University, 2010.
- EPA. Potassium in drinking water and its health effects. U.S. Environmental Protection Agency, 2022.
- Essamlali I, Nhaila H, El Khaili M. Advances in machine learning IoT for water quality monitoring: A comprehensive review. Heliyon. 2024;10(6).
- International Organization for Standardization. Water quality. Geneva: ISO, 2023, p. 981.
- Kumar N, Ghosh P. Geological and anthropogenic contributions to iron levels in groundwater. Hydrology Research. 2019;50(3):562-573.
- Levine R. Handbook of pesticides toxicology. Vol. 1. San Diego: Academic Press Inc., 2023, p. 275.
- Nkurumah AF. Chemical analysis of well water from wells sited close to on-site sanitation systems: A case study in the Mfantseman West District of the Central Region. [Unpublished Thesis]. Kumasi: Kwame Nkrumah University of Science and Technology, 2011.
- Ogbane IO, Omeje OR, Jimoh JB, Alabi RO, Yahaya EA. Groundwater quality assessment of selected communities in Katsina-Ala local government of Benue State, Nigeria. International Journal of Applied Chemical and Biological Sciences. 2022;3(3):32-38.
- Ohiaba EE, Idakwoji JA, Umar B, David I, Idenyi AA, Imarhiagbe O, et al. Physicochemical and bacteriological assessment of groundwater in selected areas of Makurdi, Benue State, Nigeria. International Journal of Research Publication and Reviews. 2023;4(3):4410-4417.
- Okoye COB, Nyiatagher TD. Physico-chemical quality of shallow well-waters in Gboko, Benue State, Nigeria. Bull Chem Soc Ethiopia. 2009;23(1):123-128.
- Omonona O, Okogbue C. Hydrochemical evolution, geospatial groundwater quality and potential health risks associated with intake of nitrate via drinking water: Case of Gboko agricultural district, central Nigeria. Environmental Earth Sciences. 2021;80(4).
- Ovem HH, Ovem IM, Ezeweali D. Temperature, pH, conductivity, total dissolved solids and chemical oxygen demand of groundwater in Boji-BojiAgbor/Owa area and immediate suburbs. Research Journal of Environmental Sciences. 2014;8(8):444-450.
- Tsor JO, Biam JT, Terver D, Amon PS, Jombo GT. Assessment of physico-chemical parameters and heavy metal concentrations in well water of Logo 2 Area of Makurdi, Nigeria. Nigeria Annals of Pure & Applied Sciences. 2022;5(1):137-148.
- USEPA. Health risks associated with lead in drinking water. Environmental Protection Agency, 2021.
- WHO. Guidelines for drinking water quality. Geneva: World Health Organization, 2022, p. 281-294.
- WHO. Groundwater abstraction and treatment; guidelines for drinking water qualities. Geneva: Macmillan, 2023, p. 105.
- Wuave T. Leachate migration and percolation consequences on water quality: A case study of Plateau State, Nigeria. EDP Sciences. 2024;497:1-15.