
Research article · 2025 · Full text
International Journal of Horticulture and Food ScienceEffectiveness of Trichoderma reesei for management of anthracnose and survival of mango grafts
Volume 7(5) · Pages 16–18 · DOI: 10.33545/26631067.2025.v7.i5a.291 ↗
Research areasPlant Disease Management TechniquesBanana Cultivation and ResearchPlant tissue culture and regeneration
Abstract
Author-writtenMango fruit is one\r\nof the most important cultivar in the konkan region. Several nurseries in the\r\nKonkan region of Maharashtra offer grafted mango plants. The mango disease such\r\nas anthracnose is destructive to mangoes grafts. The disease damages the leaf\r\nof infected mango grafts, leading to mortality of grafts. Mango anthracnose,\r\ncaused by Colletotrichum gloeosporioides attacks on leaf portion of the\r\nmango grafts. Application of bio-control agent such as Trichoderma has\r\nhuge potential in plant disease management. However the Trichoderma in\r\ntalc or spore form did not significantly control the anthracnose of mango\r\ngrafts under field conditions. However the graft survival is more in treatment\r\nhaving application of Trichoderma talc and spore formulation.
Summary
Source-checkedPlain-language reading of the full paper, prepared with AI and checked against the text. Each point links to the authors' own words.
Why it matters
- Mango is a critical fruit crop in the Konkan region of Maharashtra, India. View evidence ↗
- Anthracnose, caused by Colletotrichum gloeosporioides, is a destructive disease that damages leaves and can lead to the death of mango grafts. View evidence ↗
- Bio-control agents like Trichoderma are considered to have significant potential for managing plant diseases. View evidence ↗
The question
- The study aimed to evaluate the effectiveness of Trichoderma reesei in managing leaf anthracnose in mango grafts. View evidence ↗
What they did
- The research was conducted over three consecutive years (2021-22 to 2023-24) at the Regional Fruit Research Station in Vengurla. View evidence ↗
- Nine treatments were tested, including a control (potting mixture alone), individual applications of Beijerinckia, PSB, and talc-based Trichoderma (50g), combinations of these, and additional spore-form Trichoderma sprays. View evidence ↗
- Anthracnose incidence was measured using a 0-5 rating scale, and the Percent Disease Intensity (PDI) was calculated. View evidence ↗
What they found
- None of the treatments, including those with Trichoderma in talc or spore form, had a statistically significant effect on controlling anthracnose. View evidence ↗
- Despite the lack of effect on anthracnose, the survival rate of mango grafts was higher in treatments that included Trichoderma in either talc or spore form. View evidence ↗
What it means
- The authors concluded that while Trichoderma does not manage anthracnose disease, it is effective in increasing the overall survival of mango grafts. View evidence ↗
- The lack of effectiveness against anthracnose may have been caused by very low disease incidence or the inability of Trichoderma to function in very hot conditions. View evidence ↗
Visual summary
2 visualsIllustrations explain the paper; charts are replotted from the paper's own table values.
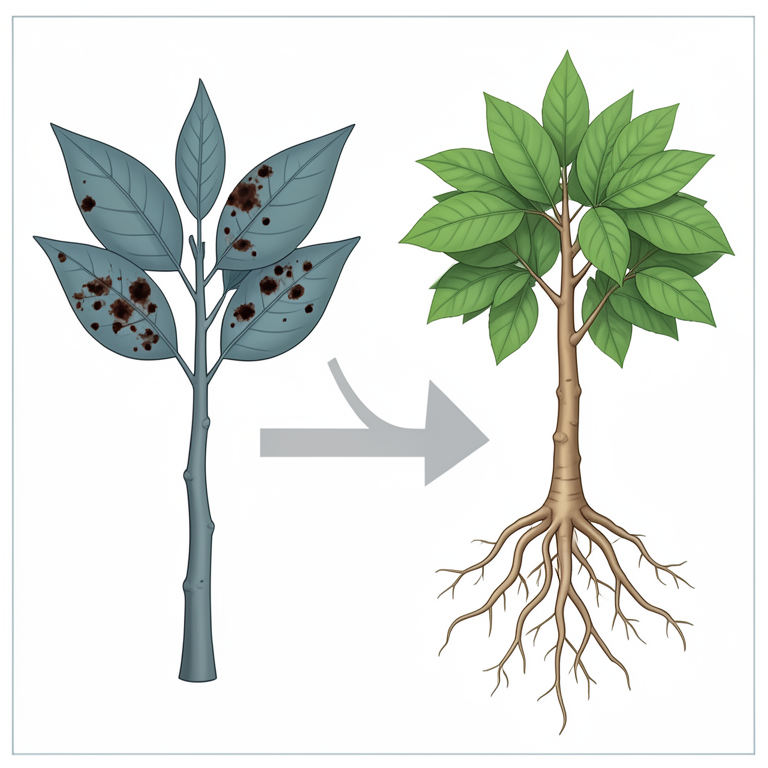
Trichoderma's Dual Effect
AI-generated conceptual illustration (mango grafts). It explains the idea and does not show study data.
View source evidence ↗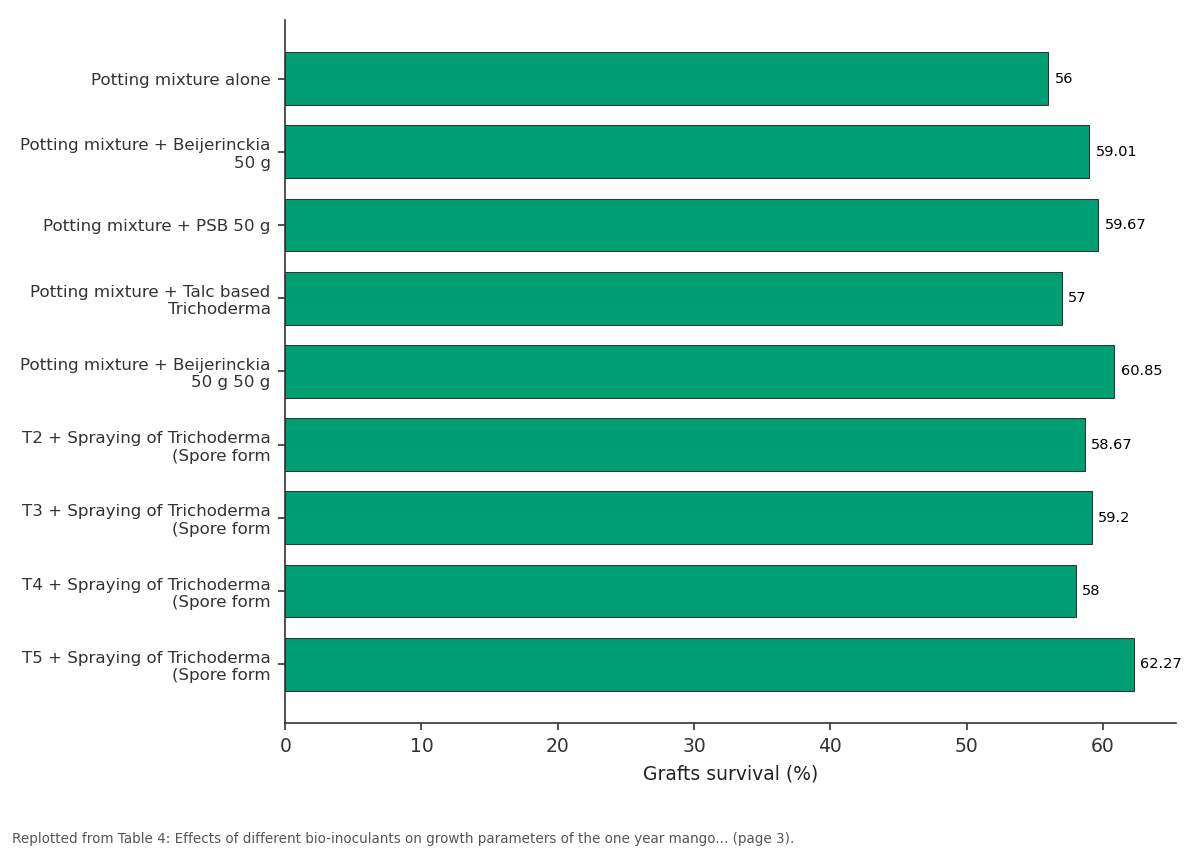
22-23: Potting mixture alone vs Potting mixture +... vs Potting mixture + PSB... vs Potting mixture + Talc... vs Potting mixture +...
Replotted from Table 4 (page 3) of the original paper. Every bar is the paper's own table value.
View source evidence ↗Figures & tables
From the original paper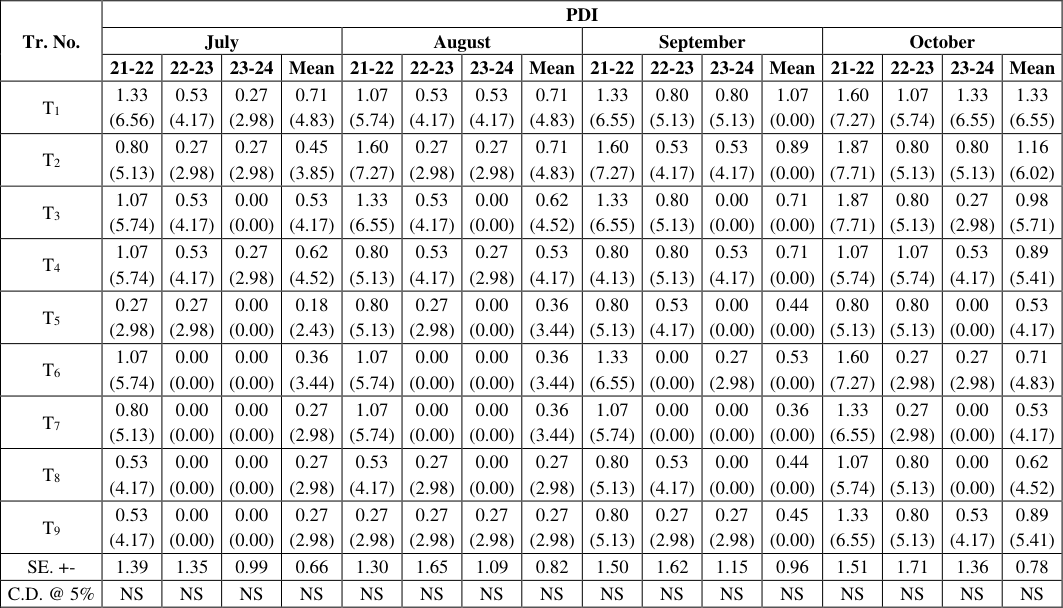 Table 1
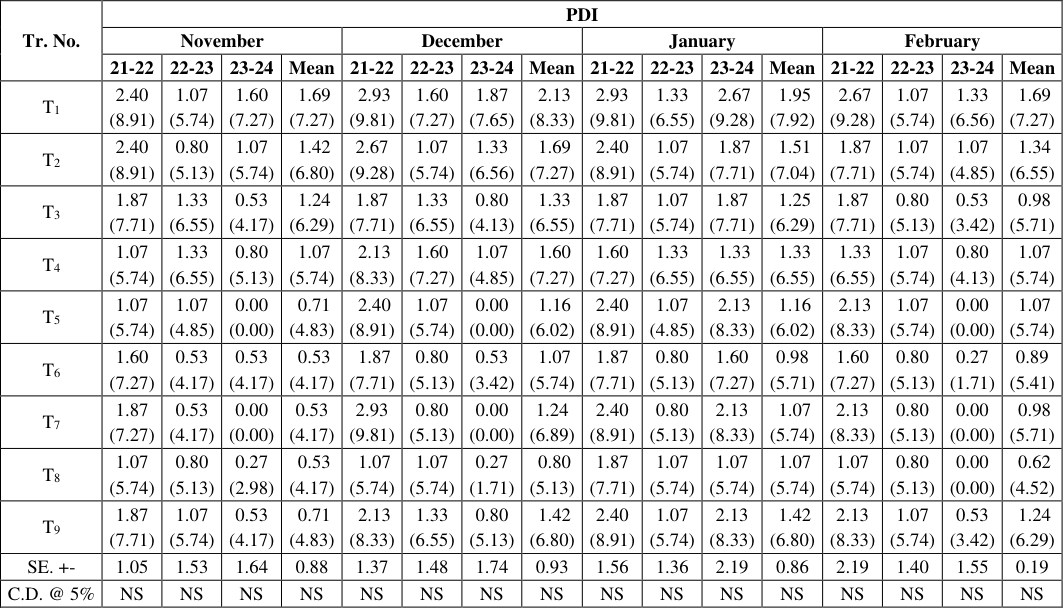 Table 2
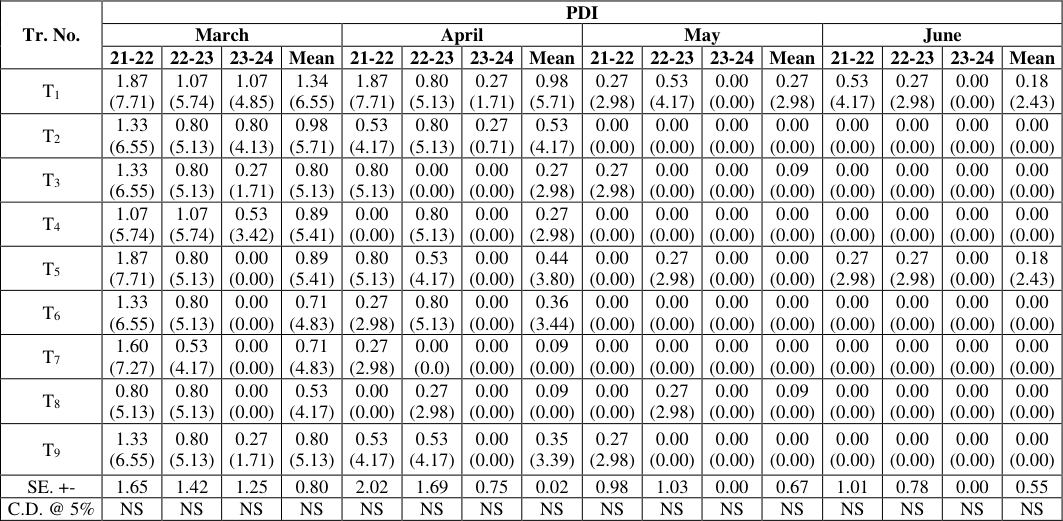 Table 3
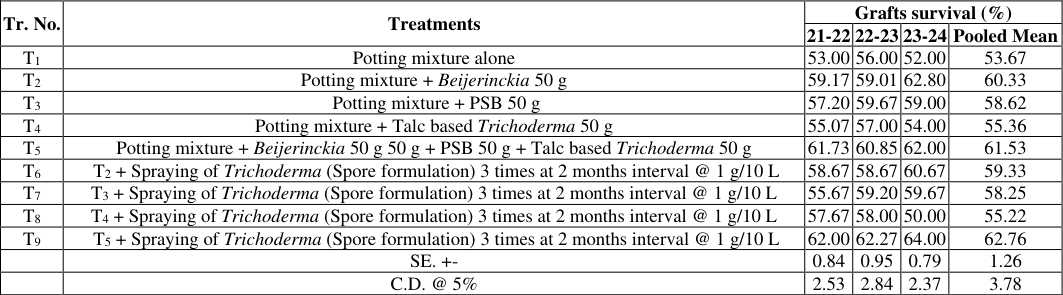 Table 4
Introduction
Mango is grown in almost all the parts of India and is one of the most important fruit crop of konkan region. There are so many nurseries in Konkan region which are involved in the production of mango grafts. Mango grafts can be affected by several diseases, including Anthracnose, Powdery mildew, Mango malformation, wilt and Root rot. Anthracnose, a fungal disease, can cause dark spots on leaves and fruits, particularly during wet conditions.
However the mortality of the mango grafts may be due to the wilt, root rot and the anthracnose diseases. The mango disease such as anthracnose is destructive to mangoes grafts. The disease damages the leaf of infected mango grafts, leading to mortality of grafts. Mango anthracnose, caused by Colletotrichum gloeosporioides attacks on leaf portion of the mango grafts.
Application of bio-control agent such as Trichoderma is effective in controlling the Anthracnose of mango (Mirwais Niazi et al. 2022) [2].With this view the efforts have been made to manage the leaf anthracnose disease
Materials And Methods
The experiment has been conducted for the consecutive three years at Regional fruit Research station, Vengurla from 2021-22 to 2023-24. The details of the experiment are as follows. Treatment Details Tr. No.
Treatments T1 Potting mixture alone T2 Potting mixture + Beijerinckia (Beijerinckia indica) 50 g T3 Potting mixture + PSB (Burkholderia territorri) 50 g T4 Potting mixture + Talc based Trichoderma (T. reesei)50 g T5 Potting mixture + Beijerinckia 50 g + PSB 50 g + Talc based Trichoderma (T. reesei) 50 g T6 T2 + Spraying of Trichoderma (Spore formulation) 6 times at 2 months interval @ 1 g/10 L T7 T3 + Spraying of Trichoderma (Spore formulation) 6 times at 2 months interval @ 1 g/10 L T8 T4 + Spraying of Trichoderma (Spore formulation) 6 times at 2 months interval @ 1 g/10 L T9 T5 + Spraying of Trichoderma (Spore formulation) 6 times at 2 months interval @ 1 g/10 L The observations on anthracnose incidence were recorded using 0-5 rating scale as follows. NAAS Rating: 4.74 IJHFS 2025; 7(5): 16-18 YR Govekar Regional Fruit Research Station, Vengurle, Sindhudurg, Maharashtra, India SN Talha Regional Fruit Research Station, Vengurle, Sindhudurg, Maharashtra, India SS Munj Regional Fruit Research Station, Vengurle, Sindhudurg, Maharashtra, India YR Govekar Regional Fruit Research Station, Vengurle, Sindhudurg, Maharashtra, India 0 = No infection 1 = 1-20% infection 2 = 21-40% infection 3 = 41-60% infection 4 = 61-80% infection 5 = 81-100% infection. https://www.hortijournal.com Percent Disease Intensity (PDI) was calculated by using the formula. Sum of all numerical ratings PDI = x 100 No. of flushes observed x Maximum rating Table 1: The month wise status of the Percent Disease Index (PDI) of anthracnose disease of mango grafts.(Pooled Mean) Tr. No.
| Tr. No. | PDI | — | — | — | — | — | — | — | — | — | — | — | — | — | — | — |
|---|---|---|---|---|---|---|---|---|---|---|---|---|---|---|---|---|
| July | August | September | October | |||||||||||||
| 21-22 | 22-23 | 23-24 | Mean | 21-22 | 22-23 | 23-24 | Mean | 21-22 | 22-23 | 23-24 | Mean | 21-22 | 22-23 | 23-24 | Mean | |
| T1 | 1.33 (6.56) | 0.53 (4.17) | 0.27 (2.98) | 0.71 (4.83) | 1.07 (5.74) | 0.53 (4.17) | 0.53 (4.17) | 0.71 (4.83) | 1.33 (6.55) | 0.80 (5.13) | 0.80 (5.13) | 1.07 (0.00) | 1.60 (7.27) | 1.07 (5.74) | 1.33 (6.55) | 1.33 (6.55) |
| T2 | 0.80 (5.13) | 0.27 (2.98) | 0.27 (2.98) | 0.45 (3.85) | 1.60 (7.27) | 0.27 (2.98) | 0.27 (2.98) | 0.71 (4.83) | 1.60 (7.27) | 0.53 (4.17) | 0.53 (4.17) | 0.89 (0.00) | 1.87 (7.71) | 0.80 (5.13) | 0.80 (5.13) | 1.16 (6.02) |
| T3 | 1.07 (5.74) | 0.53 (4.17) | 0.00 (0.00) | 0.53 (4.17) | 1.33 (6.55) | 0.53 (4.17) | 0.00 (0.00) | 0.62 (4.52) | 1.33 (6.55) | 0.80 (5.13) | 0.00 (0.00) | 0.71 (0.00) | 1.87 (7.71) | 0.80 (5.13) | 0.27 (2.98) | 0.98 (5.71) |
| T4 | 1.07 (5.74) | 0.53 (4.17) | 0.27 (2.98) | 0.62 (4.52) | 0.80 (5.13) | 0.53 (4.17) | 0.27 (2.98) | 0.53 (4.17) | 0.80 (4.13) | 0.80 (5.13) | 0.53 (4.17) | 0.71 (0.00) | 1.07 (5.74) | 1.07 (5.74) | 0.53 (4.17) | 0.89 (5.41) |
| T5 | 0.27 (2.98) | 0.27 (2.98) | 0.00 (0.00) | 0.18 (2.43) | 0.80 (5.13) | 0.27 (2.98) | 0.00 (0.00) | 0.36 (3.44) | 0.80 (5.13) | 0.53 (4.17) | 0.00 (0.00) | 0.44 (0.00) | 0.80 (5.13) | 0.80 (5.13) | 0.00 (0.00) | 0.53 (4.17) |
| T6 | 1.07 (5.74) | 0.00 (0.00) | 0.00 (0.00) | 0.36 (3.44) | 1.07 (5.74) | 0.00 (0.00) | 0.00 (0.00) | 0.36 (3.44) | 1.33 (6.55) | 0.00 (0.00) | 0.27 (2.98) | 0.53 (0.00) | 1.60 (7.27) | 0.27 (2.98) | 0.27 (2.98) | 0.71 (4.83) |
| T7 | 0.80 (5.13) | 0.00 (0.00) | 0.00 (0.00) | 0.27 (2.98) | 1.07 (5.74) | 0.00 (0.00) | 0.00 (0.00) | 0.36 (3.44) | 1.07 (5.74) | 0.00 (0.00) | 0.00 (0.00) | 0.36 (0.00) | 1.33 (6.55) | 0.27 (2.98) | 0.00 (0.00) | 0.53 (4.17) |
| T8 | 0.53 (4.17) | 0.00 (0.00) | 0.00 (0.00) | 0.27 (2.98) | 0.53 (4.17) | 0.27 (2.98) | 0.00 (0.00) | 0.27 (2.98) | 0.80 (5.13) | 0.53 (4.17) | 0.00 (0.00) | 0.44 (0.00) | 1.07 (5.74) | 0.80 (5.13) | 0.00 (0.00) | 0.62 (4.52) |
| T9 | 0.53 (4.17) | 0.00 (0.00) | 0.00 (0.00) | 0.27 (2.98) | 0.27 (2.98) | 0.27 (2.98) | 0.27 (2.98) | 0.27 (2.98) | 0.80 (5.13) | 0.27 (2.98) | 0.27 (2.98) | 0.45 (0.00) | 1.33 (6.55) | 0.80 (5.13) | 0.53 (4.17) | 0.89 (5.41) |
| SE. +- | 1.39 | 1.35 | 0.99 | 0.66 | 1.30 | 1.65 | 1.09 | 0.82 | 1.50 | 1.62 | 1.15 | 0.96 | 1.51 | 1.71 | 1.36 | 0.78 |
| C.D. @ 5% | NS | NS | NS | NS | NS | NS | NS | NS | NS | NS | NS | NS | NS | NS | NS | NS |
Table text extracted from the original PDF; superscript letters are shown inline. The original table image is below.
View original table image
PDI July August September October 21-22 22-23 23-24 Mean 21-22 22-23 23-24 Mean 21-22 22-23 23-24 Mean 21-22 22-23 23-24 Mean T1 1.33 (6.56) 0.53 (4.17) 0.27 (2.98) 0.71 (4.83) 1.07 (5.74) 0.53 (4.17) 0.53 (4.17) 0.71 (4.83) 1.33 (6.55) 0.80 (5.13) 0.80 (5.13) 1.07 (0.00) 1.60 (7.27) 1.07 (5.74) 1.33 (6.55) 1.33 (6.55) T2 0.80 (5.13) 0.27 (2.98) 0.27 (2.98) 0.45 (3.85) 1.60 (7.27) 0.27 (2.98) 0.27 (2.98) 0.71 (4.83) 1.60 (7.27) 0.53 (4.17) 0.53 (4.17) 0.89 (0.00) 1.87 (7.71) 0.80 (5.13) 0.80 (5.13) 1.16 (6.02) T3 1.07 (5.74) 0.53 (4.17) 0.00 (0.00) 0.53 (4.17) 1.33 (6.55) 0.53 (4.17) 0.00 (0.00) 0.62 (4.52) 1.33 (6.55) 0.80 (5.13) 0.00 (0.00) 0.71 (0.00) 1.87 (7.71) 0.80 (5.13) 0.27 (2.98) 0.98 (5.71) T4 1.07 (5.74) 0.53 (4.17) 0.27 (2.98) 0.62 (4.52) 0.80 (5.13) 0.53 (4.17) 0.27 (2.98) 0.53 (4.17) 0.80 (4.13) 0.80 (5.13) 0.53 (4.17) 0.71 (0.00) 1.07 (5.74) 1.07 (5.74) 0.53 (4.17) 0.89 (5.41) T5 0.27 (2.98) 0.27 (2.98) 0.00 (0.00) 0.18 (2.43) 0.80 (5.13) 0.27 (2.98) 0.00 (0.00) 0.36 (3.44) 0.80 (5.13) 0.53 (4.17) 0.00 (0.00) 0.44 (0.00) 0.80 (5.13) 0.80 (5.13) 0.00 (0.00) 0.53 (4.17) T6 1.07 (5.74) 0.00 (0.00) 0.00 (0.00) 0.36 (3.44) 1.07 (5.74) 0.00 (0.00) 0.00 (0.00) 0.36 (3.44) 1.33 (6.55) 0.00 (0.00) 0.27 (2.98) 0.53 (0.00) 1.60 (7.27) 0.27 (2.98) 0.27 (2.98) 0.71 (4.83) T7 0.80 (5.13) 0.00 (0.00) 0.00 (0.00) 0.27 (2.98) 1.07 (5.74) 0.00 (0.00) 0.00 (0.00) 0.36 (3.44) 1.07 (5.74) 0.00 (0.00) 0.00 (0.00) 0.36 (0.00) 1.33 (6.55) 0.27 (2.98) 0.00 (0.00) 0.53 (4.17) T8 0.53 (4.17) 0.00 (0.00) 0.00 (0.00) 0.27 (2.98) 0.53 (4.17) 0.27 (2.98) 0.00 (0.00) 0.27 (2.98) 0.80 (5.13) 0.53 (4.17) 0.00 (0.00) 0.44 (0.00) 1.07 (5.74) 0.80 (5.13) 0.00 (0.00) 0.62 (4.52) T9 0.53 (4.17) 0.00 (0.00) 0.00 (0.00) 0.27 (2.98) 0.27 (2.98) 0.27 (2.98) 0.27 (2.98) 0.27 (2.98) 0.80 (5.13) 0.27 (2.98) 0.27 (2.98) 0.45 (0.00) 1.33 (6.55) 0.80 (5.13) 0.53 (4.17) 0.89 (5.41) SE. +- 1.39 1.35 0.99 0.66 1.30 1.65 1.09 0.82 1.50 1.62 1.15 0.96 1.51 1.71 1.36 0.78 C.D. @ 5% NS NS NS NS NS NS NS NS NS NS NS NS NS NS NS NS Table 2: The month wise status of the Percent Disease Index (PDI) of anthracnose disease of mango grafts. (Pooled Mean) Tr. No. PDI November December January February 21-22 22-23 23-24 Mean 21-22 22-23 23-24 Mean 21-22 22-23 23-24 Mean 21-22 22-23 23-24 Mean T1 2.40 (8.91) 1.07 (5.74) 1.60 (7.27) 1.69 (7.27) 2.93 (9.81) 1.60 (7.27) 1.87 (7.65) 2.13 (8.33) 2.93 (9.81) 1.33 (6.55) 2.67 (9.28) 1.95 (7.92) 2.67 (9.28) 1.07 (5.74) 1.33 (6.56) 1.69 (7.27) T2 2.40 (8.91) 0.80 (5.13) 1.07 (5.74) 1.42 (6.80) 2.67 (9.28) 1.07 (5.74) 1.33 (6.56) 1.69 (7.27) 2.40 (8.91) 1.07 (5.74) 1.87 (7.71) 1.51 (7.04) 1.87 (7.71) 1.07 (5.74) 1.07 (4.85) 1.34 (6.55) T3 1.87 (7.71) 1.33 (6.55) 0.53 (4.17) 1.24 (6.29) 1.87 (7.71) 1.33 (6.55) 0.80 (4.13) 1.33 (6.55) 1.87 (7.71) 1.07 (5.74) 1.87 (7.71) 1.25 (6.29) 1.87 (7.71) 0.80 (5.13) 0.53 (3.42) 0.98 (5.71) T4 1.07 (5.74) 1.33 (6.55) 0.80 (5.13) 1.07 (5.74) 2.13 (8.33) 1.60 (7.27) 1.07 (4.85) 1.60 (7.27) 1.60 (7.27) 1.33 (6.55) 1.33 (6.55) 1.33 (6.55) 1.33 (6.55) 1.07 (5.74) 0.80 (4.13) 1.07 (5.74) T5 1.07 (5.74) 1.07 (4.85) 0.00 (0.00) 0.71 (4.83) 2.40 (8.91) 1.07 (5.74) 0.00 (0.00) 1.16 (6.02) 2.40 (8.91) 1.07 (4.85) 2.13 (8.33) 1.16 (6.02) 2.13 (8.33) 1.07 (5.74) 0.00 (0.00) 1.07 (5.74) T6 1.60 (7.27) 0.53 (4.17) 0.53 (4.17) 0.53 (4.17) 1.87 (7.71) 0.80 (5.13) 0.53 (3.42) 1.07 (5.74) 1.87 (7.71) 0.80 (5.13) 1.60 (7.27) 0.98 (5.71) 1.60 (7.27) 0.80 (5.13) 0.27 (1.71) 0.89 (5.41) T7 1.87 (7.27) 0.53 (4.17) 0.00 (0.00) 0.53 (4.17) 2.93 (9.81) 0.80 (5.13) 0.00 (0.00) 1.24 (6.89) 2.40 (8.91) 0.80 (5.13) 2.13 (8.33) 1.07 (5.74) 2.13 (8.33) 0.80 (5.13) 0.00 (0.00) 0.98 (5.71) T8 1.07 (5.74) 0.80 (5.13) 0.27 (2.98) 0.53 (4.17) 1.07 (5.74) 1.07 (5.74) 0.27 (1.71) 0.80 (5.13) 1.87 (7.71) 1.07 (5.74) 1.07 (5.74) 1.07 (5.74) 1.07 (5.74) 0.80 (5.13) 0.00 (0.00) 0.62 (4.52) T9 1.87 (7.71) 1.07 (5.74) 0.53 (4.17) 0.71 (4.83) 2.13 (8.33) 1.33 (6.55) 0.80 (5.13) 1.42 (6.80) 2.40 (8.91) 1.07 (5.74) 2.13 (8.33) 1.42 (6.80) 2.13 (8.33) 1.07 (5.74) 0.53 (3.42) 1.24 (6.29) SE. +- 1.05 1.53 1.64 0.88 1.37 1.48 1.74 0.93 1.56 1.36 2.19 0.86 2.19 1.40 1.55 0.19 C.D. @ 5% NS NS NS NS NS NS NS NS NS NS NS NS NS NS NS NS https://www.hortijournal.com Table 3: The month wise status of the Percent Disease Index (PDI) of anthracnose disease of mango grafts. (Pooled Mean) Tr. No.
| Tr. No. | PDI | — | — | — | — | — | — | — | — | — | — | — | — | — | — | — |
|---|---|---|---|---|---|---|---|---|---|---|---|---|---|---|---|---|
| March | April | May | June | |||||||||||||
| 21-22 | 22-23 | 23-24 | Mean | 21-22 | 22-23 | 23-24 | Mean | 21-22 | 22-23 | 23-24 | Mean | 21-22 | 22-23 | 23-24 | Mean | |
| T1 | 1.87 (7.71) | 1.07 (5.74) | 1.07 (4.85) | 1.34 (6.55) | 1.87 (7.71) | 0.80 (5.13) | 0.27 (1.71) | 0.98 (5.71) | 0.27 (2.98) | 0.53 (4.17) | 0.00 (0.00) | 0.27 (2.98) | 0.53 (4.17) | 0.27 (2.98) | 0.00 (0.00) | 0.18 (2.43) |
| T2 | 1.33 (6.55) | 0.80 (5.13) | 0.80 (4.13) | 0.98 (5.71) | 0.53 (4.17) | 0.80 (5.13) | 0.27 (0.71) | 0.53 (4.17) | 0.00 (0.00) | 0.00 (0.00) | 0.00 (0.00) | 0.00 (0.00) | 0.00 (0.00) | 0.00 (0.00) | 0.00 (0.00) | 0.00 (0.00) |
| T3 | 1.33 (6.55) | 0.80 (5.13) | 0.27 (1.71) | 0.80 (5.13) | 0.80 (5.13) | 0.00 (0.00) | 0.00 (0.00) | 0.27 (2.98) | 0.27 (2.98) | 0.00 (0.00) | 0.00 (0.00) | 0.09 (0.00) | 0.00 (0.00) | 0.00 (0.00) | 0.00 (0.00) | 0.00 (0.00) |
| T4 | 1.07 (5.74) | 1.07 (5.74) | 0.53 (3.42) | 0.89 (5.41) | 0.00 (0.00) | 0.80 (5.13) | 0.00 (0.00) | 0.27 (2.98) | 0.00 (0.00) | 0.00 (0.00) | 0.00 (0.00) | 0.00 (0.00) | 0.00 (0.00) | 0.00 (0.00) | 0.00 (0.00) | 0.00 (0.00) |
| T5 | 1.87 (7.71) | 0.80 (5.13) | 0.00 (0.00) | 0.89 (5.41) | 0.80 (5.13) | 0.53 (4.17) | 0.00 (0.00) | 0.44 (3.80) | 0.00 (0.00) | 0.27 (2.98) | 0.00 (0.00) | 0.00 (0.00) | 0.27 (2.98) | 0.27 (2.98) | 0.00 (0.00) | 0.18 (2.43) |
| T6 | 1.33 (6.55) | 0.80 (5.13) | 0.00 (0.00) | 0.71 (4.83) | 0.27 (2.98) | 0.80 (5.13) | 0.00 (0.00) | 0.36 (3.44) | 0.00 (0.00) | 0.00 (0.00) | 0.00 (0.00) | 0.00 (0.00) | 0.00 (0.00) | 0.00 (0.00) | 0.00 (0.00) | 0.00 (0.00) |
| T7 | 1.60 (7.27) | 0.53 (4.17) | 0.00 (0.00) | 0.71 (4.83) | 0.27 (2.98) | 0.00 (0.0) | 0.00 (0.00) | 0.09 (0.00) | 0.00 (0.00) | 0.00 (0.00) | 0.00 (0.00) | 0.00 (0.00) | 0.00 (0.00) | 0.00 (0.00) | 0.00 (0.00) | 0.00 (0.00) |
| T8 | 0.80 (5.13) | 0.80 (5.13) | 0.00 (0.00) | 0.53 (4.17) | 0.00 (0.00) | 0.27 (2.98) | 0.00 (0.00) | 0.09 (0.00) | 0.00 (0.00) | 0.27 (2.98) | 0.00 (0.00) | 0.09 (0.00) | 0.00 (0.00) | 0.00 (0.00) | 0.00 (0.00) | 0.00 (0.00) |
| T9 | 1.33 (6.55) | 0.80 (5.13) | 0.27 (1.71) | 0.80 (5.13) | 0.53 (4.17) | 0.53 (4.17) | 0.00 (0.00) | 0.35 (3.39) | 0.27 (2.98) | 0.00 (0.00) | 0.00 (0.00) | 0.00 (0.00) | 0.00 (0.00) | 0.00 (0.00) | 0.00 (0.00) | 0.00 (0.00) |
| SE. +- | 1.65 | 1.42 | 1.25 | 0.80 | 2.02 | 1.69 | 0.75 | 0.02 | 0.98 | 1.03 | 0.00 | 0.67 | 1.01 | 0.78 | 0.00 | 0.55 |
| C.D. @ 5% | NS | NS | NS | NS | NS | NS | NS | NS | NS | NS | NS | NS | NS | NS | NS | NS |
Table text extracted from the original PDF; superscript letters are shown inline. The original table image is below.
View original table image
| Tr. No. | PDI | — | — | — | — | — | — | — | — | — | — | — | — | — | — | — |
|---|---|---|---|---|---|---|---|---|---|---|---|---|---|---|---|---|
| November | December | January | February | |||||||||||||
| 21-22 | 22-23 | 23-24 | Mean | 21-22 | 22-23 | 23-24 | Mean | 21-22 | 22-23 | 23-24 | Mean | 21-22 | 22-23 | 23-24 | Mean | |
| T1 | 2.40 (8.91) | 1.07 (5.74) | 1.60 (7.27) | 1.69 (7.27) | 2.93 (9.81) | 1.60 (7.27) | 1.87 (7.65) | 2.13 (8.33) | 2.93 (9.81) | 1.33 (6.55) | 2.67 (9.28) | 1.95 (7.92) | 2.67 (9.28) | 1.07 (5.74) | 1.33 (6.56) | 1.69 (7.27) |
| T2 | 2.40 (8.91) | 0.80 (5.13) | 1.07 (5.74) | 1.42 (6.80) | 2.67 (9.28) | 1.07 (5.74) | 1.33 (6.56) | 1.69 (7.27) | 2.40 (8.91) | 1.07 (5.74) | 1.87 (7.71) | 1.51 (7.04) | 1.87 (7.71) | 1.07 (5.74) | 1.07 (4.85) | 1.34 (6.55) |
| T3 | 1.87 (7.71) | 1.33 (6.55) | 0.53 (4.17) | 1.24 (6.29) | 1.87 (7.71) | 1.33 (6.55) | 0.80 (4.13) | 1.33 (6.55) | 1.87 (7.71) | 1.07 (5.74) | 1.87 (7.71) | 1.25 (6.29) | 1.87 (7.71) | 0.80 (5.13) | 0.53 (3.42) | 0.98 (5.71) |
| T4 | 1.07 (5.74) | 1.33 (6.55) | 0.80 (5.13) | 1.07 (5.74) | 2.13 (8.33) | 1.60 (7.27) | 1.07 (4.85) | 1.60 (7.27) | 1.60 (7.27) | 1.33 (6.55) | 1.33 (6.55) | 1.33 (6.55) | 1.33 (6.55) | 1.07 (5.74) | 0.80 (4.13) | 1.07 (5.74) |
| T5 | 1.07 (5.74) | 1.07 (4.85) | 0.00 (0.00) | 0.71 (4.83) | 2.40 (8.91) | 1.07 (5.74) | 0.00 (0.00) | 1.16 (6.02) | 2.40 (8.91) | 1.07 (4.85) | 2.13 (8.33) | 1.16 (6.02) | 2.13 (8.33) | 1.07 (5.74) | 0.00 (0.00) | 1.07 (5.74) |
| T6 | 1.60 (7.27) | 0.53 (4.17) | 0.53 (4.17) | 0.53 (4.17) | 1.87 (7.71) | 0.80 (5.13) | 0.53 (3.42) | 1.07 (5.74) | 1.87 (7.71) | 0.80 (5.13) | 1.60 (7.27) | 0.98 (5.71) | 1.60 (7.27) | 0.80 (5.13) | 0.27 (1.71) | 0.89 (5.41) |
| T7 | 1.87 (7.27) | 0.53 (4.17) | 0.00 (0.00) | 0.53 (4.17) | 2.93 (9.81) | 0.80 (5.13) | 0.00 (0.00) | 1.24 (6.89) | 2.40 (8.91) | 0.80 (5.13) | 2.13 (8.33) | 1.07 (5.74) | 2.13 (8.33) | 0.80 (5.13) | 0.00 (0.00) | 0.98 (5.71) |
| T8 | 1.07 (5.74) | 0.80 (5.13) | 0.27 (2.98) | 0.53 (4.17) | 1.07 (5.74) | 1.07 (5.74) | 0.27 (1.71) | 0.80 (5.13) | 1.87 (7.71) | 1.07 (5.74) | 1.07 (5.74) | 1.07 (5.74) | 1.07 (5.74) | 0.80 (5.13) | 0.00 (0.00) | 0.62 (4.52) |
| T9 | 1.87 (7.71) | 1.07 (5.74) | 0.53 (4.17) | 0.71 (4.83) | 2.13 (8.33) | 1.33 (6.55) | 0.80 (5.13) | 1.42 (6.80) | 2.40 (8.91) | 1.07 (5.74) | 2.13 (8.33) | 1.42 (6.80) | 2.13 (8.33) | 1.07 (5.74) | 0.53 (3.42) | 1.24 (6.29) |
| SE. +- | 1.05 | 1.53 | 1.64 | 0.88 | 1.37 | 1.48 | 1.74 | 0.93 | 1.56 | 1.36 | 2.19 | 0.86 | 2.19 | 1.40 | 1.55 | 0.19 |
| C.D. @ 5% | NS | NS | NS | NS | NS | NS | NS | NS | NS | NS | NS | NS | NS | NS | NS | NS |
Table text extracted from the original PDF; superscript letters are shown inline. The original table image is below.
View original table image
PDI March April May June 21-22 22-23 23-24 Mean 21-22 22-23 23-24 Mean 21-22 22-23 23-24 Mean 21-22 22-23 23-24 Mean T1 1.87 (7.71) 1.07 (5.74) 1.07 (4.85) 1.34 (6.55) 1.87 (7.71) 0.80 (5.13) 0.27 (1.71) 0.98 (5.71) 0.27 (2.98) 0.53 (4.17) 0.00 (0.00) 0.27 (2.98) 0.53 (4.17) 0.27 (2.98) 0.00 (0.00) 0.18 (2.43) T2 1.33 (6.55) 0.80 (5.13) 0.80 (4.13) 0.98 (5.71) 0.53 (4.17) 0.80 (5.13) 0.27 (0.71) 0.53 (4.17) 0.00 (0.00) 0.00 (0.00) 0.00 (0.00) 0.00 (0.00) 0.00 (0.00) 0.00 (0.00) 0.00 (0.00) 0.00 (0.00) T3 1.33 (6.55) 0.80 (5.13) 0.27 (1.71) 0.80 (5.13) 0.80 (5.13) 0.00 (0.00) 0.00 (0.00) 0.27 (2.98) 0.27 (2.98) 0.00 (0.00) 0.00 (0.00) 0.09 (0.00) 0.00 (0.00) 0.00 (0.00) 0.00 (0.00) 0.00 (0.00) T4 1.07 (5.74) 1.07 (5.74) 0.53 (3.42) 0.89 (5.41) 0.00 (0.00) 0.80 (5.13) 0.00 (0.00) 0.27 (2.98) 0.00 (0.00) 0.00 (0.00) 0.00 (0.00) 0.00 (0.00) 0.00 (0.00) 0.00 (0.00) 0.00 (0.00) 0.00 (0.00) T5 1.87 (7.71) 0.80 (5.13) 0.00 (0.00) 0.89 (5.41) 0.80 (5.13) 0.53 (4.17) 0.00 (0.00) 0.44 (3.80) 0.00 (0.00) 0.27 (2.98) 0.00 (0.00) 0.00 (0.00) 0.27 (2.98) 0.27 (2.98) 0.00 (0.00) 0.18 (2.43) T6 1.33 (6.55) 0.80 (5.13) 0.00 (0.00) 0.71 (4.83) 0.27 (2.98) 0.80 (5.13) 0.00 (0.00) 0.36 (3.44) 0.00 (0.00) 0.00 (0.00) 0.00 (0.00) 0.00 (0.00) 0.00 (0.00) 0.00 (0.00) 0.00 (0.00) 0.00 (0.00) T7 1.60 (7.27) 0.53 (4.17) 0.00 (0.00) 0.71 (4.83) 0.27 (2.98) 0.00 (0.0) 0.00 (0.00) 0.09 (0.00) 0.00 (0.00) 0.00 (0.00) 0.00 (0.00) 0.00 (0.00) 0.00 (0.00) 0.00 (0.00) 0.00 (0.00) 0.00 (0.00) T8 0.80 (5.13) 0.80 (5.13) 0.00 (0.00) 0.53 (4.17) 0.00 (0.00) 0.27 (2.98) 0.00 (0.00) 0.09 (0.00) 0.00 (0.00) 0.27 (2.98) 0.00 (0.00) 0.09 (0.00) 0.00 (0.00) 0.00 (0.00) 0.00 (0.00) 0.00 (0.00) T9 1.33 (6.55) 0.80 (5.13) 0.27 (1.71) 0.80 (5.13) 0.53 (4.17) 0.53 (4.17) 0.00 (0.00) 0.35 (3.39) 0.27 (2.98) 0.00 (0.00) 0.00 (0.00) 0.00 (0.00) 0.00 (0.00) 0.00 (0.00) 0.00 (0.00) 0.00 (0.00) SE. +- 1.65 1.42 1.25 0.80 2.02 1.69 0.75 0.02 0.98 1.03 0.00 0.67 1.01 0.78 0.00 0.55 C.D. @ 5% NS NS NS NS NS NS NS NS NS NS NS NS NS NS NS NS Table 4: Effects of different bio-inoculants on growth parameters of the one year mango grafts. (Pooled Mean) experiment.
| Tr. No. | Treatments | Grafts survival (%) | — | — | — |
|---|---|---|---|---|---|
| 21-22 | 22-23 | 23-24 | Pooled Mean | ||
| T1 | Potting mixture alone | 53.00 | 56.00 | 52.00 | 53.67 |
| T2 | Potting mixture + Beijerinckia 50 g | 59.17 | 59.01 | 62.80 | 60.33 |
| T3 | Potting mixture + PSB 50 g | 57.20 | 59.67 | 59.00 | 58.62 |
| T4 | Potting mixture + Talc based Trichoderma 50 g | 55.07 | 57.00 | 54.00 | 55.36 |
| T5 | Potting mixture + Beijerinckia 50 g 50 g + PSB 50 g + Talc based Trichoderma 50 g | 61.73 | 60.85 | 62.00 | 61.53 |
| T6 | T2 + Spraying of Trichoderma (Spore formulation) 3 times at 2 months interval @ 1 g/10 L | 58.67 | 58.67 | 60.67 | 59.33 |
| T7 | T3 + Spraying of Trichoderma (Spore formulation) 3 times at 2 months interval @ 1 g/10 L | 55.67 | 59.20 | 59.67 | 58.25 |
| T8 | T4 + Spraying of Trichoderma (Spore formulation) 3 times at 2 months interval @ 1 g/10 L | 57.67 | 58.00 | 50.00 | 55.22 |
| T9 | T5 + Spraying of Trichoderma (Spore formulation) 3 times at 2 months interval @ 1 g/10 L | 62.00 | 62.27 | 64.00 | 62.76 |
| SE. +- | 0.84 | 0.95 | 0.79 | 1.26 | |
| C.D. @ 5% | 2.53 | 2.84 | 2.37 | 3.78 |
Table text extracted from the original PDF; superscript letters are shown inline. The original table image is below.
View original table image
Results And Discussion
The results of this experiment indicated that all the treatments shows non-significant effect on anthracnose of mango grafts. This shows that the treatment containing Trichoderma application in talc as well as spore form does not effective in controlling Anthracnose disease of mango. This may be due the very low incidence of anthracnose disease on mango grafts and also the non-effectiveness of Trichoderma in very hot condition. This has been supported by Mahfouz, M.M et al. 2020 [1] who stated that biocontrol agents are sometime ineffective in controlling the diseases due the adverse climatic conditions.
However the survival percentage of mango grafts is higher in treatment containing Trichoderma application in both spore as well as in Talc form. This may be due to the better efficacy of Trichoderma in controlling wilt disease in plant (Renata A.S.B. 2020) [3]
Conclusion
This shows that Trichoderma is not effective in managing the anthracnose disease of mango grafts but effective in increasing the survivability of the mango grafts.
Acknowledgement
Authors are thankful to the Associate Director of Research Regional Fruit Research Station, Vengurla Maharashtra, India for providing the mango grafts to carry out
References
5 in the original paper- Mahfouz MMA, Abd-Elgawad MM, Askary TH. Factors affecting success of biological agents used in controlling the plant-parasitic nematodes. Egypt J Biol Pest Control. 2020;30(17):01-09.
- Niazi M, Karuna K, Somashekar YM, Padmashri HS. Evaluation of botanicals and bio-agents against Colletotrichum gloeosporioides (Penz.) Penz. and Sacc. causing anthracnose of mango. Mysore J Agric Sci. 2022;56(4):277-288.
- Renata ASB, Gilcianny C, Vinicius S. Trichoderma species show biocontrol potential against Ceratocystis wilt in mango plants. Biol Control. 2020;10:1007. doi:10.1007/s10526-020-1007-x.
- Matumwabirhi K. Effectiveness of Trichoderma Spp., Bacillus Spp. and Pseudomonas fluorescens in the management of early blight of tomatoes (Doctoral dissertation, University of Nairobi). 2020
- Maheswari KS, Das S, Kurapati R, Baskaran RM, Mooventhan P, Ghosh PK. Green Technologies for Sustainable Management of Invasive and Transboundary Pests. National Institute of Agricultural Extension Management (MANAGE); 2023. Tr. No. Treatments Grafts survival (%) 21-22 22-23 23-24 Pooled Mean T1 Potting mixture alone 53.00 56.00 52.00 53.67 T2 Potting mixture + Beijerinckia 50 g 59.17 59.01 62.80 60.33 T3 Potting mixture + PSB 50 g 57.20 59.67 59.00 58.62 T4 Potting mixture + Talc based Trichoderma 50 g 55.07 57.00 54.00 55.36 T5 Potting mixture + Beijerinckia 50 g 50 g + PSB 50 g + Talc based Trichoderma 50 g 61.73 60.85 62.00 61.53 T6 T2 + Spraying of Trichoderma (Spore formulation) 3 times at 2 months interval @ 1 g/10 L 58.67 58.67 60.67 59.33 T7 T3 + Spraying of Trichoderma (Spore formulation) 3 times at 2 months interval @ 1 g/10 L 55.67 59.20 59.67 58.25 T8 T4 + Spraying of Trichoderma (Spore formulation) 3 times at 2 months interval @ 1 g/10 L 57.67 58.00 50.00 55.22 T9 T5 + Spraying of Trichoderma (Spore formulation) 3 times at 2 months interval @ 1 g/10 L 62.00 62.27 64.00 62.76 SE. +- 0.84 0.95 0.79 1.26 C.D. @ 5% 2.53 2.84 2.37 3.78