
Research article · 2025 · Full text
International Journal of Agriculture and Food ScienceExploring genetic variability, heritability, and genetic advance in Indian mustard (Brassica juncea L.) for yield improvement
Volume 7(4) · Pages 240–243 · DOI: 10.33545/2664844x.2025.v7.i4c.357 ↗
Research areasNitrogen and Sulfur Effects on BrassicaPlant Micronutrient Interactions and Effects
Abstract
Author-writtenA field experiment was conducted during rabi season of 2022-23 at Agricultural Research Farm, Department of Plant Breeding and Genetics, R.B.S. College, Bichpuri, Agra, (U.P.). The investigation entitled “Study of genetic variability and character association in Indian mustard (Brassica juncea (L.) Czern & Coss). The variables involves in this study was 30 genotypes of Indian mustard (Brassica juncea L.). Thus in all Thirty (30) Genotypes treatment combinations were compared in a Randomized Block Design with three replications. The results revealed that the significant genetic variability was observed among the genotypes for all studied traits. Heritability ranged from moderate to high, and genetic advance indicated substantial additive genetic variance. These findings provide essential insights for enhancing yield and associated traits through effective selection in breeding programs.
Summary
Source-checkedPlain-language reading of the full paper, prepared with AI and checked against the text. Each point links to the authors' own words.
Why it matters
- Indian mustard is a critical oilseed crop for India's economy, ranking second only to groundnut. View evidence ↗
- Mustard oil serves as the primary cooking oil in the regions where the crop is grown. View evidence ↗
- Genetic variability is essential for improving crops through systematic breeding programs. View evidence ↗
The question
- The study aimed to investigate genetic variability and character association in Indian mustard. View evidence ↗
What they did
- The field experiment took place during the 2022-23 rabi season at the Agricultural Research Farm in Agra, Uttar Pradesh. View evidence ↗
- The researchers compared 30 genotypes of Indian mustard using a Randomized Block Design with three replications. View evidence ↗
- Twelve metric traits were measured, including plant height, seed yield per plant, and harvest index. View evidence ↗
What they found
- Phenotypic coefficients of variability were higher than genotypic coefficients for all traits, suggesting that the environment significantly influences trait expression. View evidence ↗
- Heritability estimates varied from a low of 37.71% for days to maturity to a high of 94.75% for harvest index. View evidence ↗
- Genetic advance as a percentage of the mean ranged from 1.60% for days to maturity to 23.11% for harvest index. View evidence ↗
- Harvest index and 1000-seed weight exhibited both high heritability and high genetic advance, making them ideal targets for selection. View evidence ↗
- Moderate heritability combined with low genetic advance for primary and secondary branches suggests that non-additive gene action influences these traits. View evidence ↗
What it means
- The authors concluded that biological yield and seed yield are critical traits for improving productivity due to their high heritability and genetic advance. View evidence ↗
- The study recommends selecting traits with strong genetic influence to develop high-yielding varieties to improve farmer profitability and sustainability. View evidence ↗
- The authors suggest that future research should incorporate molecular approaches to complement traditional breeding for better crop improvement. View evidence ↗
Visual summary
2 visualsIllustrations explain the paper; charts are replotted from the paper's own table values.
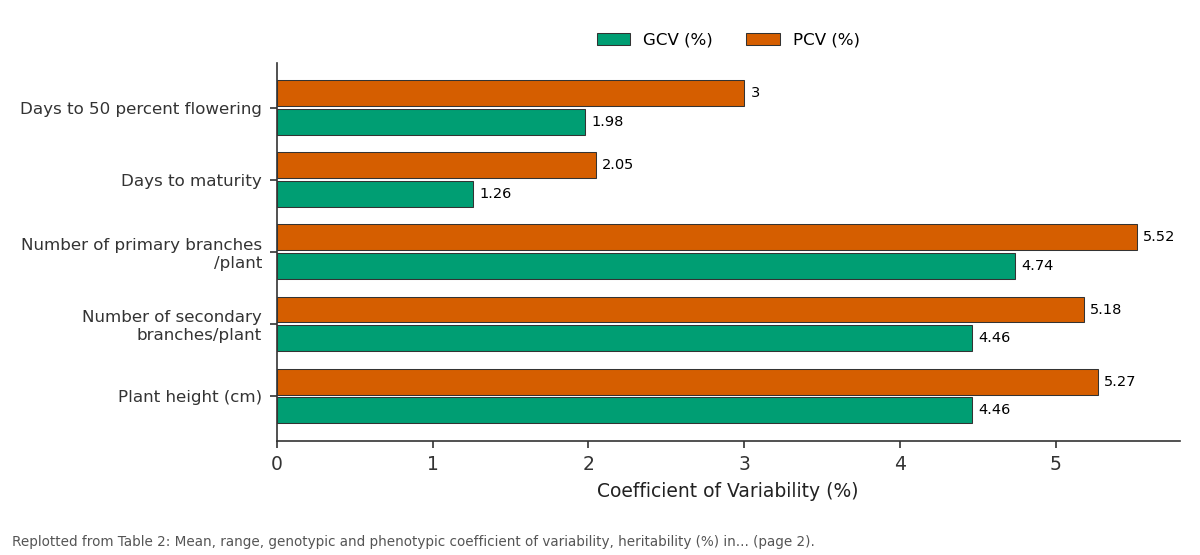
GCV (%) and PCV (%): Days to 50 percent... vs Days to maturity vs Number of primary... vs Number of secondary... vs Plant height (cm)
Replotted from Table 2 (page 2) of the original paper. Every bar is the paper's own table value.
View source evidence ↗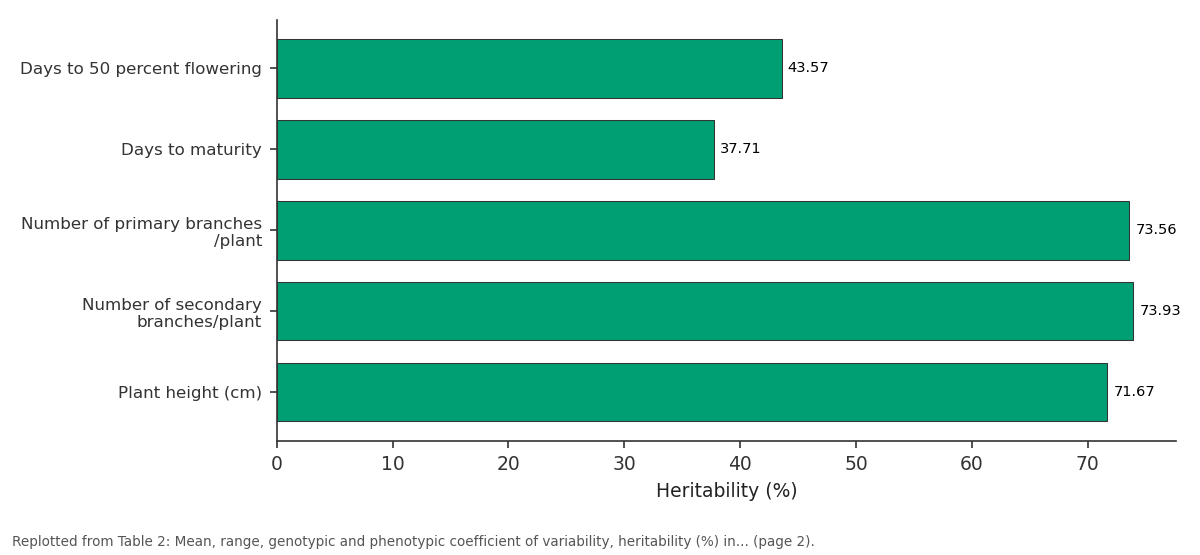
Heritability (%): Days to 50 percent... vs Days to maturity vs Number of primary... vs Number of secondary... vs Plant height (cm)
Replotted from Table 2 (page 2) of the original paper. Every bar is the paper's own table value.
View source evidence ↗Figures & tables
From the original paper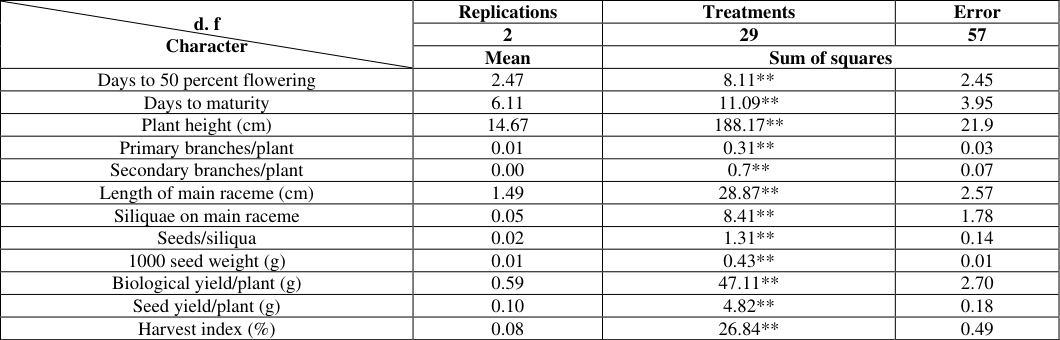 Table 1
 Table 2
Introduction
Indian mustard (Brassica juncea L.) is a vital oilseed crop, second only to groundnut in India, contributing significantly to the economy. Enhancing yield and quality traits demands a clear understanding of genetic variability, heritability, and genetic advance. Rapeseed and mustard oil is used primarily for edible purposes and is the principle cooking oil in the mustard growing area of the country. Known for its great taste and subtle flavor, this vegetable oil is the world's second leading source of protein meal. Besides seeds, it is used as condiments. The meal cake left after oil extraction forms important cattle feed and may also be used as organic manure. The economically valuable product is grain, which is used for food and feed, but also for industrial processing. (Singh et al., 2024) [17] . But over the past few centuries, human activity particularly since the industrial revolution has significantly altered the makeup of the atmosphere. In spite of a changing climate, climate-resilient agronomy aims to maintain sustainable food production and stable livelihoods for farmers. (Singh et al., 2023). One of the biggest obstacles to raising the commercial yield of crops is the current increase in fertilizer prices. Therefore, measures to reduce its losses and improve its economic utilization are required (Lokendra et al., 2024) [10] . The availability of genetic variability is the basic pre-requisite for genetic improvement through systematic breeding programme. Nature always favours the plant having much variability in terms of prominences and adaptation across year and location. It is true that more diverse plants greater the chances of obtaining high heterosis improvement. Selection and hybridization technique are frequently used for improving genetic constitution of a genotype. The knowledge of the extent of existing genetic variability and character association are important to carry out an efficient selection programme. The problem of increasing the yield can be tackled effectively on the basis of the performance of yield components and selection for closely related characters. Grain yield as a complex character and is dependent upon the sum total of many genes. Presently, development of new varieties for higher yields has reached a plateau and no further increase is achieved unless biotechnological interventions are made. (Archna, et al., 2023) [2] .
Materials and Methods
The study was conducted on 30 genotypes, viz. Radhika, Girraj, RH725, RH-761, DRMR-150-35, RH -406, PPM -25, PM -27, RGN-73, Pusha tarak, Kranti, Geeta, Pusha bold, RH-0749, KRISHNA, DRMR-31, NRCHB-101, PUSHA MAHAK, NRCHB-02, CS-60, CS-56, ASHIRWAD, RGN-48, Maga, Pusha vijay, Bhagirathi, Seeta, Pusha Jay Kishan, NRCDR-601, RH-30 of Indian mustard at the R.B.S. College, Agra, during the 2022-23 rabi season. These genotypes were made available from the DRMR, Bharatpur (Rajsthan). The material was sown in Randomized Block Design with three replications. These Mustard genotypes were sown with spacing of 0.45 m row to row and 0.15 m plant to plant. Observations were recorded on 12 metric traits (days to 50% flowering, days to maturity, plant height (cm), primary branches per plant, secondary branches per plant, length of main raceme, siliquae on main raceme, seeds per siliqua, 1000-seed weight (g), biological yield per plant (g), seed yield per plant (g) and harvest index (%). Five competitive plant from each plot were randomly selected for recording observation for all the quantitative characters expect days to 50 % flowering and days to maturity, which were recorded on the plot basis. The variability present in the population was estimated by measure mean, phenotypic & genotypic variance and coefficient of variation. The phenotypic & genotypic variation and genotypic and phenotypic coefficient and heritability in board sense were estimated using formula of Burton and Lu Vane (1953).
Results and Discussion
Results and Discussion
Analysis of variance
The analysis of variance for the randomized block design used for the 30 genotypes was done for different characters and is presented in; (ANOVA Table 1).The variance analysis showed that the genotypes differ significantly among themselves for all the characters in study, indicating the presence of adequate variability. Among the varieties taken for experimentation. Success of any plant breeding programme largely depends upon the genetic variability existing in crops. The mean value of any populations sample provides on idea about the center of variability of any traits. While, the range of traits provides maximum and minimum limits of the variable genotypes. The genotypic coefficient of variation measures the range of variability available in the crop and also enables to compare the amount of variability present among different characters. In the present study, the extent of variability was examined in 30 strains/varieties of Indian mustard for 12 characters. In general, phenotypic coefficient of variability was higher than genotypic coefficient of variability for all the characters which higher indicate that environment play a considerable role in the expression of these traits. On general phenotypic coefficient of variation was weighs that genotypic coefficient of variation. The result indicated that breeders have opportunely for selection of desirable plants through the characters Hervey higher magnitude of PCV / GCV. The estimates of phenotypic and genotypic coefficient of variability for most of the characters under study are in accordance with earlier reports, Pant and Singh (2001) [12] , Rai et al. (2005) [15] , Singh et al. ( 2007) [19] , Yadav et al. (2012) [22] , Devi (2018) [7] and Harish et, al., (2023) [8] , Singh et al., 2024 [17] , Virendra, et al., (2024) [21] . The mean performance range, mean CV PCV, GCV, heritability and genetic advance over 30 genotypes for various characters are presented in Table 2. The plant height recorded the maximum range of variation followed by biological yield, length of main raceme, siliqua on main receme and seed yield per plant while it was minimum in case of no. of primary branches per plant. The moderate estimates (>10%) of phenotypic coefficient of variability (11.84%) and genotypic coefficient of variability (11.53%) were observed for harvest index followed by1000 seed weight. The lowest estimates (<5%) phenotypic coefficient of variability (2.05%) and genotypic coefficient of variability (1.26%) observed for days of maturity. Heritability estimates ranged from 70% to 92%, with the highest observed in 1000-seed weight. Gene action and may be exploited directly in selection The heritability gives an idea of transmissibility of characters from parent to offspring. The heritability estimates in broad sense were computed for all the characters and have been presented in [11,14,9,3,17] . Moderate heritability together with low genetic advance was noticed for1000 seed weight, primary branch per plant, secondary branch per plant. This obviously indicates the role of non-additive gene action for inheritance of these characters. It is concluded that any improvement in these characters is possible only when hybridization programme is initiated and the inheritance of these characters is well established.
| Genotypes | Range | — | Mean | C.V. % | GCV (%) | PCV (%) | Heritability (%) | G.A. | G.A. as % mean |
|---|---|---|---|---|---|---|---|---|---|
| Min | Max | ||||||||
| Days to 50 percent flowering | 63 | 75 | 69.52 | 0.63 | 1.98 | 3.00 | 43.57 | 1.87 | 2.69 |
| Days to maturity | 115 | 128 | 122.47 | 0.34 | 1.26 | 2.05 | 37.71 | 1.95 | 1.60 |
| Number of primary branches /plant | 5 | 8 | 6.42 | 1.56 | 4.74 | 5.52 | 73.56 | 0.54 | 8.37 |
| Number of secondary branches/plant | 8 | 13 | 10.27 | 1.11 | 4.46 | 5.18 | 73.93 | 0.81 | 7.90 |
| Plant height (cm) | 145 | 180 | 166.84 | 1.49 | 4.46 | 5.27 | 71.67 | 12.98 | 7.78 |
Table text extracted from the original PDF; superscript letters are shown inline. The original table image is below.
View original table image
| d. f Character | Replications | Treatments | Error |
|---|---|---|---|
| 2 | 29 | 57 | |
| Mean | Sum of squares | ||
| Days to 50 percent flowering | 2.47 | 8.11** | 2.45 |
| Days to maturity | 6.11 | 11.09** | 3.95 |
| Plant height (cm) | 14.67 | 188.17** | 21.9 |
| Primary branches/plant | 0.01 | 0.31** | 0.03 |
| Secondary branches/plant | 0.00 | 0.7** | 0.07 |
| Length of main raceme (cm) | 1.49 | 28.87** | 2.57 |
| Siliquae on main raceme | 0.05 | 8.41** | 1.78 |
| Seeds/siliqua | 0.02 | 1.31** | 0.14 |
| 1000 seed weight (g) | 0.01 | 0.43** | 0.01 |
| Biological yield/plant (g) | 0.59 | 47.11** | 2.70 |
| Seed yield/plant (g) | 0.10 | 4.82** | 0.18 |
| Harvest index (%) | 0.08 | 26.84** | 0.49 |
Table text extracted from the original PDF; superscript letters are shown inline. The original table image is below.
View original table image
The genetic advance gives an idea of expected improvement through selection in the next generation. The higher estimate of genetic advance along with higher heritability clearly indicates the possibility of improvement through selection. [4,17,13,6,1,5,7,23] .
Conclusion
The study on Indian mustard (Brassica juncea L.) provides valuable insights into the genetic variability, heritability, and genetic advance. Results revealed that significant variability among the 30 genotypes studied, with high heritability (up to 94.75% for harvest index) and substantial genetic advance for traits like 1000-seed weight and harvest index. The study confirmed that traits with high heritability and genetic advance, such as biological yield and seed yield, are critical for improving mustard productivity. The observed genetic parameters provide a robust foundation for breeders to focus on traits with potential for significant yield improvement. This research underscores the importance of selecting traits with strong genetic influence to develop high-yielding varieties, contributing to sustainable mustard cultivation and improved farmer profitability. Future studies could explore molecular approaches to complement traditional breeding methods and achieve even greater advances in crop improvement.
References
21 in the original paper- Amit S, Ram Avtar, Dhiraj Singh, Sangwan O, Balyan P. Genetic variability, character association and path analysis for seed yield and component traits under two environments in Indian mustard. J Oilseed Brassica. 2013;4(1):43-48.
- Archna K, Singh V, Kumar H, Singh R. Optimization of NPK fertilization in conjunction with Plant Growth Regulators (PGRs) affecting productivity and profitability of wheat (Triticum aestivum L.). J Rural Agric Res. 2023;23(2):56-60.
- Babu S, Singh V. Impact of Kinnow production on the socio-economic conditions of farmers in the Agra region. Asian Res J Agric. 2024;17(4):652-661. https://doi.org/10.9734/arja/2024/v17i4572
- Babu S, Singh V. Soil and agro-climatic suitability for Kinnow cultivation: A case study of the Agra region. Asian J Res Crop Sci. 2024;9(4):248-254. https://doi.org/10.9734/ajrcs/2024/v9i4314
- Bind D, Singh D, Dwivedi VK. Genetic variability and character association in Indian mustard [Brassica juncea (L.) Czern & Coss]. Agric Sci Digest. 2014;34(3):183-188.
- Choudhary VK, Rakesh Kumar, Sah JN. Variability studies in Indian mustard. J Appl Biol. 2003;13(1/2):912.
- Devi B. Correlation and path analysis in Indian mustard (Brassica juncea (L.)) in agro-climatic conditions of Jhansi (U.P.). Electron J Plant Breed. 2018;1(4):407413.
- Harish K, Virendra S, Sonia. Integrated farming system for sustainable agriculture in present scenario. In: Practice of Recent Advances in Global Agriculture International Journal of Agriculture and Food Science https://www.agriculturaljournals.com Technology and Innovation (PRAGATI-2023);
- Karan S, Singh RB, Singh V. Effect of nano-nitrogen fertilization on yield attributes and yield of barley (Hordeum vulgare L.). J Rural Agric Res. 2023;23(2):87-90.
- Lokendra PS, Virendra S, Vishal G, Harish K, Karan S, Mohd A, et al. Improvement of productivity and profitability in wheat by nitrogen and bio-fertilizer in north western plain zone. Int J Res Agron. 2024;7(1):289-292.
- Mahak Singh, Srivastava RL, Lalta Prasad, Dixit RK. Studies on heritability and genetic advance in Indian mustard [Brassica juncea (L.) Czern and Coss.]. Adv Plant Sci. 2003;16(1):263-266.
- Pant SC, Singh P. Genetic variability in Indian mustard. Agric Sci Digest. 2001;21(1):28-30.
- Poonam, Singh DN, Chakraborty M. Variability, heritability and genetic advance in Indian mustard (Brassica juncea L.). Crop Res (Hisar). 2003;23(3):517-521.
- Priyamedha, Singh VV, Chauhan JS, Meena ML, Mishra DC. Correlation and path coefficient analysis for yield and yield components in early generation lines of Indian mustard (Brassica juncea L.). Curr Adv Agric Sci. 2013;5(1):37-40.
- Rai SK, Verma A, Pandey DD. Genetic variability and character association analysis in Indian mustard (Brassica juncea (L.) Czern and Coss.). Ann Agric Biol Res. 2005;10(1):29-34.
- Shubham KS, Geetam S, Mishra MN, Rohit, Virendra S. Studies on genetic variability, heritability, genetic advance, correlation in barley. Int Res J Mod Eng Technol Sci. 2023;5(6):4491-4496. https://doi.org/10.13140/RG.2.2.28841.20326
- Singh R, Kumar R, Singh AC, Babu S, Kumar J, Singh K, Singh V. Effect of silicon application and irrigation scheduling on productivity and profitability of barley (Hordeum vulgare L.). J Rural Agric Res. 2024;24(1):49-53.
- Singh R, Singh S, Singh V, Kumar H, Singh K, Kumar J. Impact of nano-nitrogenous fertilization on productivity and profitability of barley (Hordeum vulgare L.). J Rural Agric Res. 2024;24(1):110-114.
- Singh SK, Singh AK, Kumar K. Genetic variability for yield and its components in Indian mustard (Brassica juncea L. Czern & Coss.). New Botanist. 2007;34(1/4):147-150.
- Virendra Singh, Harish Kumar, Sonia. Precision farming with nanotechnology. Presented at: NextGeneration Agriculture for Sustainable Environment & One Health (NASEH-2024); 2024 Feb; Swami Vivekanand Subharti University, Meerut (UP), India.
- Kumar S, Miller LH, Quakyi IA, Keister DB, Houghten RA, Maloy WL, et al. Cytotoxic T cells specific for the circumsporozoite protein of Plasmodium falciparum. Nature. 1988 Jul 21;334(6179):258-260.