
Research article · 2022 · Full text
International Journal of Agriculture and Food ScienceAgricultural surplus production and establishment of agro-based industries are indicators of rural development: A case study of Sonipat District, Haryana
Volume 4(2) · Pages 66–69 · DOI: 10.33545/2664844x.2022.v4.i2a.199 ↗
Research areasAgricultural Economics and PracticesAgricultural risk and resilience
Abstract
Author-writtenAgriculture occupies the most vital part in the Indian economy and it is the prime resource of the nation. In present study main attention is focused on agricultural surplus production & establishment of agro-based industries for analyzing the indicators of rural development in the study area. Agricultural surplus production is key to agricultural based industrial development and which leads to rural development. Rural population and crops grown have deep rooted relationships. So, surplus agricultural production has been calculated on rural population of study area. As food crops provides the maximum calories in the human diet, nine food crops have been selected for the present study, which are rice, bajra, maize, wheat, barley, gram, pulses other than gram, fruits & vegetables and sugar cane. The food crops were converted into calories according to nutritive values of Indian food, worked by the Indian Council of Medical Research, Hyderabad. The total per capita surplus calories has been calculated in simple manner, calories other than food crops like milk etc. has been left out for calculating the surplus per capita calories. Thus only 1982 calories, the standard requirements of per capita are taken into account for surplus calories. The study area has surplus per capita calories supplied by total food crops in 1970-71 was 2685.34, which increased to 4758.34 in 2000-01 and shows a 77.23% positive change. Crop rising not only significantly contributes to the basket of agricultural products to feed the people but it provides raw material to many industries called agro–based industries.The establishment of agro-based industries is the indicator of rural development. In recent years Haryana has emerged as one of the most progressive state of India in the field of agriculture. The study area is a part of Haryana state, dominated by agriculture and plenty of raw materials is available for agro-based industries. In the study area industrial development is mainly based on agro-based industries.An increase of more than 400% has been noticed in establishment of agro-based industries & same trend found persons were engaged in these industries from 1970-71 to 2000-01 in the Sonipat district. The major objective of this study is to assess the role of agricultural surplus production & establishment of agro-based industries in rural development in the study area. The present study has been brought out with a view to draw the attention of the authorities concerned on above same.
Summary
Source-checkedPlain-language reading of the full paper, prepared with AI and checked against the text. Each point links to the authors' own words.
Why it matters
- Agriculture is the most vital part of the Indian economy and serves as the nation's prime resource. View evidence ↗
- Surplus agricultural production is considered a key driver for the development of agro-based industries, which in turn leads to rural development. View evidence ↗
- The establishment of industries based on agriculture is used as an indicator of rural development. View evidence ↗
The question
- The study aims to assess how agricultural surplus production and the establishment of agro-based industries contribute to rural development in the Sonipat District. View evidence ↗
What they did
- The research focuses on the Sonipat district in Haryana, which covers 2130.81 square kilometers (4.82% of the state's total area). View evidence ↗
- To measure surplus, the study selected nine food crops (rice, bajra, maize, wheat, barley, gram, other pulses, fruits & vegetables, and sugar cane) based on their caloric contribution to the human diet. View evidence ↗
- A standard requirement of 1982 calories per capita was used as the baseline to calculate surplus calories. View evidence ↗
What they found
- Total surplus per capita calories increased from 2685.34 in 1970-71 to 4758.34 in 2000-01, representing a 77.23% positive change. View evidence ↗
Visual summary
3 visualsIllustrations explain the paper; charts are replotted from the paper's own table values.
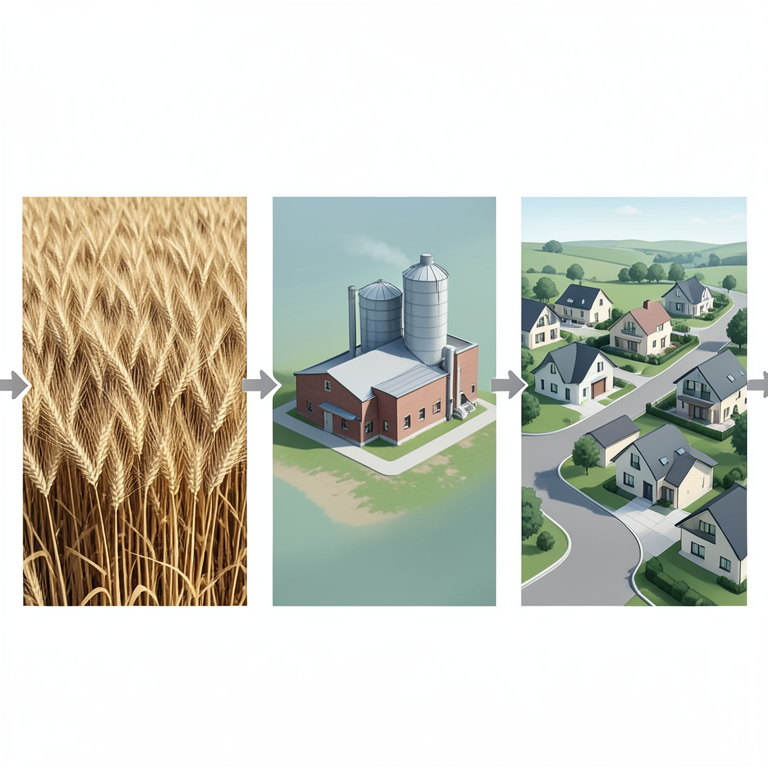
Rural Development Cycle
AI-generated conceptual illustration (Wheat fields and a small-scale flour mill factory in a rural landscape). It explains the idea and does not show study data.
View source evidence ↗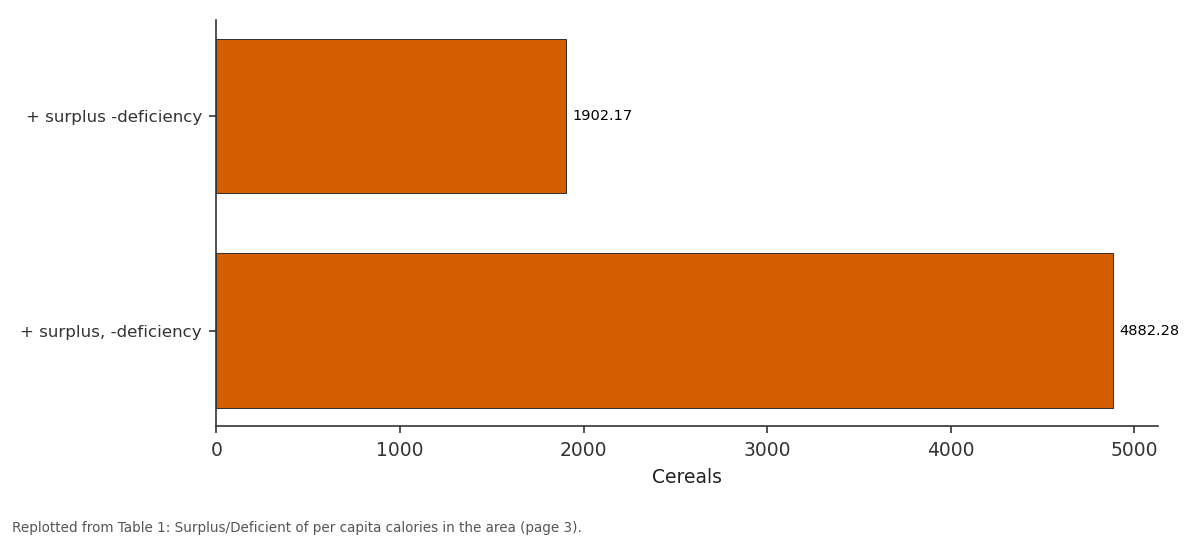
Cereals: + surplus -deficiency vs + surplus, -deficiency
Replotted from Table 1 (page 3) of the original paper. Every bar is the paper's own table value.
View source evidence ↗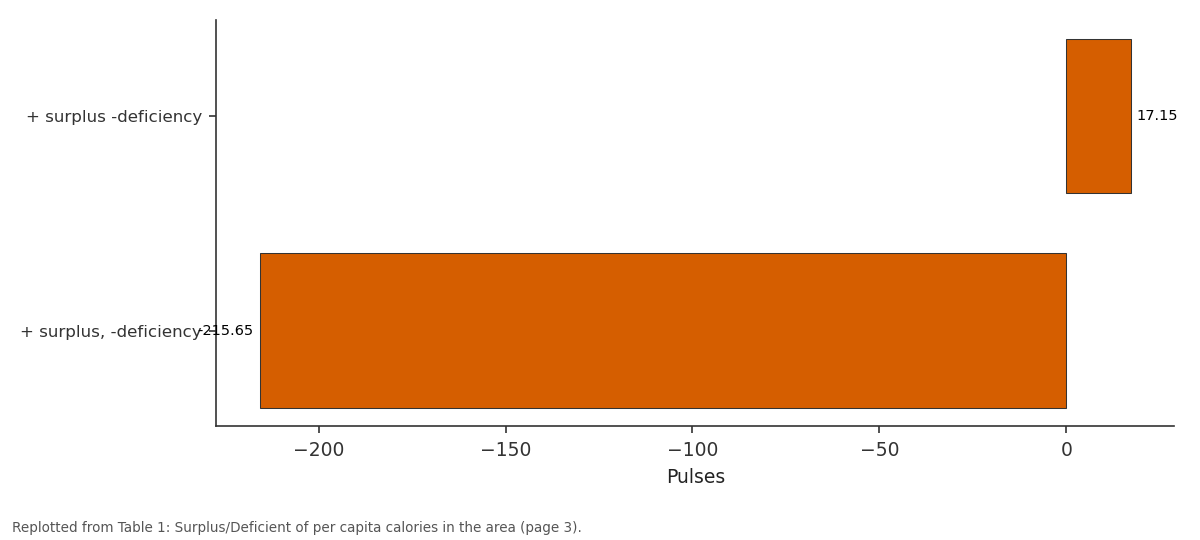
Pulses: + surplus -deficiency vs + surplus, -deficiency
Replotted from Table 1 (page 3) of the original paper. Every bar is the paper's own table value.
View source evidence ↗Figures & tables
From the original paper Table 1
 Table 2
Introduction
In recent years the strategy of rural development planning is attaining greater importance. The rural development may be defined as a process of enabling the villagers to fulfill their needs especially, physical, economical, social and intellectual (Garg and Jindal, 1989) [2] . The emphasis on rural development in India is understandable. About half a century ago, Ghandi Ji, said, "India lives in villages" and Ch. Charan Singh, said," India development path passes through villages". Thus it is true even today. So, rural development has recently become a fashionable slogan for national as well as state government. Rural development is a multi-dimensional activity for enrichment of the quality of life in rural areas. In recent years Haryana has emerged as one of most progressive state of India. There is an illegitimate aspiration of people in rural areas to improve there standard of living and share fruits of development. In this paper an attempt has been made to analyses the role of agricultural surplus production & establishment of agro-based industries in rural development in the study area i.e. Sonipat district.
Study Area
The study area Sonipat district, is a part of Upper Yamuna Plain which is composed of the deposition of the sediments brought down by Yamuna River. In the area elevations roughly vary between 213 to 235 meters above the mean sea level. The area is flat and has a master slope from north to south.
Objectives
The present study has been brought out with a view to draw the attention of the authorities concerned and help in future planning for rural development in the area. The major objectives of this study are as follows:-1. To interpret and to analyses the agricultural surplus production of 1970-71 and 2000-01 in the study area. 2. To assess the role of agricultural surplus production & establishment of agro-based industries in rural development in the study area.
Hypotheses
In order to fulfill the above said objectives, the following hypothesis has been proposed. The Sonipat District having agricultural surplus production and its play a major role to establishment of agro-based industries and rural development in the study area.
Data collection and methodology
Three main approaches to the geographical study of agriculture can be suggested namely, an ecological approach, the land utilization approach and a statistical approach. (Mc Master, 1962) [5] . The present context is based on a combination of the second and third approach. District level data has been utilized to interrogate the agricultural surplus production & establishment of agrobased industries in 1970-71 and 2000-2001 in the study area. Data analysis has been done both with the help of statistical tabulation. This analysis is based on secondary data, which have been collected from published and unpublished sources of various offices. The data in the study has been collected from District Statistical Office, Offices of Kangaroo of Sonipat, Ganaur, Kharkhoda and Gohana Tahsil and Office of Deputy Director Agriculture Sonipat.
Measurement of agricultural surplus production
Agricultural surplus production is key factor of rural development. According to Mahajan (2001) [4] , (a) the food surplus will help their (rural) reaching down to the poorest of the poor through putting them on productive jobs of capital formation; (b) raise their earning capacity by providing access to these surplus grains, which with enhanced purchasing power would no longer find it difficult to buy; (c) reduce their malnutrition level and thereby encourage them to lead more healthy and purposeful life (d) help the rural areas in creating essential capital assets, the absence of which is currently mainly responsible for their isolation as well as low farm productivity.
For the proper understanding of surplus agricultural production, the analysis of calories available from each crop is necessary. So, surplus agricultural production has been calculated on rural population of study area. The calculation and analysis of calories availability from each crop has been done on the basis of (1) their per hectare yield (ii) agricultural land occupancy (iii) 16.8 percent depreciation for seeds and wastage (Chakravarti, 1971) [1] (iv) the differential calorific value of each crop (v) surplus and deficit of calories available from cereals, pulses, fruits and vegetables and sugarcane. Cereals provide more than half of the calories of the human diet in underdeveloped world (world resources) and in the study area food crops provide maximum calories in the human diet (Table 1). So food crops production is the best indicator of agricultural development and the nutritional status of the whole population. An attempt is therefore made here to analyse the nutritional status of the people on the basis of major food crops. Nine food crops have been selected for the present study which, include rice, bajra, maize, wheat, barley, gram, pulses other than gram, fruits & vegetables and sugarcane. The food crops were converted into calories according to the nutritive values of Indian food worked out by the Indian Council of medical Research (Gopalan et al., 1977) [3] . The share of individual food crop in total calories available from different crops in the area is given in the Table no.1.
| Crops | Standard Requirement | 1970-71 | — | 2000-01 | — |
|---|---|---|---|---|---|
| Per capita calories available | + surplus -deficiency | Per Capita calories available | + surplus, -deficiency | ||
| Cereals | 1376 | 3278.17 | +1902.17 | 6258.28 | 4882.28 |
| Pulses | 239 | 256.15 | +17.15 | 23.35 | -215.65 |
| Fruits & vegetables | 272 | 26.16 | -245.84 | 78.38 | -193.62 |
| Sugarcane | 95 | 1106.86 | +1011.86 | 380.33 | +285.33 |
| Total | 1982 | 4667.34 | +2685.34 | 6740.34 | +4758.34 |
Table text extracted from the original PDF; superscript letters are shown inline. The original table image is below.
View original table image
Surplus/Deficit Pattern of Calories
To achieve a proper and true perspective of caloric position it is essential to analysis per capita daily availability of calories and suggested standard requirement of calories for different crops, so that a final balance sheet (Surplus/ Deficit) may be prepared. The study area record per capita daily available calories as 6740.34. It may be well compared with 2000 calories available in some villages of eastern U.P. which according to Shafi, (1960) is sufficient for nutrition. Stamp, (1960) advised 2460 calories a day or 900000 per capita per annum as standard nutrition unit. In the study area 2500 calories per capita per day (Gopalan, et al., 1977) [3] .
Have been taken into account as standard nutritional unit. Surplus/Deficit pattern of calories in the area has been given in the Table 1.
Figures and tables from the paper
| Size Category | 1970-71 | — | 2000-01 | — |
|---|---|---|---|---|
| No of units | No of Workers | No of units | No of Workers | |
| Large & medium (L & M) | 9 | 554 | 45 | 6400 |
| Small Scale Industries (SSI’s) including tiny and cottage units | 937 | 3867 | 5009 | 18746 |
Table text extracted from the original PDF; superscript letters are shown inline. The original table image is below.
View original table image
References
2 in the original paper- Chakravarti AK. Food grain sufficiency in India. Geogr Rev. 1971;60(2).
- Mahajan VS. Food surplus and rural capital formation. Yojana. 2001;45(2).