
Research article · 2025 · Full text
International Journal of Agriculture and Food ScienceDevelopment of artificial fertility gradient using fodder sorghum and its effect on soil nutrients, nutrient uptake and fodder yield
Volume 7(4) · Pages 56–59 · DOI: 10.33545/2664844x.2025.v7.i4a.342 ↗
Research areasCrop Yield and Soil FertilityBioenergy crop production and managementAgronomic Practices and Intercropping Systems
Abstract
Author-writtenFertilizers play a vital role in enhancing crop production, and optimizing their application is essential for achieving higher yields. This study examines the effects of an artificial fertility gradient on soil fertility, nutrient uptake, and fodder yield of sorghum (Sorghum bicolor) using the Inductive cum Targeted Yield Model. A field experiment was conducted at the N.M. College of Agriculture, Navsari Agricultural University, Gujarat, during the kharif 2022. The experimental site was divided into three strips with graded doses of nitrogen (N), phosphorus (P₂O₅), and potassium (K₂O): Strip I (N₀P₀K₀: 0-0-0 kg ha⁻¹), Strip II (N₁P₁K₁: 80-40-40 kg ha⁻¹), and Strip III (N₂P₂K₂: 160-80-80 kg ha⁻¹). Results indicated that fertilizer application significantly influenced soil fertility, nutrient uptake, and fodder yield. Post-harvest soil nutrient levels showed a considerable increase in Strip III compared to Strips I and II, confirming the creation of an artificial fertility gradient. Sorghum fodder yield was significantly higher in Strip III (29.87 t ha⁻¹), representing a 480% and 90.3% increase over Strips I and II, respectively. Nutrient uptake followed a similar trend, with maximum N, P, and K uptake observed in Strip III (75.55, 69.88, and 131.58 kg ha⁻¹, respectively). The findings demonstrate that higher fertilizer application enhances nutrient availability, uptake, and crop productivity. This study provides empirical evidence supporting targeted fertilization strategies for optimizing fodder sorghum production and improving soil fertility management.
Summary
Source-checkedPlain-language reading of the full paper, prepared with AI and checked against the text. Each point links to the authors' own words.
Why it matters
- Fertilizers are critical for increasing crop production, and applying them judiciously is necessary to achieve high yields. View evidence ↗
- Fodder sorghum is India's fourth most important cereal crop, with approximately 3.97 million hectares cultivated during 2023-2024. View evidence ↗
- Sorghum is a nutrient-demanding crop that significantly depletes soil nutrients, especially as its biomass yield increases. View evidence ↗
The question
- The study aimed to evaluate how an artificial fertility gradient strategy affects soil fertility, nutrient uptake, and the yield of fodder sorghum. View evidence ↗
What they did
- The field was divided into three strips with graded NPK doses: Strip I (0-0-0 kg ha⁻¹), Strip II (80-40-40 kg ha⁻¹), and Strip III (160-80-80 kg ha⁻¹). View evidence ↗
- For treatments II and III, all phosphorus and potassium were applied initially, while nitrogen was split with 50% at sowing and 50% at 30 days after sowing. View evidence ↗
- The fodder crop was harvested and the green fodder yield was assessed on the 60th day. View evidence ↗
What they found
- Nitrogen uptake increased progressively across the strips, reaching a maximum of 75.55 kg ha-1 in Strip III compared to 10.79 kg ha-1 in Strip I. View evidence ↗
- Phosphorus and potassium uptake also increased with higher fertilizer levels, peaking in Strip III at 69.88 kg ha-1 and 131.58 kg ha-1, respectively. View evidence ↗
What it means
- The authors conclude that applying different levels of NPK fertilizer successfully created an artificial soil fertility gradient. View evidence ↗
- The study found that crops grown within this artificial gradient showed significant differences in growth, yield, nutrient absorption, and soil nutrient levels. View evidence ↗
Visual summary
3 visualsIllustrations explain the paper; charts are replotted from the paper's own table values.
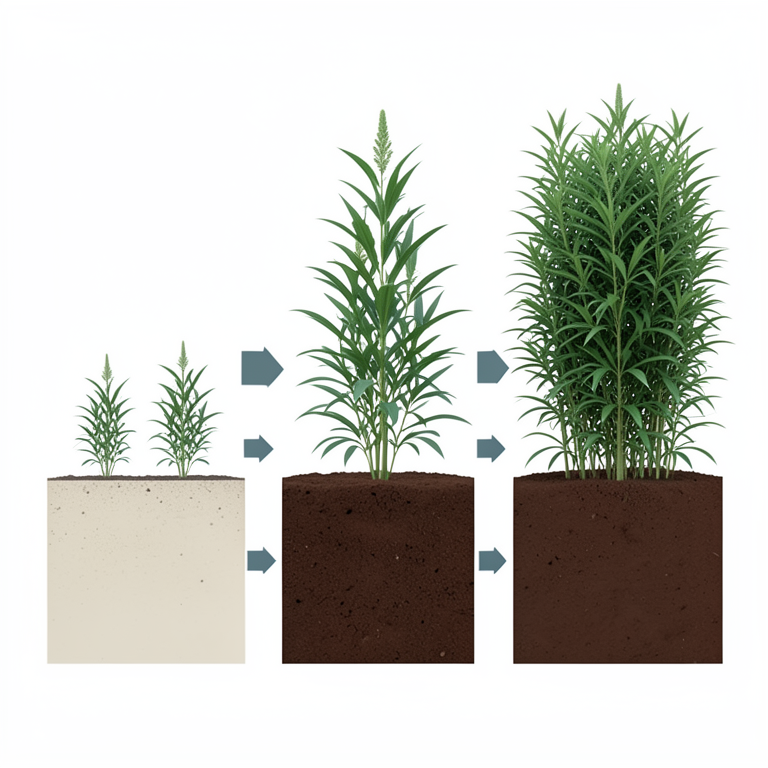
Artificial Fertility Gradient Concept
AI-generated conceptual illustration (fodder sorghum plants in soil strips). It explains the idea and does not show study data.
View source evidence ↗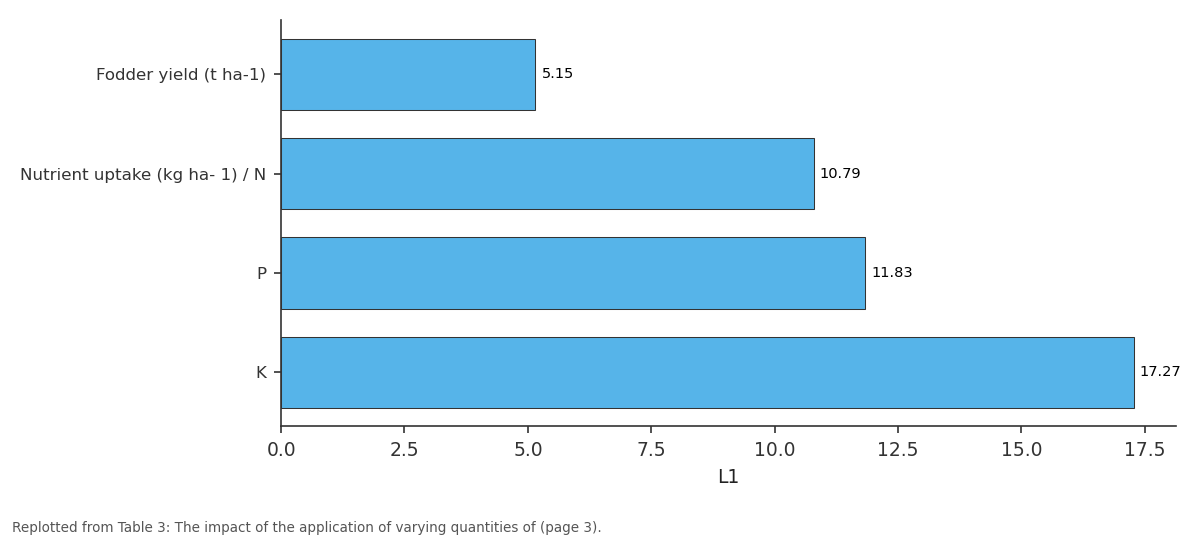
L1: Fodder yield (t ha-1) vs Nutrient uptake (kg ha-... vs P vs K
Replotted from Table 3 (page 3) of the original paper. Every bar is the paper's own table value.
View source evidence ↗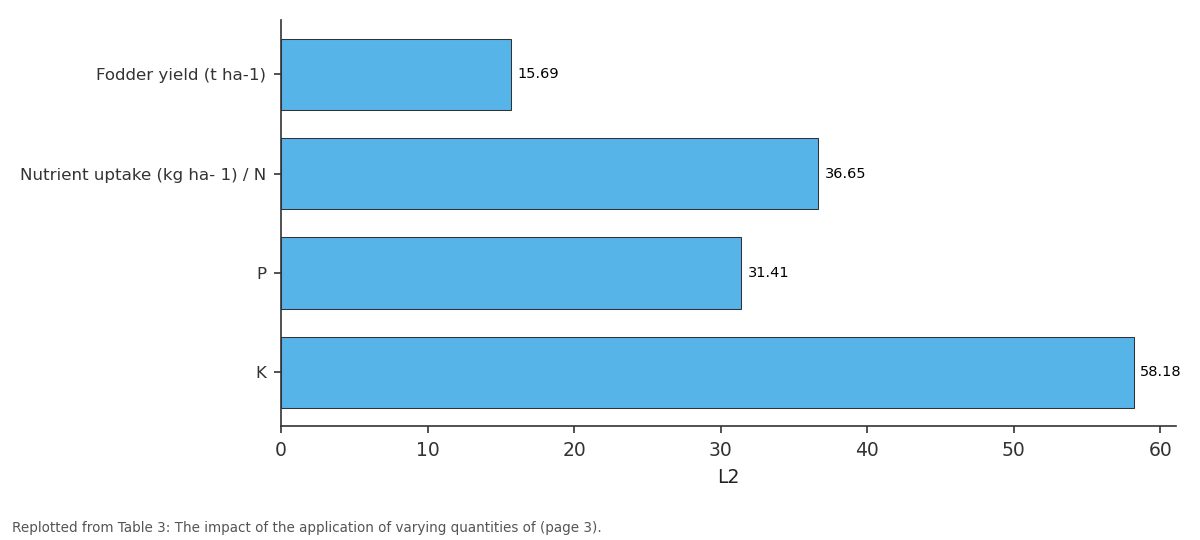
L2: Fodder yield (t ha-1) vs Nutrient uptake (kg ha-... vs P vs K
Replotted from Table 3 (page 3) of the original paper. Every bar is the paper's own table value.
View source evidence ↗Figures & tables
From the original paper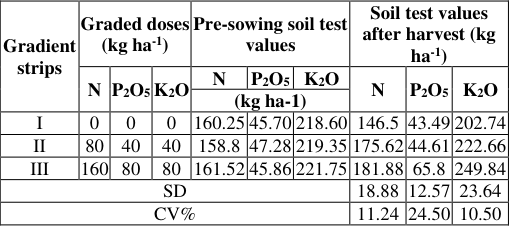 Table 2
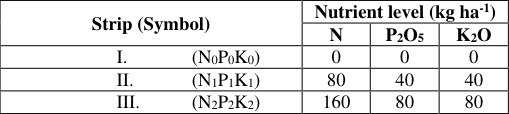 Table 1
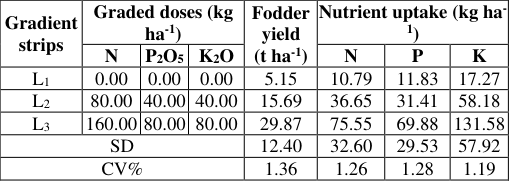 Table 3
Introduction
Fertilisers play a crucial role in enhancing crop production, with their judicious application being essential for achieving high yields. A pioneering field experimental approach, known as the Inductive Methodology, was introduced under the All India Coordinated Research Project (AICRP) for Soil Test Crop Response (STCR) studies. This method involves creating a macrocosm of soil fertility variability within a microcosm of an experimental field by applying graded doses of fertilisers, as outlined by Ramamoorthy et al. (1967) [9] . The STCR approach facilitates the development of fertiliser prescription equations and calibration charts, enabling recommendations based on soil test results to achieve targeted crop yields.
Methodology
The study utilized the "Inductive cum Targeted Yield Model," as outlined by Ramamoorthy et al. (1967) [9] , which provides an empirical framework for optimizing fertilization by balancing nutrients from both external inputs and the natural soil reserves. The deliberate manipulation of soil fertility levels was carried out to create a detailed dataset, incorporating a wide range of fertilizer doses for each controllable factor, while considering varying levels of anuncontrolled variable-soil fertility. This approach was employed to address the natural variability in soil fertility, which typically does not occur uniformly within a single location. To manage this variability, along with differences in management practices and prevailing climatic conditions, an experimental study was conducted in the field. The aim was to create variations in soil fertility within the same field by implementing a fertility gradient. Building on this premise, the present study was designed to examine the effects of a simulated soil fertility gradient on sorghum fodder production, nutrient uptake by sorghum plants, and changes in soil fertility. The field experiment was conducted during the kharif season of 2022, using the nutrientdemanding sorghum variety "Rangeela" to facilitate nutrient transformation through applied fertilizers in the soil. The study was conducted at the college farm of N.M. College of Agriculture, Navsari Agricultural University, located in Navsari. The farm is situated in the coastal region of South Gujarat, at a latitude of 20° 37' N and longitude of 72° 54' E, with an altitude of 11.98 meters above mean sea level. The experimental area was divided into three distinct strips: Strip I (N 0 P 0 K 0 ), Strip II (N 1 P 1 K 1 ), and Strip III (N 2 P 2 K 2 ). Each strip received varying levels of major nutrient fertilizers (NPK), applied as urea, single superphosphate (SSP), and muriate of potash (MOP), corresponding to the respective fertilizer treatments. The recommended dosage of N, P2O5, and K2O for sorghum cultivation was determined based on standard guidelines (Table 1). In experimental treatments II and III, 50% of the nitrogen (N) and 100% of the phosphorus (P) and potassium (K) were applied initially, with the remaining 50% nitrogen applied at 30 days after sowing (DAS). Soil samples were collected both before and after the application, air-dried, sieved through a 2 mm sieve, and analyzed for available nitrogen (Subbiah and Asija, 1956) [12] , available phosphorus (Olsen et al., 1954), and available potassium (Hanway and Heidal, 1952) [5] . At harvest, plant samples were collected from each strip, processed, and analyzed for total nitrogen, phosphorus, and potassium content (Jackson, 1973) [6] . Nutrient uptake by fodder sorghum was calculated by multiplying the nutrient content percentage in the plant by the total dry matter. On the 60th day, the fodder crop was harvested, and the green fodder yield was systematically assessed for each strip.
| Strip (Symbol) | Nutrient level (kg ha-1) | — | — |
|---|---|---|---|
| N | P2O5 | K2O | |
| I. (N0P0K0) | 0 | 0 | 0 |
| II. (N1P1K1) | 80 | 40 | 40 |
| III. (N2P2K2) | 160 | 80 | 80 |
Table text extracted from the original PDF; superscript letters are shown inline. The original table image is below.
View original table image
Results and Discussion
Results and Discussion
Soil properties
The soil used in the experiment was classified as deep black soil with a clayey texture. It was non-saline, with an electrical conductivity (EC) of 0.18 dS m -1 and a pH of 6.70, indicating neutral conditions. The initial soil characteristics included 0.35% organic carbon (OC), low available nitrogen levels (160.19 kg ha -1 ), medium available phosphorus (46.28 kg ha -1 ), and medium available potassium (219.90 kg ha -1 ). The levels of cationic micronutrients-iron (Fe), copper (Cu), zinc (Zn), and manganese (Mn)-in the soil were found to be within the sufficient ranges as per the DTPA extraction method.
Post -harvest soil available nutrients
Soil samples were collected from the sorghum field after harvest to assess the nutrient status and evaluate the impact of graded fertilizer application on the development of an artificial fertility gradient. , respectively. The results indicate a significant increase in soil available N, P, and K in strip III compared to strips II and I, highlighting the creation of an artificial fertility gradient due to the application of graded fertilizer levels.
The post-harvest soil test data were statistically analyzed, revealing significant variations in soil nutrient status among the three strips.
Green fodder yield
The experimental results showed that the application of higher doses of NPK fertilizers significantly increased sorghum fodder yield (Table 3). A clear positive relationship was observed between the amount of nutrients applied and the green fodder yield. In strip I, where no fertilizers (N0P0K0) were applied, the sorghum fodder yield was 5.15 t ha -1 . In strip II, where fertilizers were applied at a rate of 80 kg N ha -1 , 40 kg P2O5 ha -1 , and 40 kg K2O ha -1 (based on standard recommendations), fodder yield increased by 228.2%, reaching a higher yield compared to strip I. In strip III, where the fertilizer application rate was doubled compared to strip II, the sorghum yield reached 29.87 t ha -1 . This represented a 480% increase over strip I and a 90.3% increase over strip II. The increase in yield is likely due to the proportionally adjusted fertilizer application, which enhanced nutrient uptake and promoted growth parameters such as plant height. These factors collectively contributed to the higher fodder yield in strip III. Similar findings were reported by Udayakumar et al.
| Gradient strips | Graded doses (kg ha-1) | — | — | Fodder yield (t ha-1) | Nutrient uptake (kg ha- 1) | — | — |
|---|---|---|---|---|---|---|---|
| N | P2O5 | K2O | N | P | K | ||
| L1 | 0.00 | 0.00 | 0.00 | 5.15 | 10.79 | 11.83 | 17.27 |
| L2 | 80.00 | 40.00 | 40.00 | 15.69 | 36.65 | 31.41 | 58.18 |
| L3 | 160.00 | 80.00 | 80.00 | 29.87 | 75.55 | 69.88 | 131.58 |
| SD | 12.40 | 32.60 | 29.53 | 57.92 | |||
| CV% | 1.36 | 1.26 | 1.28 | 1.19 |
Table text extracted from the original PDF; superscript letters are shown inline. The original table image is below.
View original table image
(2017) [13] , who observed that varying fertilizer levels in a gradient sorghum crop enhanced growth and fodder yield in strip III compared to strip I. The findings of Marsalis et al. (2010) [7] [13,1] in the context of sorghum. The observed increase in green fodder yield can be attributed to the improved nutrient availability in the soil due to fertilizer application, as well as the role of microorganisms in nutrient transformation. Similar results were reported by Rashid and Iqbal (2012) [10] for fodder sorghum, and Alias et al. (2003) [2] observed comparable outcomes in their study on fodder maize.
Nutrient uptake
The data presented in Table 3 indicates a gradual increase in nitrogen uptake by the plant in strip III compared to strip I, with mean values of 10.79, 36.65, and 75.55 kg ha -1 , respectively. Nitrogen uptake increased by 600.1% in strip III compared to strip I, with a 106.1% increase in strip II compared to strip I. In strip II, the nitrogen uptake was 239.6% higher than in strip I. The mean phosphorus uptake in the corresponding strips was 11.83, 31.41, and 69.88 kg ha -1 , showing a significant increase in available phosphorus due to the graded fertilizer application. The potassium uptake in each strip was 17.27, 58.18, and 131.58 kg ha -1 , respectively. The percentage increase in potassium and phosphorus uptake in strip III over strips II and I were 122.47% and 490.7%, and 126.1% and 661.8%, respectively. Similarly, the percentage increase in phosphorus and potassium uptake in strip II over strip I was 165.5% and 236.8%, respectively. This pattern suggests a linear relationship between yield and nutrient uptake. The present study demonstrates that varying concentrations of NPK fertilizers resulted in a significant increase in nutrient uptake by fodder sorghum compared to the control. In a study by Abishek et al. (2023) [1] , it was found that nitrogen uptake by fodder sorghum was higher in plots treated with higher fertilizer levels, which aligns with the findings of Siam et al. (2008) [11] . The considerable increase in phosphorus uptake can be attributed to the higher levels of phosphorus treatment, which likely promoted greater root multiplication in the crop (Verma et al., 2015) [14] .
Conclusion
In conclusion, the results of the study indicate that the different levels of NPK fertilizer applied to the experimental field created an artificial gradient in soil fertility. The fodder crop cultivated within this gradient exhibited notable differences in terms of growth, fodder yield, nutrient absorption, and soil nutrient content.
Figures and tables from the paper
| Gradient strips | Graded doses (kg ha-1) | — | — | Pre-sowing soil test values | — | — | Soil test values after harvest (kg ha-1) | — | — |
|---|---|---|---|---|---|---|---|---|---|
| N | P2O5 | K2O | N | P2O5 | K2O | N | P2O5 | K2O | |
| (kg ha-1) | |||||||||
| I | 0 | 0 | 0 | 160.25 | 45.70 | 218.60 | 146.5 | 43.49 | 202.74 |
| II | 80 | 40 | 40 | 158.8 | 47.28 | 219.35 | 175.62 | 44.61 | 222.66 |
| III | 160 | 80 | 80 | 161.52 | 45.86 | 221.75 | 181.88 | 65.8 | 249.84 |
| SD | 18.88 | 12.57 | 23.64 | ||||||
| CV% | 11.24 | 24.50 | 10.50 |
Table text extracted from the original PDF; superscript letters are shown inline. The original table image is below.
View original table image
References
14 in the original paper- Abishek R, Santhi R, Maragatham S, Gopalakrishnan M. Response of fodder sorghum yield and nutrient uptake under: Artificial soil fertility gradients. The Pharma Innovation Journal. 2023;12(7):2578-2258.
- Alias A, Usman M, Ullah E, Waraich EA. Effects of different Phosphorus levels on the growth and yield of two cultivars of maize (Zea mays L.). Int J Agric Biol. 2003;5(4):632-634.
- Anonymous. Crop Outlook Reports of Andhra Pradesh Sorghum - 2023-24. Available from: angrau.ac.in/downloads/AMIC/OutlookReports/2023_2 4/sorghum outlook-June-july-202324.pdf?utm_source=chatgpt.com
- Dwivedi BS, Arvind K, Shukla VK Singh, Yadav RL. Results of PDCO based trials from the state of Uttar Pradesh. In: Subba Rao A, Srivastava S, editors. Development of Farmers' Resource Based Integrated Plant Nutrient Supply System. Experience of an FAOICAR-IFFCO Collaborative Project and AICRP on STCR. Bhopal, India: IISS; 2001. p. 50-75.
- Hanway JJ, Heidal H. Soil analysis methods as used in Iowa State College, Agri. Bull. 1952;57:1-13.
- Jackson ML. Soil Chemical Analysis. New Delhi: Prentice Hall of India Pvt. Ltd.; 1973.
- Marsalis MA, Angadi SV, Contreras-Govea FE. Dry matter yield and nutritive value of corn, forage sorghum, and BMR forage sorghum at different plant populations and nitrogen rates. Field Crops Res. 2010;116:52-57.
- Independence Ave. SW, Washington DC. 1954; p. 939.
- Ramamoorthy B, Narasimham RL, Dinesh RS. Fertilizer application for specific yield target of Sonara64 wheat. Indian Farming. 1967;17:43-45.
- Rashid I, Iqbal M. Response of sorghum (Sorghum bicolor L.) fodder to phosphorus fertilizer on torripsamment soil. The J Anim Plant Sci. 2011;21(2):220-225.
- Siam SH, Abd-El-Kader GM, El-Alia IH. Yield and yield components of maize as affected by different sources and application rates of nitrogen fertilizer. Res J Agric Biol Sci. 2008;4(5):399-412.
- Subbaiah BV, Asija GL. A rapid procedure for determination of available nitrogen in soil. Curr Sci. 1956;25:259-260.
- Udayakumar S, Santhi R. Impact of Artificial Soil Fertility Gradient Strategy on Soil Fertility, Nutrient Uptake and Fodder Yield of Sorghum. Int J Curr Microbiol App Sci. 2017;6(3):938-944. Available from: https://doi.org/10.20546/ijcmas.2017.603.111.
- Verma M, Singh YV, Ajay Babu, Sudhanshu Verma, Meena R, Sahi SK. Soil test crop response-based gradient experiment on rice (Oryza sativa L.) to fertilizers in the alluvial soil. Indian J Agric Allied Sci. 2014;1(4):51-53.