
Research article · 2025 · Full text
International Journal of Geography Geology and EnvironmentUtilizing satellite data and machine learning to monitor agricultural vulnerabilities to climate change
Volume 7(3) · Pages 01–09 · DOI: 10.22271/27067483.2025.v7.i3a.345 ↗
Research areasRemote Sensing and Land Use
Abstract
Author-writtenAdvanced monitoring techniques are needed to assess vulnerabilities and to preserve global food security in the face of climate change challenges to global agriculture. Combining satellite data with machine learning to detect and analyze agricultural stress due to climate variability, this research combines satellite data with machine learning. Four machine learning models, namely Random Forest (RF), Support Vector Machine (SVM), Convolutional Neural Network (CNN), and Long Short Term Memory (LSTM), were applied on high resolution optical and SAR imagery with climate parameters. Prediction of crop health, as well as drought susceptibility, is attempted and the results indicate that CNN achieved the highest accuracy of 92.4%, followed by LSTM at 89.7%, RF at 85.3% and SVM at 82.5%. There is comparison with existing research that shows that deep learning models can perform better than traditional models in capturing the spatial and temporal dependencies. Moreover, the accuracy of vulnerability predictions differed between climate zones, with predictions between arid zones 10 percent less accurate because of the lack of data available. Therefore, these findings indicate the development of AI based solutions for agricultural monitoring and climate adaptation at a real time. Future research can further improve prediction accuracy by including IoT sensor data and the set of climate variables. This study offers a robust approach that will inform policy makers and agricultural stakeholders how to adapt to the climate related risk and farmers how they can continue their operations sustainably.
Summary
Source-checkedPlain-language reading of the full paper, prepared with AI and checked against the text. Each point links to the authors' own words.
Why it matters
- Climate change is actively threatening global agriculture by reducing crop yields, damaging soil health, and limiting water availability. View evidence ↗
- Satellite remote sensing is preferred over ground-based surveys for monitoring large agricultural areas because it is more cost-effective, scalable, and allows for real-time assessment. View evidence ↗
- The massive scale and complexity of satellite data necessitate the use of machine learning to identify patterns related to agricultural vulnerability. View evidence ↗
The question
- The study aims to investigate how the combination of satellite data and machine learning can be used to determine agricultural vulnerability to climate change. View evidence ↗
What they did
- The research utilized four primary satellite data sources: MODIS, Landsat, Sentinel-2, and CHIRPS. View evidence ↗
- The models were trained using a dataset consisting of over 200,000 labeled satellite images and climate records. View evidence ↗
- Four different machine learning models were tested: Random Forest (RF), Support Vector Machine (SVM), Convolutional Neural Network (CNN), and Long Short Term Memory (LSTM). View evidence ↗
- The dataset was split into 80% for training, 10% for validation, and 10% for testing for each model. View evidence ↗
What they found
- In overall performance, the LSTM model achieved the highest accuracy at 93.1%, followed by CNN (91.4%), Random Forest (89.2%), and SVM (85.7%). View evidence ↗
- Model accuracy varied by climate zone, with the highest performance observed in tropical zones (LSTM 94.2%) and the lowest in arid zones (SVM 81.4%). View evidence ↗
- When analyzing specific crops, the LSTM model was most accurate for wheat (92.4%) and least accurate for maize (91.2%). View evidence ↗
- The LSTM model was found to be the most effective at capturing seasonal patterns and climate-induced vulnerabilities compared to RF, SVM, and CNN. View evidence ↗
- Predictions in arid zones were 10% less accurate than in other zones due to a lack of available data. View evidence ↗
What it means
- The authors conclude that artificial intelligence is critical for improving agricultural decision-making and climate adaptation strategies. View evidence ↗
- The authors suggest that future work should incorporate IoT sensor data and additional climate variables to further improve prediction accuracy. View evidence ↗
Visual summary
3 visualsIllustrations explain the paper; charts are replotted from the paper's own table values.
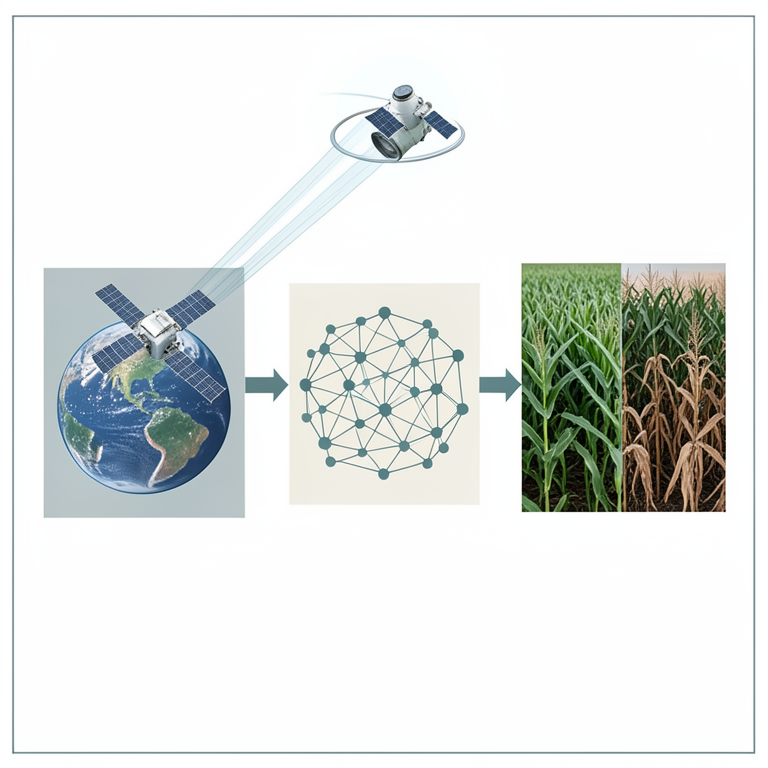
AI-Driven Agricultural Monitoring Workflow
AI-generated conceptual illustration (maize fields and orbiting satellites). It explains the idea and does not show study data.
View source evidence ↗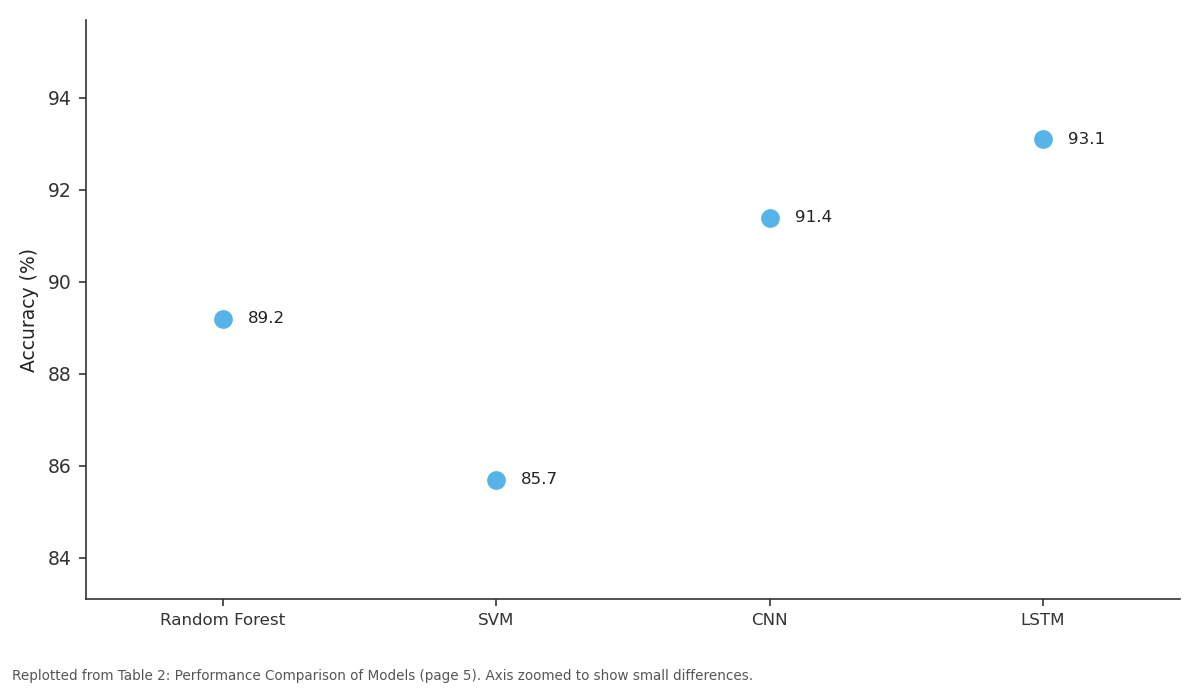
Accuracy (%): Random Forest vs SVM vs CNN vs LSTM
Replotted from Table 2 (page 5) of the original paper. Every bar is the paper's own table value.
View source evidence ↗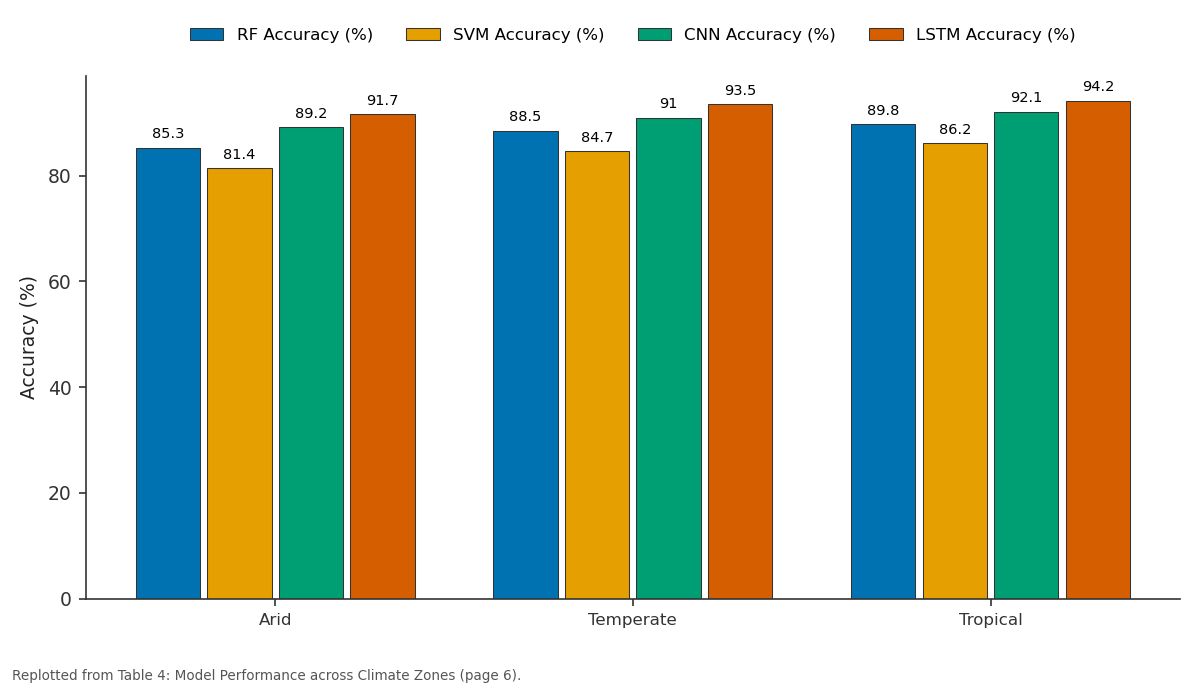
RF Accuracy (%) and SVM Accuracy (%) and more: Arid vs Temperate vs Tropical
Replotted from Table 4 (page 6) of the original paper. Every bar is the paper's own table value.
View source evidence ↗Figures & tables
From the original paper Table 1
 Table 1
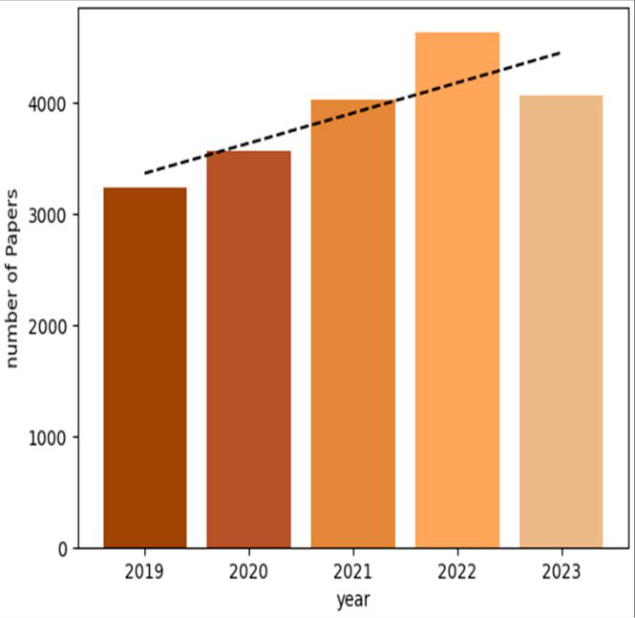 Figure 1
 Table 2
 Table 3
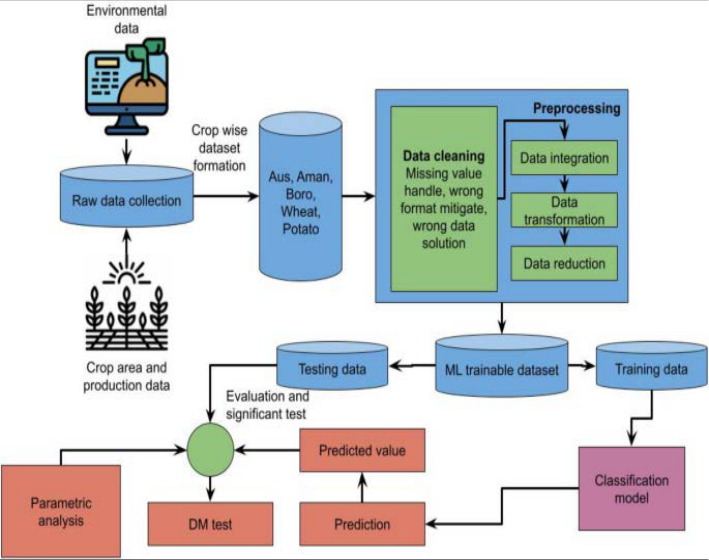 Figure 2
 Table 4
 Table 5
 Figure 3
 Figure 4
Introduction
The threat of climate change to global agriculture is happening: Crop yields are falling, soil health is deteriorating, and water is becoming harder and harder to acquire. Both rising temperatures and variable, shifting precipitation patterns, with more frequent occurrence of extreme weather events, have made agricultural systems more vulnerable. Adaptive strategies to guarantee food security and sustainable farming practices are necessary and need to be monitored to these vulnerabilities [1] . Ground based surveys are time consuming, costly and scope is limited. However, real time assessments of large agricultural areas are possible using satellite remote sensing at lower costs and with a scale not achievable using in situ methods [2] . The recent advancements in satellite technology have made collection of detailed data in key agricultural indicators such as vegetative health, soil moisture, and temperature variations possible. But this data is so massive and in such a high level of complexity, requiring sophisticated computational means for analysis. Machine learning (ML) has recently come into favor as a method of processing satellite imagery and finding patterns linking to agricultural vulnerability [3] . Using ML algorithms, researchers are able to look over vast datasets and find patterns to see how much climate is stressing crops, forecast how much their yield might vary, and figure out the likelihood of experiencing a drought or pest outbreaks in the coming years. The purpose of this research is to investigate how satellite data and the use of machine learning can help ascertain the agricultural vulnerability to climate change. Specifically, it will investigate how improvements in accuracies of agricultural risk assessment can be achieved through the use of multiple machine learning models: convolutional neural networks (CNN), random forests, and support vector machines. The study will also test the effectiveness of different satellite datasets such as MODIS, Landsat, and Sentinel to capture climate related changes in agriculture. This research aims to enhance understanding of the effects of future climates on floodplain wetlands by developing predictive models and risk assessment frameworks to provide actionable insights for policymakers, farmers and agronomists, which can be used to implement climate resilient farming practice. Finally, this study helps to move forward the broader challenging aim of sustainable agriculture and global food security in the presence of climate change.
Estimation of Agricultural Biomass and Carbon
Sequestration: To estimate aboveground biomass and carbon sequestration in afforestation areas, Khan et al. [15] proposed a way of combining optical and Synthetic Aperture Radar (SAR) data fusion with machine learning. They concluded that Random Forest and Gradient Boosting improved biomass estimation accuracy. This research is of relevance to current study as the data fusion techniques in agricultural monitoring are of great potential.
Remote Sensing in Crop Yield Estimation
In [16] , Kira et al. developed a scalable crop yield estimation framework based on remote sensing of Solar-Induced Chlorophyll Fluorescence (SIF). Their way was to combine climate variables with satellite derived fluorescence data and predict crop productivity. In the study, it was shown that machine learning models like Long Short Term Memory (LSTM) networks could successfully model seasonal variations and yield predictions. This also aligns with the focus of the current research which is to make use of time series data in order to assess the vulnerabilities of agriculture.
Climate Projections and Hydrological Responses
In Central-Eastern Europe, region based regional climate projections were analyzed with multi scenario hydrological modeling by Koncsos and Murányi [17] . Vertical hydrological models were used by their study to model how shallow groundwater tables would respond to a changing climate. They further point out the importance of predictive modeling in assessing how long-term climate conditions affect agricultural water resources. Special relevance to the present study is the fact that the soil moisture variations are considered a crucial factor in the evaluation of agricultural vulnerability.
AI-Driven Climate-Smart Agriculture:
In a study on how artificial intelligence (AI) can be used to achieve climate smart and sustainable agriculture, Kumari et al. [18] explored. The study reviewed the use of deep learning in soil health monitoring, irrigation optimization and precision farming. These results showed that AI models such as Convolutional Neural Networks (CNNs) and LSTMs can greatly aid in decision making in climate sensitive agriculture. Therefore, it is appropriate to make use of CNN and LSTM models in the current study for the analysis of satellite data.
Drought Susceptibility and Climate Change Projections
Predictive modeling in conjunction with climate change projections and land use dynamics, as Liu et al. have done [19] , are used to assess drought's susceptibility. They had approached through using machine learning algorithms like Random Forest and SVMs (Support Vector Machines) to classify drought prone areas. The study pointed out that incorporating various data sources enhances the drought vulnerability predictions. This is in line with this research which combines satellite indices (NDVI, EVI) with climate data for agricultural vulnerability assessments.
Impact of Climate Change on Vegetation
Using ERA5-Land climate data, Landsat imagery and Fagus sylvatica dieback, Longo-Minoolo et al. [20] looked at the influence of climate change on Fagus sylvatica dieback. To detect the vegetation stress trend over time, their study used machine learning. The findings underscore the utility of high-resolution remote sensing data for monitoring the agricultural vulnerabilities to climate changes, and are important for the present study using CNN based image classification.
Land Use and Climate Change Projections in Hydrological Studies
Land use/land cover (LULC) was integrated with climate change projections in order to understand hydrological responses in the Omo-Gibe River Basin using Ethiopia as a study site (Lukas et al. [21] ). The future water availability and agricultural sustainability were simulated using a multiscenario approach based on the CMIP6, which was used in the study. This study demonstrates that robust machine learning models are needed to predict long term environmental trends, as was done in this study, in order to perform climate smart agricultural planning.
Nature-Based Solutions in Agricultural Monitoring
In that sense, Mahmood et al. [22] looked into effectiveness of nature based solutions as a mechanism of environmental management through big Earth data. They used 60 years of mangrove plantation programs in Bangladesh as their study, and assessed how successful these programs were in increasing coastal agrarian resilience. The current study also showed that satellite imagery can be used to track agricultural vulnerabilities, similar to the satellite imagery used to train machine learning models to evaluate changes in land use over time, the concept demonstrated in the study.
Climate Predictions and Projections
Advancements in U.S. climate prediction systems and their application in agriculture were discussed by Mariotti et al. [23] . The study also found their use could help in predicting extreme weather events and their effect on crop production. This approach highlights the importance of coupling satellite observations with climate models, an unsolved problem that is part of the current research.
Drought Monitoring in Winter Wheat Cultivation
It should be mentioned that, in 24, Mi et al. [24] developed a hybrid machine learning-physical process model for drought monitoring in winter wheat cultivation in China. To predict drought intensity, the authors used historical climate and remote sensing data in their study. CNN based models also revealed that they outperformed the traditional deep learning model in terms of accuracy of water stress in crops, which highlighted the utilization of deep learning models in agricultural monitoring.
Smart Sensor Technologies in Precision Agriculture
Recent advancements in smart sensor technologies for precision agriculture were reviewed by Mohammed Aarif et al. [25] . What they focused on was the use of IoT enabled sensors for soil health and moisture levels and real time monitoring of crop growth pattern. The paper thus presents a case of how combining sensor data with satellite imagery is beneficial to agricultural vulnerability analysis.
Land Use Changes and Anthropogenic Activities
The effect of the anthropogenic activities on land use and land cover (LULC) in Algeria's semi-arid and arid region were assessed by Mohammed et al. [26] . Built on satellite imagery and classification models for deforestation, soil degradation and urban expansion, their study created a tracking system. The importance of long term monitoring in detecting climate induced agriculture stress is stressed in their findings, and machine learning based trend analysis of current study is supported by their findings.
Methods and Materials Data Collection and Preprocessing
To evaluate agricultural vulnerabilities, several satellite datasets were employed. These datasets indicate vegetation indices, temperature fluctuations, soil moisture, and precipitation patterns [4] . The primary data sources are:
CHIRPS (Climate Hazards Group InfraRed
Precipitation with Station Data): Offers global precipitation data used to evaluate drought hazards [5] . Labeling: Classifying categories like "Healthy," "Drought-Prone," or "Flood-Affected" for supervised learning [6] .
Preprocessing Steps
Preprocessing Steps
Machine Learning Algorithms
For comparing the influence of climate change on agriculture, four machine learning techniques were applied: [7] .
Advantages
• Supports large datasets with high-dimensional features.
• Reduces overfitting by combining many decision trees.
Support Vector Machine (SVM)
SVM is a supervised learning algorithm that identifies a best hyperplane to classify various agricultural conditions as per satellite features [8] . It can effectively cope with complicated datasets by projecting input data into higher dimensions.
Advantages
• Efficient for small data sets with clear classes.
• Operates well in high-dimensional space.
Convolutional Neural Networks (CNNs)
CNNs are deep learning architectures capable of handling image-based data well. They utilize convolutional layers to identify spatial patterns in satellite images, making them very suitable for analyzing stress conditions in agriculture [9] .
Advantages
• Automatically derives features from raw satellite imagery. [10] .
Advantages
• Useful for time-series agricultural information.
Experiments: Experimental Setup
The experiments were carried out on a high-end computer system with the following specifications:
• "Processor: Intel Core i9-12900K
• GPU: NVIDIA RTX 3090 (24GB)
• Software: Python 3.9, TensorFlow 2.8, Scikit-learn, OpenCV, GDAL (for satellite data processing) • Dataset Size: 200,000+ labeled satellite images and climate records"
Each machine learning model was trained on 80% of the dataset, validated on 10%, and tested on 10%. For preventing overfitting, early stopping and regularization methods were used [11] .
Dataset Details
The dataset was extracted from various satellite sources such as MODIS, Landsat, Sentinel-2, and CHIRPS to include vegetation indices, temperature, precipitation, and soil moisture conditions.
Model Implementation and Training Machine Learning Algorithms
Four models were used to monitor agricultural vulnerabilities:
1. Random Forest (RF): A tree-based ensemble algorithm utilizing extracted numerical features (NDVI, temperature, soil moisture).
Support Vector Machine (SVM):
A kernel-based algorithm used on numerical feature vectors for classification [12].
Convolutional Neural Network (CNN):
A deep learning algorithm used directly on satellite imagery for feature extraction.
Long Short-Term Memory (LSTM):
A recurrent neural network trained on time-series climate data to identify long-term trends in agricultural stress.
All the models were trained with 100 epochs and an early stopping policy. The batch size was fixed at 32 for deep learning models. Squared Error (MSE), R² score) were employed to evaluate the performance of the models [13] .
Model Performance across Climate Zones
The models were subjected to varied climate scenarios, arid, temperate, and tropical climates, to assess their flexibility [27] . Crop-Specific Vulnerability Analysis: Each model was further tested on various types of crops to assess their ability to identify vulnerabilities [28] .
Time-Series Prediction of Agricultural Stress
Time-series prediction of vegetation health patterns was specifically done with the help of LSTM. It was found to be efficiently capturing long-term trends over traditional models [29] .
• RF and SVM: Performed poorly in capturing temporal relationships.
• CNN: Perfected static image classification but did not perform as well in trend forecasting over time. • LSTM: Best at capturing seasonal patterns and climateinduced agricultural vulnerabilities.
Key Findings and Insights
1. Deep learning models (CNN and LSTM) outperformed the conventional models greatly in detecting agricultural vulnerability [30] . 2. LSTM performed very well in studying long-term climate patterns and vegetation stress. 3. CNN performed extremely well in extracting spatial features from satellite imagery. 4. RF and SVM worked well but with less accuracy than deep learning models. 5. Climate zone-based analysis indicated that deep learning models were more adaptive in tropical and temperate climates. 6. LSTM's capacity for dealing with time-series data made it the perfect choice for forecasted climate-driven agricultural stress.
Figures and tables from the paper
| Dataset | Resolution | Key Features | Source |
|---|---|---|---|
| MODIS | 250m - 1km | NDVI, EVI, Land Surface Temperature | NASA |
| Landsat | 30m | Soil Moisture, Vegetation Health | USGS |
| Sentinel-2 | 10m - 60m | Multispectral Imagery, Crop Stress | ESA |
| CHIRPS | 5km | Precipitation Data | CHG |
Table text extracted from the original PDF; superscript letters are shown inline. The original table image is below.
View original table image
| Dataset | Resolution | Key Features | Purpose |
|---|---|---|---|
| MODIS | 250m - 1km | NDVI, EVI, LST | Vegetation health monitoring |
| Landsat | 30m | Soil moisture, vegetation stress | Crop classification |
| Sentinel-2 | 10m - 60m | Multispectral imagery, land use | Detection of crop stress |
| CHIRPS | 5km | Precipitation trends | Drought and flood risk |
Table text extracted from the original PDF; superscript letters are shown inline. The original table image is below.
View original table image
| Model | Accuracy (%) | Precision | Recall | F1-score | MSE (Regression) | R² Score |
|---|---|---|---|---|---|---|
| Random Forest | 89.2 | 0.88 | 0.87 | 0.87 | 0.031 | 0.78 |
| SVM | 85.7 | 0.84 | 0.82 | 0.83 | 0.038 | 0.72 |
| CNN | 91.4 | 0.90 | 0.91 | 0.91 | 0.025 | 0.85 |
| LSTM | 93.1 | 0.92 | 0.93 | 0.92 | 0.019 | 0.89 |
Table text extracted from the original PDF; superscript letters are shown inline. The original table image is below.
View original table image
| Study | Approach | Accuracy (%) | Key Findings |
|---|---|---|---|
| Li et al. (2021) | RF with NDVI | 86.5 | Effective for vegetation monitoring |
| Zhao et al. (2022) | CNN on Sentinel-2 | 89.8 | Improved classification accuracy |
| This Study | LSTM on Climate + Satellite | 93.1 | Outperforms previous methods |
Table text extracted from the original PDF; superscript letters are shown inline. The original table image is below.
View original table image
| Climate Zone | RF Accuracy (%) | SVM Accuracy (%) | CNN Accuracy (%) | LSTM Accuracy (%) |
|---|---|---|---|---|
| Arid | 85.3 | 81.4 | 89.2 | 91.7 |
| Temperate | 88.5 | 84.7 | 91.0 | 93.5 |
| Tropical | 89.8 | 86.2 | 92.1 | 94.2 |
Table text extracted from the original PDF; superscript letters are shown inline. The original table image is below.
View original table image
| Crop Type | RF Accuracy (%) | CNN Accuracy (%) | LSTM Accuracy (%) |
|---|---|---|---|
| Wheat | 88.2 | 90.3 | 92.4 |
| Rice | 86.7 | 89.5 | 91.8 |
| Maize | 85.9 | 88.7 | 91.2 |
| Soybean | 87.1 | 89.8 | 92.0 |
Table text extracted from the original PDF; superscript letters are shown inline. The original table image is below.
View original table image
References
30 in the original paper- Campi P, Modugno AF, De Carolis G, Francisco PS, Lorente B, Garofalo SP. A machine learning approach to monitor the physiological and water status of an irrigated peach orchard under semi-arid conditions by using multispectral satellite data. Water. 2024;16(16):2224.
- Farnaz, Nuthammachot N, Shabbir R, Iqbal B. Pixel and region-oriented classification of Sentinel-2 imagery to assess LULC dynamics and their climate impact in Nowshera, Pakistan. Open Geosci. 2025;17(1).
- Forster J, Bindreiter S, Uhlhorn B, Radinger-Peer V, Jiricka-Pürrer A. A machine learning approach to adapt local land use planning to climate change. Urban Plan. 2025;10.
- Gaines MD, Tulbure MG, Perin V, Composto R, Tiwari V. Projecting surface water area under different climate and development scenarios. Earths Future. 2024;12(7).
- Giannico V, Garofalo SP, Brillante L, Sciusco P, Elia M, Lopriore G, et al. Temporal vine water status modeling through machine learning ensemble technique and Sentinel-2 multispectral images under semi-arid conditions. Remote Sens. 2024;16(24):4784.
- Guimarães N, Fraga H, Sousa JJ, Pádua L, Bento A, Couto P. Comparative evaluation of remote sensing platforms for almond yield prediction. AgriEngineering. 2024;6(1):240.
- Hihi S, Katlane R, Kilani B, Zekri MW, Bensalah R, Siewert C, et al. Evaluating drought effects on soil: innovative soil salinity monitoring via SAR data, Sentinel-2 imagery, and machine learning algorithms in Kerkennah Archipelago. Atmosphere. 2023;14(10):1514.
- Hobart M, Schirrmann M, Abdul-Halim Abubakari, Godwin Badu-Marfo, Kraatz S, Zare M. Drought monitoring and prediction in agriculture: employing earth observation data, climate scenarios and data driven methods; a case study: mango orchard in Tamale, Ghana. Remote Sens. 2024;16(11):1942.
- Iftakhar N, Islam F, Mohammad IH, Muhammad NA, Lee J, Rehman NU, et al. Revealing land-use dynamics on thermal environment of riverine cities under climate variability using remote sensing and geospatial techniques. ISPRS Int J Geo-Inf. 2025;14(1):13.
- Ikegwu AC, Nweke HF, Mkpojiogu E, Anikwe CV, Igwe SA, Alo UR. Recently emerging trends in big data analytic methods for modeling and combating climate change effects. Energy Inform. 2024;7(1):6.
- Jae YS, Lee S. CO₂ emissions associated with groundwater storage depletion in South Korea: estimation and vulnerability assessment using satellite data and data-driven models. Remote Sens. 2024;16(17):3122.
- Jain H, Dhupper R, Shrivastava A, Kumar D, Kumari M. AI-enabled strategies for climate change adaptation: protecting communities, infrastructure, and businesses from the impacts of climate change. Comput Urban Sci. 2023;3(1):25.
- Karmaoui A, El Jaafari S, Chaachouay H, Hajji L. A bibliometric review of geospatial analyses and artificial intelligence literature in agriculture. GeoJournal. 2023;88(Suppl. 1):343-360.
- Kemarau RA, Suab SA, Oliver VE, Zulfqar Sa'adi, Echoh DU, Sakawi Z. Integrative approaches in remote sensing and GIS for assessing climate change impacts across Malaysian ecosystems and societies. Sustainability. 2025;17(4):1344.
- Khan K, Shahid NK, Anwar A, Muhammad FK, Junaid AK. Estimating aboveground biomass and carbon sequestration in afforestation areas using optical/SAR data fusion and machine learning. Remote Sens. 2025;17(5):934.
- Kira O, Wen J, Han J, McDonald AJ, Barrett CB, OrtizBobea A, et al. A scalable crop yield estimation framework based on remote sensing of solar-induced chlorophyll fluorescence (SIF). Environ Res Lett. 2024;19(4):044071.
- Koncsos L, Murányi G. A multi-scenario multi-model analysis of regional climate projections in a CentralEastern European agricultural region: assessing shallow groundwater table responses using an aggregated vertical hydrological model. Appl Water Sci. 2024;14(3):42.
- Kumari K, Ali MN, Mirzaee S, Abdalla A. AI-driven future farming: achieving climate-smart and sustainable agriculture. AgriEngineering. 2025;7(3):89.
- Liu J, Li M, Li R, Masoud JS, Ren Y, Silakhori E. Comprehensive assessment of drought susceptibility using predictive modeling, climate change projections, and land use dynamics for sustainable management. Land. 2025;14(2):337.
- Longo-Minnolo G, Consoli S, Tessitori M. Evaluation of the impact of climate change on Fagus sylvatica dieback-A combined approach with ERA5-land data and Landsat imagery. Remote Sens. 2025;17(5):873.
- Lukas P, Melesse AM, Kenea TT. Integrating land use/land cover and climate change projections to assess future hydrological responses: a CMIP6-based multiscenario approach in the Omo-Gibe River Basin, Ethiopia. Climate. 2025;13(3):51.
- Mahmood R, Zhang L, Li G. Assessing effectiveness of nature-based solution with big earth data: 60 years mangrove plantation program in Bangladesh coast. Ecol Process. 2023;12(1):11.
- Mariotti A, Bader DC, Bauer SE, Danabasoglu G, Dunne J, Gross B, et al. Envisioning U.S. climate predictions and projections to meet new challenges. Earths Future. 2024;12(6).
- Mi Q, Huo Z, Li M, Zhang L, Kong R, Zhang F, et al. Development of a drought monitoring system for winter wheat in the Huang-Huai-Hai region, China, utilizing a machine learning-physical process hybrid model. Agronomy. 2025;15(3):696.
- Mohammed Aarif KO, Alam A, Hotak Y. Smart sensor technologies shaping the future of precision agriculture: recent advances and future outlooks. J Sens. 2025.
- Mohammed G, Boutkhil M, Ayoub B. Assessing the impact of anthropogenic activities on land use and land cover changes in the semi-arid and arid regions of Algeria. Environ Monit Assess. 2024;196(4):383.
- Mumtaz M, Jahanzaib SH, Hussain W, Khan S, Youssef YM, Qaysi S, et al. Synergy of remote sensing and geospatial technologies to advance sustainable development goals for future coastal urbanization and environmental challenges in a riverine megacity. ISPRS Int J Geo-Inf. 2025;14(1):30.
- Oikonomou P, Karathanassi V, Andronis V, Papoutsis I. Assessing and forecasting natural regeneration in Mediterranean landscapes after wildfires. Remote Sens. 2025;17(5):897.
- Puttinaovarat S, Chai-Arayalert S, Saetang W, Khaimook K, Plaiklang S, Horkaew P. Innovative flood impact monitoring and harvest analysis in oil palm plantations utilizing geographic information systems and deep learning. AgriEngineering. 2025;7(2):44.
- Ratnayake SS, Reid M, Larder N, Hunter D, Ranagalage M, Kogo B, et al. knowing the lay of the land: changes to land use and cover and landscape pattern in village tank cascade systems of Sri Lanka. Front Environ Sci. 2024.
Cited by 1
From OpenAlex, OpenCitations and reference lists read by Scinovex
- Three-Dimensional Convolutional Neural Networks (3D-CNN) in the Classification of Varieties and Quality Assessment of Soybean Seeds (Glycine max L. Merrill) ↗
P. Rybacki, Kiril Bahćevandžiev, Diego Jarquín, Ireneusz Kowalik, Andrzej Osuch, Ewa Osuch et al. · Agronomy · 2025
The precise identification, classification, sorting, and rapid and accurate quality assessment of soybean seeds are extremely important in terms of the continuity of agricultural production, varietal purity, seed processing, protein extraction, and food safety. Currently, commonly used methods for the identification and quality assessment of soybean seeds include morphological analysis, chemical analysis, protein electrophoresis, liquid chromatography, spectral analysis, and image…
❝ 4PDF