
Research article · 2025 · Full text
International Journal of Advanced Chemistry ResearchAwareness of consumers regarding recycled textiles
Volume 7(3) · Pages 17–23 · DOI: 10.33545/26646781.2025.v7.i3a.265 ↗
Research areasConsumer Packaging Perceptions and Trends
Abstract
Author-writtenRecycled textiles sustainably play a crucial role by reducing waste, conserving resources, and minimizing environmental pollution. These textiles are created by repurposing discarded fabrics, used clothing, and manufacturing scraps, thereby promoting a circular economy in the apparel industry. With the rapid growth of fast fashion, textile waste has become a significant environmental concern, making recycling an essential strategy for sustainability. This study investigates consumer awareness and preferences regarding recycled textiles among undergraduate (UG) and postgraduate (PG) students at CCS Haryana Agricultural University, Hisar. A structured questionnaire was used to collect data from 50 respondents, revealing that 78% were aware of recycled textiles, while 74% preferred recycling. Clothing was the most commonly preferred category for recycling (74%), followed by handloom (20%). The study also found that 64% of UG and 52% of PG students preferred purchasing recycled textiles at half price, with 70% favouring a price range of ₹12-15 per item. Despite growing awareness, 74% of students were unaware of textile recycling brands, indicating a gap in market accessibility and consumer knowledge. The increasing environmental impact of the textile industry makes it crucial for individuals to adopt sustainable practices like recycling and reusing textiles. Greater awareness and accessibility of recycled textiles can significantly reduce landfill waste, conserve natural resources like water and energy, and lower the carbon footprint associated with textile production. Governments, industries, and educational institutions must work together to encourage sustainable consumption through targeted awareness campaigns, innovative recycling technologies, and policy support. Moreover, incorporating sustainability into fashion choices and making recycled textiles more affordable and accessible can drive greater adoption among consumers. By promoting the circular economy model in the textile sector, society can move towards a more responsible and environmentally friendly future, ensuring long-term benefits for both the planet and future generations.
Summary
Source-checkedPlain-language reading of the full paper, prepared with AI and checked against the text. Each point links to the authors' own words.
Why it matters
- Recycled textiles are important for sustainability because they help reduce waste, conserve natural resources, and lower environmental pollution. View evidence ↗
- The rise of fast fashion has significantly increased textile waste, making recycling a critical strategy for environmental sustainability. View evidence ↗
- On a global scale, only 25% of textile waste is recycled or repurposed, while 75% ends up in landfills. View evidence ↗
The question
- The study aims to investigate the awareness and preferences of undergraduate and postgraduate students at CCS Haryana Agricultural University regarding recycled textiles. View evidence ↗
What they did
- The research was conducted at the I.C College of Community Science and the College of Agricultural Engineering and Technology at Haryana Agriculture University in Hisar. View evidence ↗
- Data was collected from 50 respondents using a structured questionnaire. View evidence ↗
- The researchers analyzed the data using frequency, percentage, and mean calculations. View evidence ↗
What they found
- Among the participants, 78% were aware of recycled textiles and 74% expressed a preference for recycling. View evidence ↗
- Clothing was the most preferred category for recycling at 74%, while handloom was preferred by 20%. View evidence ↗
- Regarding pricing, 64% of undergraduate and 52% of postgraduate students preferred to purchase recycled textiles at half price. View evidence ↗
- A majority of students (70%) favored a price range of ₹12-15 per item for recycled textiles. View evidence ↗
- There is a significant gap in market knowledge, as 74% of students were unaware of specific brands that recycle textiles. View evidence ↗
- Information sources varied by group: 60% of UG and 32% of PG students learned about recycled textiles from neighbors and relatives, while 36% of UG and 24% of PG students used the internet. View evidence ↗
- When managing waste, 56% of undergraduate and 68% of postgraduate students preferred to reuse jeans with holes. View evidence ↗
What it means
- The authors conclude that students have a growing awareness and preference for recycled textiles, motivated mainly by environmental and economic factors. View evidence ↗
- The authors recommend implementing targeted awareness campaigns, educational programs, and institutional initiatives to bridge the gap in brand awareness and accessibility. View evidence ↗
Visual summary
3 visualsIllustrations explain the paper; charts are replotted from the paper's own table values.
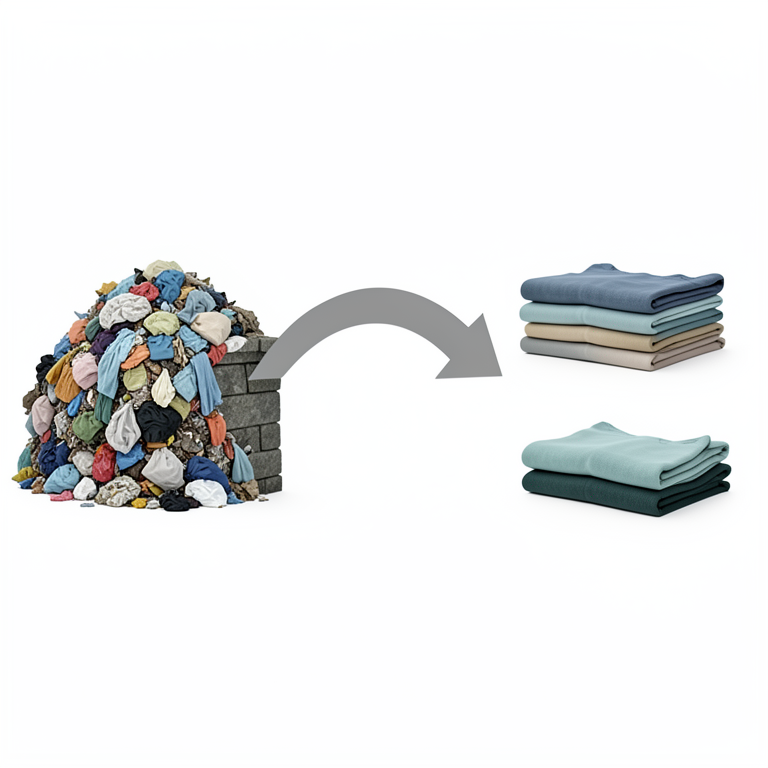
The Awareness Gap
AI-generated conceptual illustration (recycled textile garments and clothing waste). It explains the idea and does not show study data.
View source evidence ↗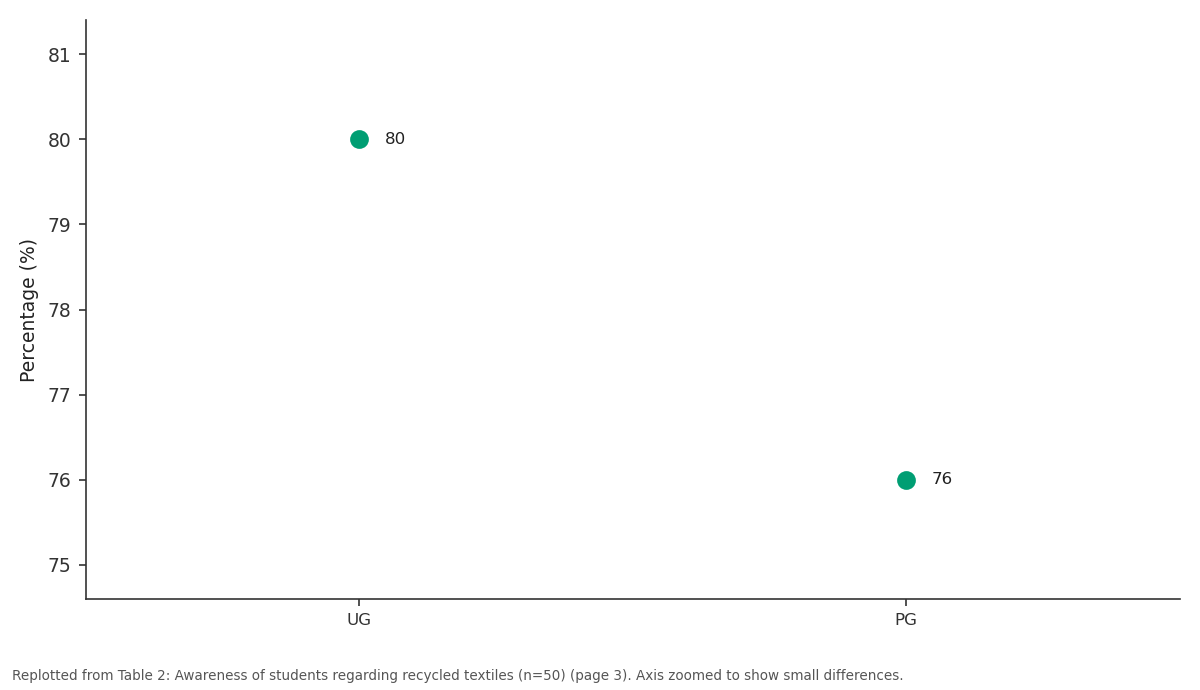
Yes (%): UG vs PG
Replotted from Table 2 (page 3) of the original paper. Every bar is the paper's own table value.
View source evidence ↗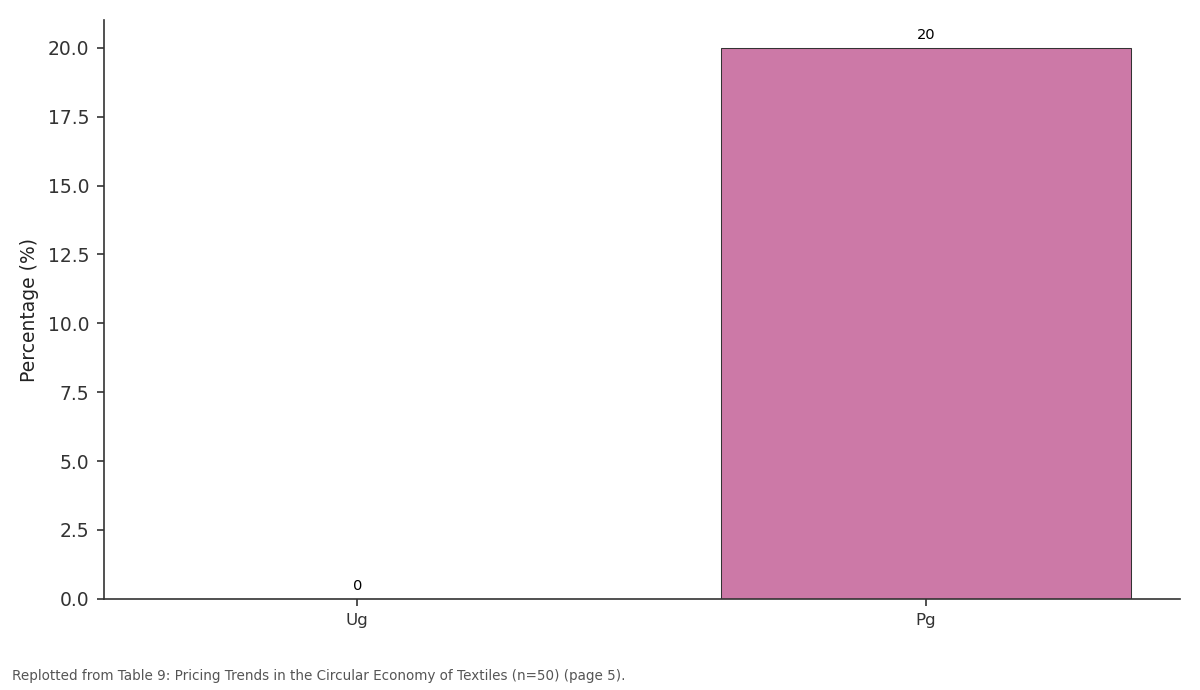
Percentage: Ug vs Pg
Replotted from Table 9 (page 5) of the original paper. Every bar is the paper's own table value.
View source evidence ↗Figures & tables
From the original paper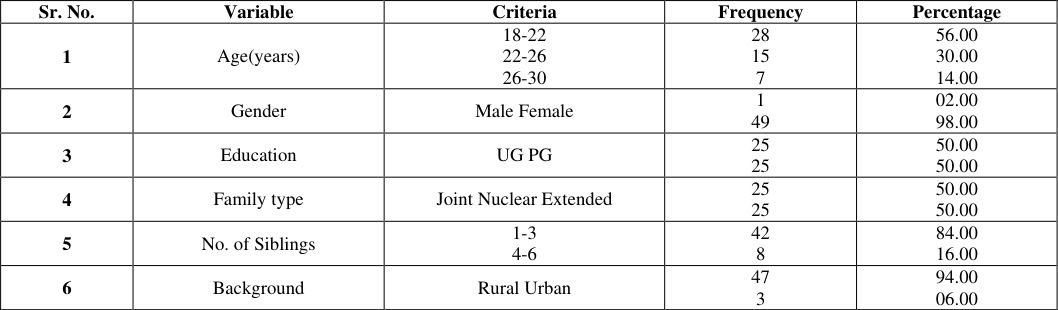 Table 1
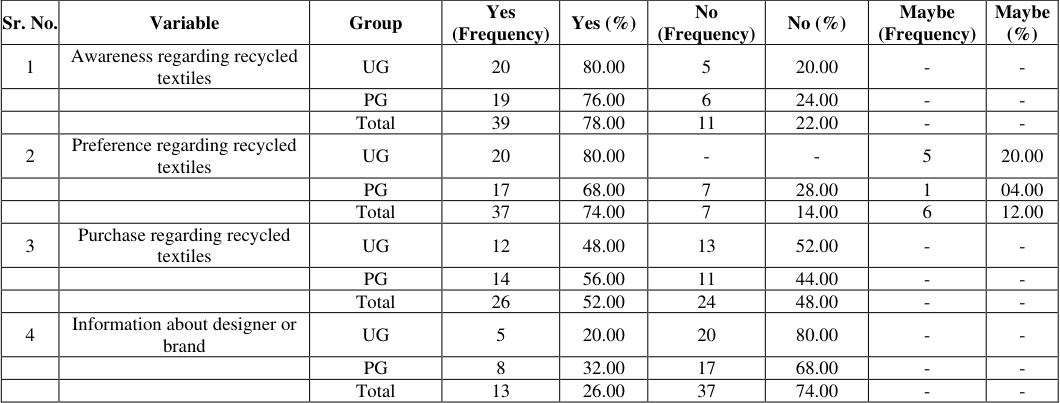 Table 2
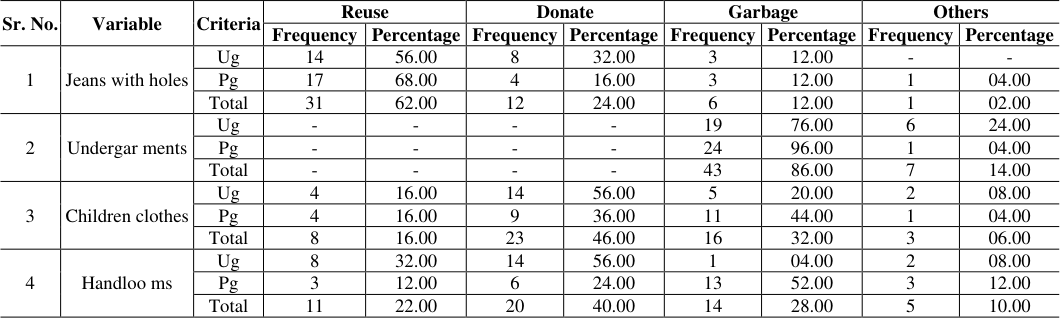 Table 3
 Table 4
 Table 5
 Table 6
 Table 7
 Table 8
 Table 9
 Table 10
Introduction
In 1943, Maslow recognized clothing as a fundamental necessity, positioning it alongside vital needs such as food and shelter, underscoring its indispensable role in human survival. However, in contemporary industrialized societies, clothing has increasingly been influenced by fleeting fashion trends, resulting in a dramatic reduction in the lifespan of garments before they are discarded. This rapid turnover propels the growth of the textile industry, driving overconsumption, squandering of resources, and a substantial escalation in textile waste (Maslow, 1943) [12] . Textiles are created to fulfill a variety of functions and are made from a wide range of fibers blended in different proportions. It is well-established that the textile industry generates a significant amount of waste each year. The economic consequences of textile waste are directly tied to the volume of textile production-the higher the output, the greater the waste produced. Apparel manufacturing results in substantial material waste, much of which ultimately ends up in landfills, despite its potential for repurposing. Recycling this waste material can provide a viable solution to tackle numerous economic, environmental, and social challenges. (Aluigi et al., 2008) [1] . The rapid expansion of the clothing and textile industry, alongside the rise of the fast fashion phenomenon, has led to a dramatic increase in textile waste worldwide, now a prevalent element of municipal solid waste (MSW). Globally, 75% of textile waste is disposed of in landfills, while only 25% is recycled or repurposed.
The practice of landfilling textile waste is unsustainable, highlighting the urgent need for enhanced reuse and recycling technologies to divert a larger portion of textile waste from landfills. Reuse is often regarded as the more favorable option compared to recycling, and various innovative technologies for textile reuse and recycling continue to be developed, particularly to handle blended fabrics more effectively. (Juanga-Labayen et al., 2022) [9] . The environmental and resource-related challenges brought on by the textile industry, amplified by the fast fashion trend, are profound (Franco, 2017) [4] . The shift towards a circular economy presents a promising approach to tackling issues related to resource depletion and waste management (Galvão et al., 2018) [5] . A critical step in the recycling process is the sorting and identification of textile materials for separation, given the complex composition of textile fibers (Hussain et al., 2021) [8] . The incorporation of Internet of Things (IoT) technology has significantly enhanced management in this domain (Fatimah et al., 2020) [3] . Identifying textile materials remains a major challenge in the recycling process, especially due to the intricate nature of fabric structures. Blended fibers, such as cellulose-polyester mixtures, commonly found in modern garments, are selected for their specific attributes like moisture absorption, wrinkle resistance, and comfort. (Haslinger et al., 2019) [7] . Textiles can be recycled through a variety of methods, including mechanical, thermal, and chemical processes. Textile recycling primarily involves reprocessing preconsumer or post-consumer waste fabrics to produce new textile or non-textile products. These recycling techniques encompass the dissolution of natural fibers, chemical degradation of polymeric fibers, mechanical treatment (pretreatment), and thermal treatment (Spathas, 2017) [18] . A circular economy is a concept that redefines material production by utilizing resources in ways that prioritize reuse and recycling. It aims to minimize waste through the efficient use of resources across their entire lifecycle (Shirvanimoghaddam et al., 2020) [17] . The circular economy model is based on environmental, industrial, economic, and ecological principles (Winans et al., 2017) [19] . However, implementing a circular economy widely in the fashion industry faces challenges due to the diverse range of fashion styles, aesthetics, and consumer preferences. Overcoming these barriers requires the establishment of strong environmental regulations and sustainability policies (Manglani and Hodge, 2019) [13] . Moreover, the textile industry has been found to have a harmful impact on society, consuming substantial amounts of resources like oil, carbon, and water (Kazancoglu et al., 2020) [10] . By embracing circular economy principles-such as extending product lifecycles and repurposing materials-the industry can reduce waste and enhance the value of products (Shirvanimoghaddam et al., 2020) [17] . The circular economy is propelled by three core strategies: reduce, reuse, and recycle. These principles are in line with traditional waste management practices, which are increasingly being adopted within the textile industry (Manickam and Duraisamy, 2019) [11] .
Methodology
Location of the Study: The Hisar district was selected purposively for the present study because of its proximity and familiarity with the district. The current study was conducted in I.C College of Community Science and College of Agricultural Engineering and Technology, Haryana Agriculture University, Hisar Development of Questionnaire Schedule: The development of a Questionnaire schedule was done to obtain the desired information for the collection of data from respondents. They were selected randomly and the information was collected on various aspects related to recycled textiles. The questionnaire schedule consists of questions related to the personal profile of respondents. Awareness, purchase and preference about recycled textiles and the use pattern of consumers. Collection Data: The required data was collected through a personal interview technique using a structured questionnaire. Students were selected from CCS Haryana Agricultural University, Hisar for the present study. Data analysis: Coding and tabulation were done using Microsoft Excel software. Data analysis was carried out using mean, frequency and percentage on the computer. Data interpretation was done with the study's aims.
Results
The result of the study is presented under the different headings after analysis of data was collected through questions. The findings revealed varied levels of awareness and perceptions regarding recycled textiles among students. [14] also revealed participants showed an ecological willingness to avoid waste, to help others, and to bring about a good impact on the environment-only 1.55% of the participants put clothes in the trash Table 4 shows that 40 per cent of Ug and 36 per cent of Pg students preferred the economic aspect of recycling while 48 per cent of Ug preferred the environmental element and 48 per cent of Pg students selected physiological aspects of recycling textiles. Sowmya and Shashi (2024) [16] revealed how people are concerned about the social environmental and ethical impacts in the fashion industry, 81.8% of people responded with very high and 18.2% responded with high, most people are concerned about the environmental and ethical impacts in the fashion industry Table 7 shows 32 per cent of Ug and 29 per cent of Pg students prefer to sort/ rid of used textiles by themselves while 20 per cent g and 36 per cent of Pg students prefer sorting with another person. Sowmya and Shashi (2024) [16] Revealed how people dispose of their unwanted clothes, 27.3% of the people hand them down to younger family members, and a similar number of people use them as a thrift. 27.3% of people are donating to the charity and the remaining people put it to alternate use and throw it away. Table 9 shows the estimated price at which students prefer to buy recycled textiles/ clothes, 64 per cent of Ug and 52 per cent of Pg students would like to buy textiles/ clothes at half price.
| Sr. No. | Criteria | Same | — | Half | — | Less than half | — |
|---|---|---|---|---|---|---|---|
| Frequency | Percentage | Frequency | Percentage | Frequency | Percentage | ||
| 1 | Ug | - | 0 | 16 | 64.00 | 9 | 36.00 |
| Pg | 5 | 20.00 | 13 | 52.00 | 7 | 28.00 | |
| Total | 5 | 10.00 | 29 | 58.00 | 16 | 32.00 |
Table text extracted from the original PDF; superscript letters are shown inline. The original table image is below.
View original table image
| Sr. No. | Criteria | Self | — | Share with another person | — | Someone Else | — | None | — |
|---|---|---|---|---|---|---|---|---|---|
| Frequency | Percentage | Frequency | Percentage | Frequency | Percentage | Frequency | Percentage | ||
| 1 | Ug | 8 | 32.00 | 5 | 20.00 | 7 | 28.00 | 5 | 20.00 |
| Pg | 7 | 28.00 | 9 | 36.00 | 7 | 28.00 | 2 | 08.00 | |
| Total | 15 | 30.00 | 14 | 28.00 | 14 | 28.00 | 7 | 14.00 |
Table text extracted from the original PDF; superscript letters are shown inline. The original table image is below.
View original table image
| Sr. No. | Criteria | Economical | — | Biological | — | Environmental | — | Physiologica l | — | Others | — |
|---|---|---|---|---|---|---|---|---|---|---|---|
| Frequency | Percentage | Frequency | Percentage | Frequency | Percentage | Frequency | Percentage | Frequency | Percentage | ||
| 1 | Ug | 10 | 40.00 | 1 | 04.00 | 12 | 48.00 | - | 2 | 08.00 | |
| Pg | 9 | 36.00 | 8 | 32.00 | - | 7 | 28.00 | 1 | 04.00 | ||
| Total | 19 | 38.00 | 9 | 18.00 | 12 | 24.00 | 7 | 14.00 | 3 | 06.00 |
Table text extracted from the original PDF; superscript letters are shown inline. The original table image is below.
View original table image
Figures and tables from the paper
| Sr. No. | Variable | Group | Yes (Frequency) | Yes (%) | No (Frequency) | No (%) | Maybe (Frequency) | Maybe (%) |
|---|---|---|---|---|---|---|---|---|
| 1 | Awareness regarding recycled textiles | UG | 20 | 80.00 | 5 | 20.00 | - | - |
| PG | 19 | 76.00 | 6 | 24.00 | - | - | ||
| Total | 39 | 78.00 | 11 | 22.00 | - | - | ||
| 2 | Preference regarding recycled textiles | UG | 20 | 80.00 | - | - | 5 | 20.00 |
| PG | 17 | 68.00 | 7 | 28.00 | 1 | 04.00 | ||
| Total | 37 | 74.00 | 7 | 14.00 | 6 | 12.00 | ||
| 3 | Purchase regarding recycled textiles | UG | 12 | 48.00 | 13 | 52.00 | - | - |
| PG | 14 | 56.00 | 11 | 44.00 | - | - | ||
| Total | 26 | 52.00 | 24 | 48.00 | - | - | ||
| 4 | Information about designer or brand | UG | 5 | 20.00 | 20 | 80.00 | - | - |
| PG | 8 | 32.00 | 17 | 68.00 | - | - | ||
| Total | 13 | 26.00 | 37 | 74.00 | - | - |
Table text extracted from the original PDF; superscript letters are shown inline. The original table image is below.
View original table image
| Sr. No. | Variable | Criteria | Reuse | — | Donate | — | Garbage | — | Others | — |
|---|---|---|---|---|---|---|---|---|---|---|
| Frequency | Percentage | Frequency | Percentage | Frequency | Percentage | Frequency | Percentage | |||
| 1 | Jeans with holes | Ug | 14 | 56.00 | 8 | 32.00 | 3 | 12.00 | - | - |
| Pg | 17 | 68.00 | 4 | 16.00 | 3 | 12.00 | 1 | 04.00 | ||
| Total | 31 | 62.00 | 12 | 24.00 | 6 | 12.00 | 1 | 02.00 | ||
| 2 | Undergar ments | Ug | - | - | - | - | 19 | 76.00 | 6 | 24.00 |
| Pg | - | - | - | - | 24 | 96.00 | 1 | 04.00 | ||
| Total | - | - | - | - | 43 | 86.00 | 7 | 14.00 | ||
| 3 | Children clothes | Ug | 4 | 16.00 | 14 | 56.00 | 5 | 20.00 | 2 | 08.00 |
| Pg | 4 | 16.00 | 9 | 36.00 | 11 | 44.00 | 1 | 04.00 | ||
| Total | 8 | 16.00 | 23 | 46.00 | 16 | 32.00 | 3 | 06.00 | ||
| 4 | Handloo ms | Ug | 8 | 32.00 | 14 | 56.00 | 1 | 04.00 | 2 | 08.00 |
| Pg | 3 | 12.00 | 6 | 24.00 | 13 | 52.00 | 3 | 12.00 | ||
| Total | 11 | 22.00 | 20 | 40.00 | 14 | 28.00 | 5 | 10.00 |
Table text extracted from the original PDF; superscript letters are shown inline. The original table image is below.
View original table image
| Sr. No. | Criteria | Handloom | Clothes | Lingerie | Sr. No. | Criteria | Handloom |
|---|---|---|---|---|---|---|---|
| Frequency | Percentage | Frequency | Percentage | Frequency | Percentage | ||
| 1 | Ug | 5 | 20.00 | 20 | 80.00 | - | |
| Pg | 5 | 20.00 | 17 | 68.00 | 3 | 12.00 | |
| Total | 10 | 20.00 | 37 | 74.00 | 3 | 06.00 |
Table text extracted from the original PDF; superscript letters are shown inline. The original table image is below.
View original table image
| Sr. No. | Criteria | Internet | — | Newspaper/ Magazines | — | Friends/Neighbour/Relatives | — | Others | — |
|---|---|---|---|---|---|---|---|---|---|
| Frequency | Percentage | Frequency | Percentage | Frequency | Percentage | Frequency | Percentage | ||
| 1 | Ug | 9 | 36.00 | 1 | 04.00 | 15 | 60.00 | - | |
| Pg | 6 | 24.00 | 10 | 40.00 | 8 | 32.00 | 1 | 04.00 | |
| Total | 15 | 30.00 | 11 | 22.00 | 23 | 46.00 | 1 | 02.00 |
Table text extracted from the original PDF; superscript letters are shown inline. The original table image is below.
View original table image
| Sr. No. | Criteria | Once or twice a year | — | Every four to six months | — | Every month | — | Never | — |
|---|---|---|---|---|---|---|---|---|---|
| Frequency | Percentage | Frequency | Percentage | Frequency | Percentage | Frequency | Percentage | ||
| 1 | Ug | 19 | 76.00 | 6 | 24.00 | - | - | ||
| Pg | 8 | 32.00 | 8 | 32.00 | 7 | 28.00 | 2 | 08.00 | |
| Total | 27 | 54.00 | 14 | 28.00 | 7 | 14.00 | 2 | 04.00 |
Table text extracted from the original PDF; superscript letters are shown inline. The original table image is below.
View original table image
| Sr. No. | Criteria | 9-12 | — | 12-15 | — | 15-19 | — |
|---|---|---|---|---|---|---|---|
| Frequency | Percentage | Frequency | Percentage | Frequency | Percentage | ||
| 1 | Ug | 1 | 04.00 | 17 | 68.00 | 7 | 28.00 |
| Pg | - | 18 | 72.00 | 7 | 28.00 | ||
| Total | 1 | 02.00 | 35 | 70.00 | 14 | 28.00 |
Table text extracted from the original PDF; superscript letters are shown inline. The original table image is below.
View original table image
References
19 in the original paper- Aluigi C, Vineis A, Ceria C, Tonin. Composite biomaterials from fibre wastes: Characterization of wool-circular cellulose acetate blends. Composites Part A: Applied Sciences and Manufacturing. 2008;39:126132.
- Allwood JM, Laursen SE, de Rodriguez CM, Bocken NM. Well dressed?: The present and future sustainability of clothing and textiles in the United Kingdom. J Home Econ Inst Aust. 2015;22:42.
- Fatimah YA, Govindan K, Murniningsih R, Setiawan A. Industry 4.0 based sustainable circular economy approach for smart waste management system to achieve sustainable development goals: A case study of Indonesia. J Clean Prod. 2020;269:122263.
- Franco MA. Circular economy at the micro level: A dynamic view of incumbents' struggles and challenges in the textile industry. J Clean Prod. 2017;168:833-45.
- Galvão GDA, de Nadae J, Clemente DH, Chinen G, de Carvalho MM. Circular economy: Overview of barriers. Procedia CIRP. 2018;73:79-85.
- Geissdoerfer M, Savaget P, Bocken NM, Hultink EJ. The Circular Economy-A new sustainability paradigm? J Clean Prod. 2017;143:757-68.
- Haslinger S, Hietala S, Hummel M, Maunu SL, Sixta H. Solid-state NMR method for the quantification of circular cellulose and polyester in textile blends. Carbohydr Polym. 2019;207:11-6.
- Hussain A, Kamboj N, Podgurski V, Antonov M, Goliandin D. Circular economy approach to recycling technologies of postconsumer textile waste in Estonia: A review. Proc Est Acad Sci. 2021;70:82-92.
- Juanga-Labayen JP, Labayen IV, Yuan Q. A review on textile recycling practice and challenges. Textiles. 2022;2(1):174-188.
- Kazancoglu I, Kazancoglu Y, Yarimoglu E, Kahraman A. A conceptual framework for barriers of circular supply chains for sustainability in the textile industry. J Sustain Dev. 2020;28:1477-1492.
- Manickam P, Duraisamy G. 3Rs and circular economy. In: Circular Economy in Textiles and Apparel. Amsterdam: Elsevier; 2019. p. 77-93.
- Maslow AH. A theory of human motivation. Psychol Rev. 1943;50:370-396.
- Manglani H, Hodge GL, Oxenham W. Application of the internet of things in the textile industry. Text Prog. 2019;51:225-297.
- Paço A, Leal Filho W, Ávila LV, Dennis K. Fostering sustainable consumer behavior regarding clothing: Assessing trends on purchases, recycling, and disposal. Text Res J. 2020.
- Piribauer B, Bartl A. Textile recycling processes, state of the art and current developments: A mini-review. Waste Manag Res. 2019;37(2):112-119.
- Sowmya A, Nag S. From textile waste to fashion: A study on reusing textile waste for promoting sustainable fashion for its prospects. Int J Res Appl Sci Eng Technol (IJRASET). 2024;12(2).
- Shirvanimoghaddam K, Motamed B, Ramakrishna S, Naebe M. Death by waste: Fashion and textile circular economy case. Sci Total Environ. 2020;718:137317.
- Spathas T. The Environmental Performance of High Value Recycling for the Fashion Industry. Master's Thesis, Chalmers University of Technology, Gothenburg, Sweden; 2017.
- Winans K, Kendall A, Deng H. The history and current applications of the circular economy concept. Renew Sust Energ Rev. 2017;68:825-833.