
Research article · 2025 · Full text
International Journal of Biology SciencesProtein (Influenza) identification and quantification by different analytical techniques
Volume 7(3) · Pages 23–30 · DOI: 10.33545/26649926.2025.v7.i3a.314 ↗
Research areasMachine Learning in BioinformaticsInfluenza Virus Research Studies
Abstract
Author-writtenProteins make up more than half the dry weight of the cells. They contribute tothe structure of a cell and are obliged for cellular functions analogous as catalysisand molecular recognition. Also, the phenotypes are linked by the proteinsnot by the genes. The disquisition now a day is going in a direction towards thecharacterization of the proteome, or the whole set of the proteins set up in thecell, kerchief or organism. To understand how cell works, there is a demand ofidentification and characterization of the proteins. In short accurate protein quantitation is essential to protein studies in a multitude of disquisition motifs. Sothat a wide array of different protein assays has been developed to quantify andidentify both complex mixtures of proteins as well as a single type of proteins. Total protein quantitation styles include Bradford assay, BCA assay and Absorbance at 280m. Kjeldahl system is used to know the chance of proteinpresent in the sample. There are multitudinous ways for the identification ofproteins, mainly there are two ways performed during design work thatare SDS - runner and Immunoblotting. Estimation of the total proteinattention in bio Medicinals or remedial drugs is truly important. Itgives the information about the stability of the drugs. Stability testing is one ofthe essential ways on the path of drug development. The process determineswhether any changes like physical, chemical or microbiological affect the effectivenessand integrity of the final product. Particular fashion is been distributed todifferent samples depending on the structure of proteins, vacuity ofmorals and the perceptivity of the fashion. The acceptance criteria for all the mentioned ways were achieved.
Summary
Source-checkedPlain-language reading of the full paper, prepared with AI and checked against the text. Each point links to the authors' own words.
Why it matters
- Proteins are critical for cellular structure and functions such as molecular recognition and catalysis, comprising over half of a cell's dry weight. View evidence ↗
- Measuring total protein concentration in biomedical drugs is essential because it provides critical information regarding the stability of those drugs. View evidence ↗
- Proteomics is the large-scale study of protein identification, expression, and interactions to understand how protein structure relates to biological function. View evidence ↗
The question
- The study aims to utilize various protein assays to identify and quantify proteins, whether they are single types or complex mixtures. View evidence ↗
What they did
- The procedures for protein identification and quantification were performed at the biotech quality control department of Cadila Pharmaceutical Limited in Dholka, following Standard Test Procedures. View evidence ↗
- The study employed the Bradford Assay, BCA Assay, OD at 280nm, and Kjeldahl method for quantification, while using SDS-PAGE and Western blotting for identification. View evidence ↗
- For the Bradford Assay, a 1 mg/ml BSA stock solution was used, and absorbance was measured at 595 nm. View evidence ↗
- In the BCA Assay, samples were incubated at 37°C for 30 minutes, and absorbance was measured at 562 nm. View evidence ↗
- SDS-PAGE was conducted using a 12% resolving gel and a 4% stacking gel to separate proteins by molecular weight. View evidence ↗
What they found
- The Bradford Assay determined the total protein concentration in the sample to be 35.39 mg/ml. View evidence ↗
- The BCA Assay resulted in a total protein concentration of 0.125 mg/ml for the sample. View evidence ↗
- The study noted that the BCA assay measures protein in the range of 0.1-1.0 mg/ml at 562 nm, while the Bradford assay measures 0.05-0.5 mg/ml at 595 nm. View evidence ↗
- The authors found that the BCA assay is compatible with denaturing agents and detergents with low variability, whereas the Bradford assay is faster and compatible with reducing agents. View evidence ↗
What it means
- The authors concluded that the total protein concentrations of the samples measured by various analytical techniques fulfilled the required acceptance criteria. View evidence ↗
- The authors state that SDS-PAGE is a highly efficient technique for estimating protein size and purity because it requires only small amounts of protein. View evidence ↗
Visual summary
2 visualsIllustrations explain the paper; charts are replotted from the paper's own table values.
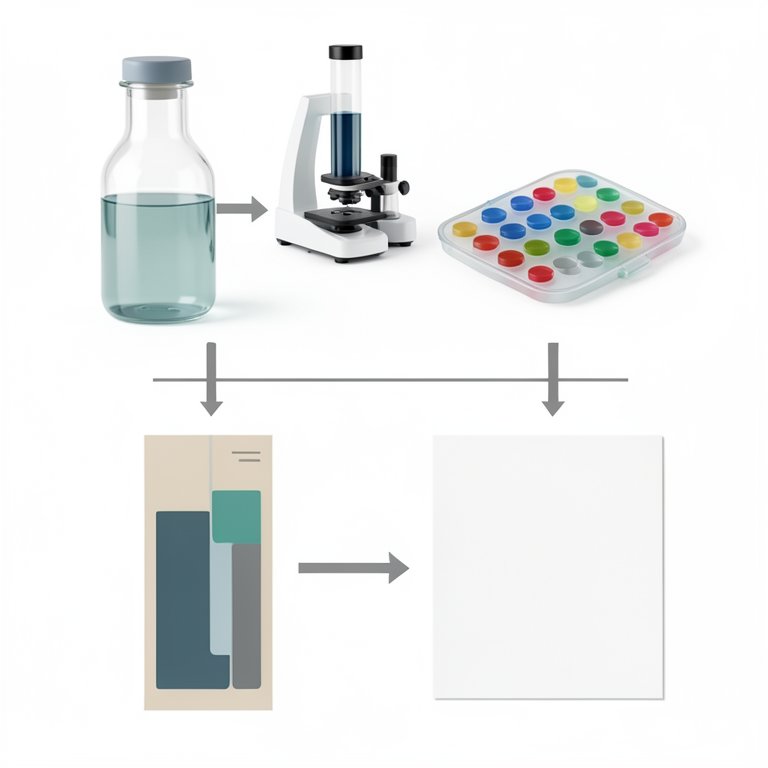
Protein Analysis Workflow
AI-generated conceptual illustration (Influenza virus proteins in a laboratory setting). It explains the idea and does not show study data.
View source evidence ↗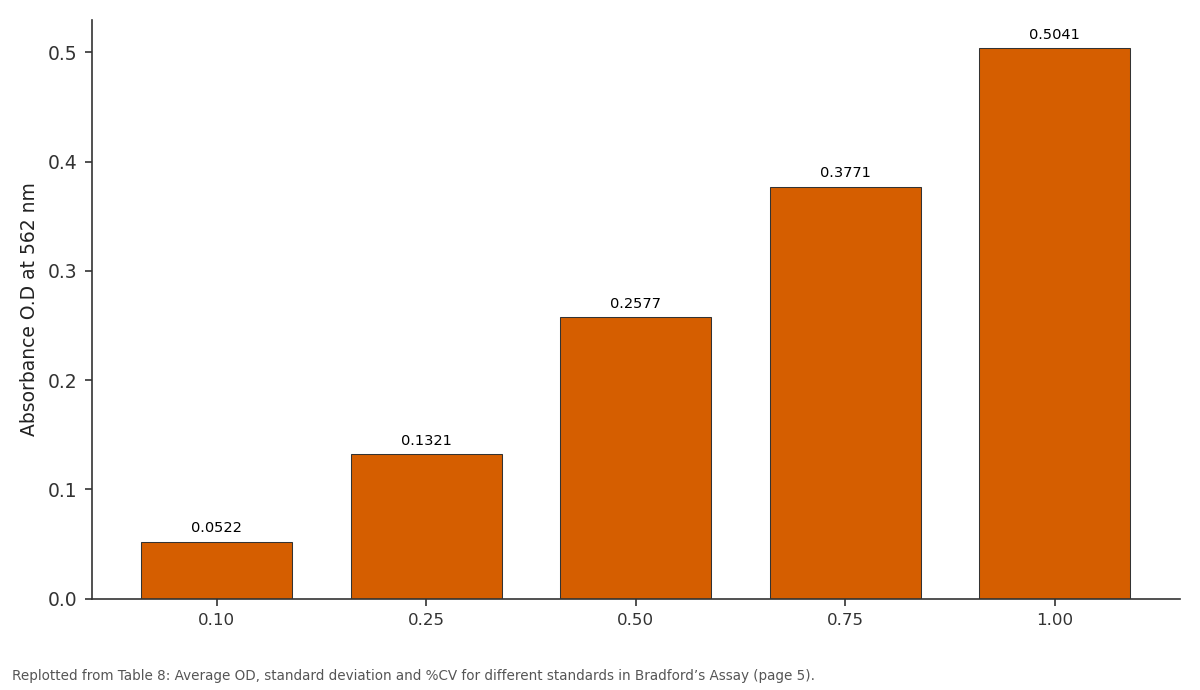
Absorbance O.D at 562 nm / Rep 1: 0.10 vs 0.25 vs 0.50 vs 0.75 vs 1.00
Replotted from Table 8 (page 5) of the original paper. Every bar is the paper's own table value.
View source evidence ↗Figures & tables
From the original paper Table 1
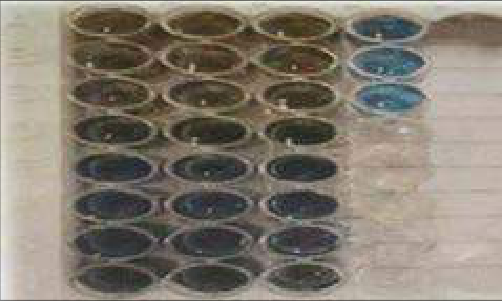 Figure 1
 Table 2
 Table 3
 Table 4
 Table 5
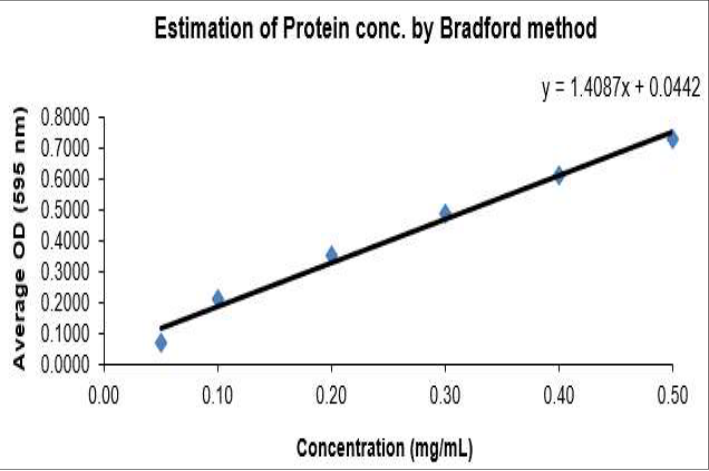 Figure 2
 Table 6
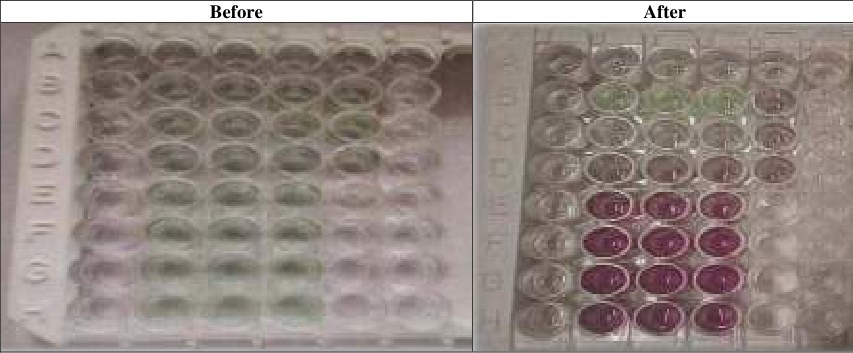 Table 6
 Table 7
 Table 8
 Table 9
 Table 10
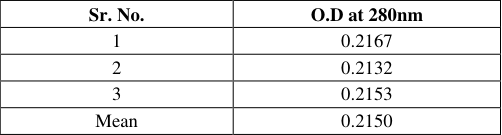 Table 11
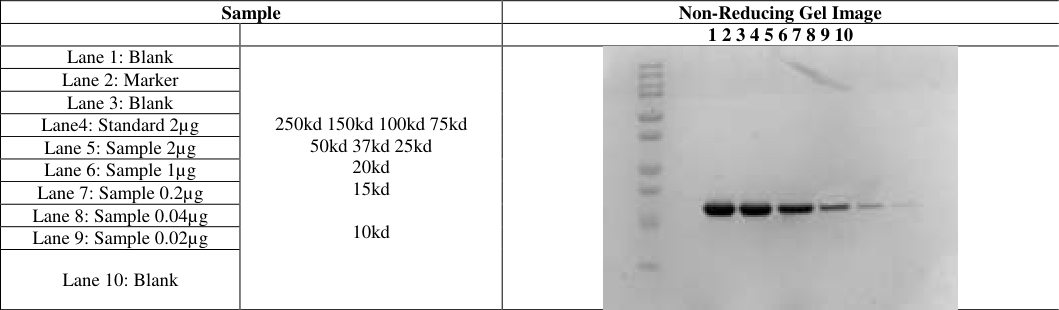 Table 12
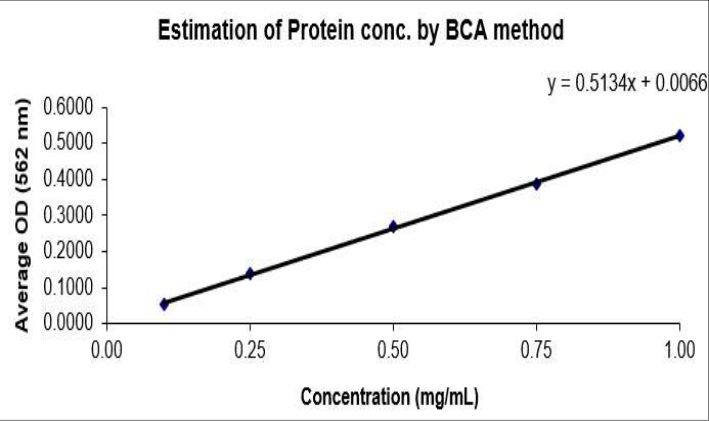 Figure 3
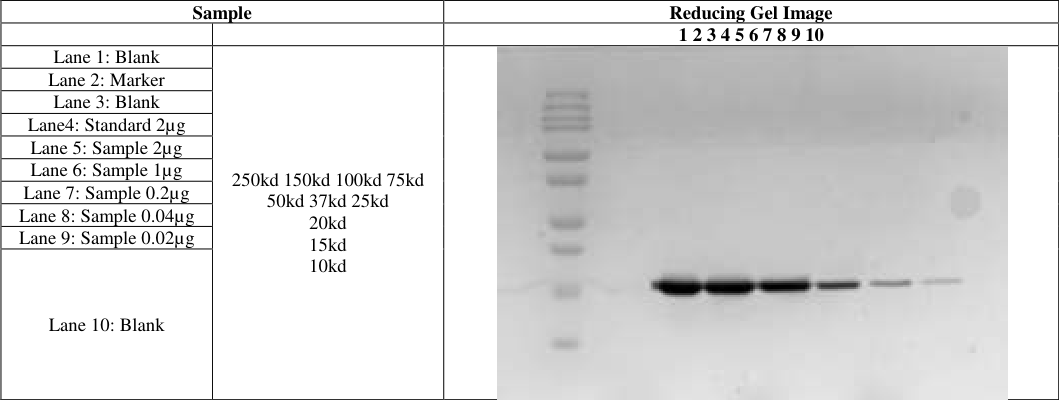 Table 13
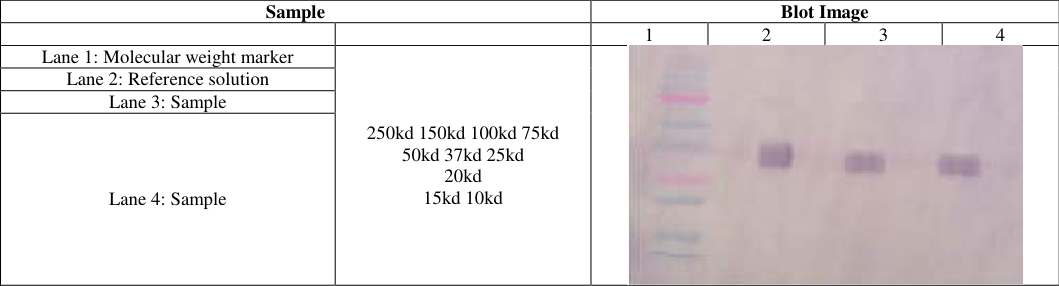 Table 4
Introduction
Proteins are large molecules made of amino acids, which are the basic building blocks of proteins. These amino acids contain carbon, hydrogen, oxygen, and nitrogen. In total, there are 22 standard amino acids that link together to form unbranched polymers. The connections between amino acids are called peptide links, forming polypeptide chains that can have different structures and functions. Proteins have four levels of structural organization: primary, secondary, tertiary, and quaternary, leading to their diverse properties. They are essential in food because they are a key energy source and provide important amino acids that the body cannot produce by itself. The term "drug" usually involves aspects like specificity, stability, solubility, and safety. There are strict regulatory issues surrounding the development of drugs, particularly vaccines, including checking for purity. The drug manufacturing process includes three key steps: producing experimental batches, submitting an Investigational New Drug notice for clinical testing, and thoroughly assessing the drug's characteristics and testing results before it reaches the market. Quality Control (QC) checks the identity, strength, and purity of drugs to ensure safety and efficacy, as impurities can lead to side effects. Therapeutic proteins are specially engineered proteins used for medical purposes. Their usage has grown significantly since insulin became the first therapeutic protein in the 1920s. Therapeutic proteins are categorized into three generations, ranging from recombinant versions of natural proteins to gene therapies. They perform various functions such as replacing missing proteins, enhancing biological pathways, and delivering drugs to specific sites within the body. Proteomics is the study of proteins, including their identification, expression, and interactions. This field aims to identify changes in protein expression, analyze protein modifications, and understand how protein structure relates to function. Different types of proteomics include expression proteomics, which examines how proteins change under different conditions; structural proteomics, which assesses the three-dimensional shapes of proteins; and functional proteomics, which investigates protein interactions. Quantifying and characterizing proteins is critical because proteins are involved in nearly all cellular processes. Understanding how proteins work helps in developing safe therapeutic proteins, which can cause serious side effects if not managed properly. Therefore, quantification of protein concentration is essential during drug development. Different techniques can be employed for protein quantitation, and selection depends on the stage of drug development and individual protein properties. When choosing a protein quantitation technique, one must consider various factors such as the stage of the drug production process, whether total protein content or a specific substance is measured, and the properties of proteins. Common assays for protein quantification include Bradford Assay and Bicinchoninic Acid (BCA) Assay. Techniques for protein identification include SDS-PAGE and immunoblotting. Successful applications of these methods are evident in areas like oncology, where proteomics aids in understanding cancer and tumor behavior; bio-medical research focusing on infections; agricultural research on plant responses to pests; and food safety by ensuring quality in food products through proteomic analysis. Protein is a complex substance found in all living organisms, composed of amino acid polymers. In 1902, Emil Fischer and Hofmeister made significant contributions to the understanding of proteins. They are vital for metabolic activities, and research into human genes and proteins aids in identifying potential new drugs for diseases. The term "proteomics" was introduced by Wilkins in 1995, referring to the large-scale study of all proteins in a cell line, tissue, or organism. Proteomics focuses on protein composition, structures, functions, and interactions, providing a deeper understanding of biological systems than genomics. Proteins usually function by working together, and proteomics aims to identify these interactions. However, studying proteomics is complex because protein expression can vary with time and environmental factors. Several methods have been developed to quantify proteins, typically categorized into two types based on their chemistry: copper chelation and dye binding. Common techniques for protein quantification include the Bradford assay, BCA assay, measurement of absorbance at 280 nm, and the Kjeldahl method. The Bradford/Coomassie Brilliant Blue assay, established in 1976, estimates protein concentration by measuring the dye's color change when it binds to protein. This method accurately measures specific amino acids but may not be suitable for all protein concentrations. It has various applications, including measuring protein levels in cerebrospinal fluid and adrenal tissue extracts. The BCA assay, created in 1985, uses a two-step process where proteins reduce cupric ions to cuprous ions, producing a colored complex measured at 560 nm. This method can quantify proteins even in challenging solutions, such as those with impurities. Absorbance at 280 nm is simple and estimates protein concentration based on the UV absorption of aromatic amino acids. It requires a minimal sample volume and is a quick method. The Kjeldahl method, introduced in 1883, measures nitrogen content to estimate protein. This widely used method in various analyses involves converting nitrogenous compounds into ammonium sulfate and quantifying ammonia. SDS-PAGE is a technique used in biochemistry to separate proteins by molecular weight. Proteins are denatured and run through polyacrylamide gels in an electric field, allowing for size-based separation. This method is essential for determining protein size and purity. Immunoblotting, or Western blotting, is a method that uses specific antibodies to detect proteins following SDS-PAGE. This technique allows for qualitative and quantitative analysis of proteins, identifying them with high sensitivity. Choosing the right protein assay depends on compatibility with the sample and the potential interference from other substances. Researchers often use different assays based on their specific needs, considering factors such as speed, volume, and accuracy. In summary, protein study through proteomics is critical for understanding biological systems and developing new treatments, with various methods available for protein quantification and analysis. Each method has advantages and disadvantages based on sample compatibility and other criteria. Researchers need to select the most suitable method to ensure accurate results.
Materials and Methods
The protein quantification and identification procedures were conducted at the biotechquality control department, r&d ii, cadilapharmaceutical limited, dholka, following the organization's Standard Test Procedure (STP). Various methods were used, including Bradford Assay, BCA Assay, OD at 280nm, Kjeldahl method for quantification, and SDS-PAGE and Western blotting for identification. For the Bradford Assay, specific reagents were used, including BSA from SIGMA and Bradford's reagent from BIO-RAD. Equipment needed included a multimode plate reader, centrifuge tubes, and micropipettes. To prepare the Bradford reagent, a 1 mg/ml BSA stock solution was made and stored at -20°C. Internal controls and test solutions were mixed properly, and absorbance was measured at 595 nm after incubating the plate. The protein concentration was calculated using a calibration curve plotted in Excel. The BCA Assay required additional reagents, such as a BSA stock solution from NIST. Similar materials and equipment to the Bradford Assay were used. The protein samples were diluted with DPBS, and a working BCA reagent was prepared. The absorbance was measured at 562 nm after incubating samples at 37°C for 30 minutes. The protein concentration was calculated in the same way as in the Bradford Assay. For OD at 280 nm, procedures included preparing the UV-Visible Spectrophotometer and using clean cuvettes to measure the absorbance. Protein concentration was determined using the Beer-Lambert law. The SDS-PAGE method involved various reagents including acrylamide, bromophenol blue, and sodium dodecyl sulfate from SIGMA. Preparation required creating a resolving buffer, stacking buffer, and diluting various components. A gel casting unit was set up for polymerization, and samples were prepared with either reducing or non-reducing dye. After loading the samples into the gel and running it, a silver staining method was used for visualization. Specific procedures for washing, fixing, and developing the gel were followed to produce clear results. Immunoblotting involves several key components, including a variety of chemicals, buffers, antibodies, glassware, and equipment. Some of the essential chemicals and their sources are sodium hydrogen phosphate, tris, sodium chloride, Tween 20, skimmed milk, and various others from suppliers like Amersco, Sigma, and Cadila. Important buffers used include transfer buffer, phosphate buffer, phosphate buffered saline, and blocking reagent. Antibodies required in the process include primary and secondary antibodies, specifically rabbit anti-goat IgG conjugates. The necessary glass and plastic wares include nitrocellulose membranes, Whatman filter paper, cold packs, forceps, and trays. Equipment needed for immunoblotting also includes miniature trans-blotters and -80°C freezers for storing antibodies. The preparation phase involves several reagents, including making a 10X transfer buffer by dissolving Tris and glycine in water. This buffer can be stored at room temperature. Other buffers, such as 0. 5 M phosphate buffer and phosphate buffered saline, are also prepared and can be stored at room temperature. Blocking reagent is made by dissolving skimmed milk in PBST, while primary and secondary antibodies are diluted in skimmed milk before being applied to blots. Additionally, a developing solution is created using DAB and hydrogen peroxide in a phosphate buffer.
During gel preparation, clean casting plates are assembled, checked for leaks, and a 12% resolving gel is prepared by mixing specified amounts of water, acrylamide, Tris, SDS, APS, and TEMED. This gel solution is poured between the plates and allowed to polymerize. A 4% stacking gel is similarly prepared and layered on top, following which the gel is allowed to set with the comb added to form wells. Samples are prepared by mixing them with a non-reducing dye and heating them. The loading pattern outlines how to place the blank, standards, and samples into the gel wells. Once loaded, the gel is connected to a power supply and run until the dye reaches the gel's end. For the blot setup, glass plates are removed from the gel, and the gel is soaked in a transfer buffer. A nitrocellulose membrane and filter papers are soaked in the buffer and the membrane is pre-wetted in methanol. The transfer sandwich is assembled carefully to avoid air bubbles, filling the tank with chilled transfer buffer for 90 minutes at a set current. After transferring proteins to the membrane, a blocking step is conducted using 5% skimmed milk in PBST. The primary antibody is then added and incubated, followed by washing. A secondary antibody is added, followed by additional washes. To develop the blot, the developing solution is applied and gently stirred. After development, the blot is rinsed, dried, scanned, and stored for result interpretation. Each step, from preparation to development, is crucial for achieving accurate results in Immunoblotting. From the results OD of the Blank was subtracted and standard graph of OD of standards was constructed using "MAGELLAN" software. From this concentration can be found for the given sample:
Bradford assay Result
Bradford assay Result
Before After
A purple colour development from green to purple is being seen after 30 minutes incubation.Observe the absorbance of the sample at 562 nm. From the results total protein concentration in sample was 0.125 mg/ml.
Bradford and BCA assay Comparison
BCA cinsiders the range of protein from 0.1-1.0 mg/ml, Bradford considers the range ofprotein from 0.05 -0.5 mg/ml, the absorbance is measured at different wavelength at 562 nm and 595 nm for BCA assay and Bradford assay. BCA is compatiable with the detergents, the agents and the low variablity. Bradford is rapid and compatiable with the reducing agents.
OD at 280nm
Result: For the absorbance of blank formulation buffer is being used and samples was diluted to 1:5 with the use of formulation buffer itself. All the readings were taken in triplicates and the calculations was done by using mean value and the dilution factor were prepared (1:5). = 0.65 mg/ml So, the sample concentration of protein was 0.65 mg/ml. I also adore to thanks all casual for rendering all sorts of help during my experimental work. Many thanks to Mr. Jagdish Makwana for always providing me with the clean glass wares and other necessities for my work. I also want to express my thanks to my beloved parents and family members for their love, supports and well wishes. Above all I thanks the almighty for hid choicest blessings that makes everything possible.
SDS-Page
SDS-Page
Acknowledgement
Acknowledgments
Figures and tables from the paper
| — | 1 | 2 | 3 | 4 | 5 | 6 |
|---|---|---|---|---|---|---|
| A. | 0.31 | 0.315 | 0.3164 | 0.829 | 0.8294 | 0.8365 |
| B. | 0.3785 | 0.38 | 0.3852 | |||
| C. | 0.5368 | 0.5292 | 0.5004 | |||
| D. | 0.6632 | 0.6678 | 0.6667 | |||
| E. | 0.7569 | 0.8066 | 0.8344 | |||
| F. | 0.9437 | 0.9194 | 0.91 | |||
| G. | 1.0478 | 1.0369 | 1.0302 | |||
| H. | 0.7745 | 0.7596 | 0.7585 |
Table text extracted from the original PDF; superscript letters are shown inline. The original table image is below.
View original table image
| Std Conc. (mg/ml) | Absorbance O.D at 595 nm | — | — | Avg. OD | SD | % CV |
|---|---|---|---|---|---|---|
| Rep 1 | Rep 2 | Rep 3 | ||||
| 0.5 | 0.0647 | 0.0662 | 0.0714 | 0.0674 | 0.0035 | 5.21 |
| 0.10 | 0.2230 | 0.2154 | 0.1866 | 0.2083 | 0.0192 | 9.22 |
| 0.20 | 0.3494 | 0.3540 | 0.3529 | 0.3521 | 0.0024 | 0.68 |
| 0.30 | 0.4431 | 0.4928 | 0.5206 | 0.4855 | 0.0393 | 8.09 |
| 0.40 | 0.6299 | 0.6056 | 0.5962 | 0.6106 | 0.0174 | 2.85 |
| 0.50 | 0.7340 | 0.7231 | 0.7164 | 0.7245 | 0.0089 | 1.23 |
Table text extracted from the original PDF; superscript letters are shown inline. The original table image is below.
View original table image
| Absorbance O.D at 595 nm | — | — | Avg. O.D | SD | %CV | Dilution | Protein(mg/ml) |
|---|---|---|---|---|---|---|---|
| Rep 1 | Rep 2 | Rep 3 | |||||
| 0.4607 | 0.4458 | 0.4447 | 0.4504 | 0.0089 | 1.98 | 1 | 0.288 |
Table text extracted from the original PDF; superscript letters are shown inline. The original table image is below.
View original table image
| Absorbance O.D at 595 nm | — | — | Avg. O.D | SD | %CV | Dilution | Protein (mg/ml) | Mean (mg/ml) |
|---|---|---|---|---|---|---|---|---|
| Rep 1 | Rep 2 | Rep 3 | ||||||
| 0.5152 | 0.5156 | 0.5227 | 0.5178 | 0.0042 | 0.81 | 100 | 33.62 | 33.62 |
Table text extracted from the original PDF; superscript letters are shown inline. The original table image is below.
View original table image
| — | 1 (Mg/ml) | 2 (Mg/ml) | 3 (Mg/ml) | 4 (Mg/ml) | 5 (Mg/ml) | 6 (Mg/ml) |
|---|---|---|---|---|---|---|
| A | B | B | B | 1 | 1 | 1 |
| B | 0.1 | 0.1 | 0.1 | 1 | 1 | 1 |
| C | 0.25 | 0.25 | 0.25 | 1 | 1 | 1 |
| D | 0.5 | 0.5 | 0.5 | 1 | 1 | 1 |
| E | 0.75 | 0.75 | 0.75 | 1 | 1 | 1 |
| F | 1 | 1 | 1 | 1 | 1 | 1 |
| G | IC | IC | IC | 1 | 1 | 1 |
| H | Empty | Empty | Empty |
Table text extracted from the original PDF; superscript letters are shown inline. The original table image is below.
View original table image
| — | 1 | 2 | 3 | 4 | 5 | 6 |
|---|---|---|---|---|---|---|
| A | 0.0923 | 0.0912 | 0.0922 | 0.4586 | 0.4599 | 0.4758 |
| B | 0.1441 | 0.1443 | 0.1488 | |||
| C | 0.224 | 0.2292 | 0.2341 | |||
| D | 0.3496 | 0.3607 | 0.372 | |||
| E | 0.469 | 0.4724 | 0.4984 | |||
| F | 0.596 | 0.6086 | 0.6299 | |||
| G | 0.3522 | 0.3592 | 0.3691 | |||
| H | Empty |
Table text extracted from the original PDF; superscript letters are shown inline. The original table image is below.
View original table image
| Std Conc. (mg/ml) | Absorbance O.D at 562 nm | — | — | Avg. OD | SD | %CV |
|---|---|---|---|---|---|---|
| Rep 1 | Rep 2 | Rep 3 | ||||
| 0.10 | 0.0522 | 0.0524 | 0.0569 | 0.0538 | 0.0027 | 4.94 |
| 0.25 | 0.1321 | 0.1373 | 0.1422 | 0.1372 | 0.0051 | 3.68 |
| 0.50 | 0.2577 | 0.2688 | 0.2801 | 0.2689 | 0.0112 | 4.17 |
| 0.75 | 0.3771 | 0.3805 | 0.4065 | 0.3880 | 0.0161 | 4.14 |
| 1.00 | 0.5041 | 0.5167 | 0.5380 | 0.5196 | 0.0171 | 3.30 |
Table text extracted from the original PDF; superscript letters are shown inline. The original table image is below.
View original table image
| Absorbance O.D at 595 nm | — | — | Avg. O.D | SD | %CV | Dilution | Protein(mg/ml) |
|---|---|---|---|---|---|---|---|
| Rep 1 | Rep 2 | Rep 3 | |||||
| 0.2603 | 0.2673 | 0.2772 | 0.2683 | 0.0085 | 3.1653 | 1 | 0.510 |
Table text extracted from the original PDF; superscript letters are shown inline. The original table image is below.
View original table image
| Absorbance O.D at 595 nm | — | — | Avg.O.D | SD | %CV | Dilution | Protein (mg/ml) | Mean (mg/ml) |
|---|---|---|---|---|---|---|---|---|
| Rep 1 | Rep 2 | Rep 3 | ||||||
| 0.3667 | 0.3680 | 0.3839 | 0.3729 | 0.0096 | 2.5685 | 1 | 0.714 | 0.714 |
Table text extracted from the original PDF; superscript letters are shown inline. The original table image is below.
View original table image
| Sr. No. | O.D at 280nm |
|---|---|
| 1 | 0.2167 |
| 2 | 0.2132 |
| 3 | 0.2153 |
| Mean | 0.2150 |
Table text extracted from the original PDF; superscript letters are shown inline. The original table image is below.
View original table image
References
18 in the original paper- Ito R, De G, Suguimoto HH. Permeabilization of Saccharomyces fragilis IZ 275 cells with ethanol to obtain a biocatalyst with lactose hydrolysis capacity. Acta Sci Biol Sci. 2016 Oct 24;38(2):149-149.
- Zaręba-Kozioł M, Bartkowiak-Kaczmarek A, Figiel I, Krzystyniak A, Wojtowicz T, Bijata M, et al. Stressinduced changes in the S-palmitoylation and Snitrosylation of synaptic proteins. Biol Chem. 2019 Jul 16;18(10):1916-1938.
- Figeys D, Van Oostveen I, Ducret A, Aebersold R. Protein identification by capillary zone electrophoresis/microelectrospray ionization-tandem mass spectrometry at the subfemtomole level. Anal Chem. 1996 Jun 1;68(11):1822-1828.
- Fleenor WA, Stott GH. Single radial immunodiffusion analysis for quantitation of colostral immunoglobulin concentration. J Dairy Sci. 1981 May;64(5):740-747.
- Graves PR, Haystead TAJ. Molecular biologist's guide to proteomics. Microbiol Mol Biol Rev. 2002 Mar 1;66(1):39-63.
- Albalat A, Husi H, Stalmach A, Schanstra JP, Mischak H. Classical MALDI-MS versus CE-based ESI-MS proteomic profiling in urine for clinical applications. Bioanalysis. 2014 Jan;6(2):247-266.
- Kruger NJ. The Bradford method for protein quantitation. In: Basic protein and peptide protocols. 2019;32:9-16.
- Mant CT, Chen Y, Yan Z, Popa TV, Kovacs JM, Mills JB, et al. HPLC analysis and purification of peptides. In: Peptide characterization and application protocols. 2007;386:3-55. Available from: https://link.springer.com/protocol/10.1007%2F978-159745-430-8_1
- Otieno BA, Krause CE, Rusling JF. Bioconjugation of antibodies and enzyme labels onto magnetic beads. Methods Enzymol. 2016;571:135-150.
- Pergande MR, Cologna SM. Isoelectric point separations of peptides and proteins. Proteomes. 2017 Jan 25;5(1). Available from: https://www.ncbi.nlm.nih.gov/pmc/articles/PMC53722 25/
- Roy J, Jain N, Singh G, Das B, Mallick B. Small RNA proteome as disease biomarker: An incognito treasure of clinical utility. In: AGO-driven non-coding RNAs. 2019;101-136.
- Roy S, Kumar V. A practical approach on SDS PAGE for separation of protein. Int J Sci Res. 2014;3(8). Available from: https://www.ijsr.net/archive/v3i8/MDIwMTU0MDk=.p df 13. Sane R, Sinz M. Chapter 1 -Introduction of drug metabolism and overview of disease effect on drug metabolism. In: Xie W, editor. ScienceDirect. Boston: Academic Press; 2017. p. 1-19. Available from: https://www.sciencedirect.com/science/article/pii/B978 0128029497000018
- Sundaram V, Nachimuthu S, Ponnusamy R. Simultaneous saccharification and fermentation of starch from Pongamia pinnata oilcake into ethanol. J Biomass Biofuel. 2016;
- Shen CH. Quantification and analysis of proteins. ResGate. 2019. Available from: https://www.researchgate.net/publication/332236170_Q uantification_and_Analysis_of_Proteins
- Wittmann-Liebold B, Graack HR, Pohl T. Twodimensional gel electrophoresis as a tool for proteomics studies in combination with protein identification by mass spectrometry. Proteomics. 2006 Sep;6(17):46884703.
- Walker JM. The bicinchoninic acid (BCA) assay for protein quantitation. In: Basic protein and peptide protocols. 2019;32:5-8. Available from: https://link.springer.com/protocol/10.1385%2F0-89603268-X%3A5
- Waterborg JH, Matthews HR. The Lowry method for protein quantitation. Proteins. 1984;1-4.
- Watford M, Wu G. Protein. Adv Nutr. 2018 Jul 27;9(5):651-3. Available from: https://www.ncbi.nlm.nih.gov/pmc/articles/PMC61404