
Research article · 2025 · Full text
International Journal of Veterinary Sciences and Animal HusbandryHypomagnesemia-induced hypocalcemia: Effects on erythrocyte membrane stability in lactating jersey and Holstein-Friesian crossbreed dairy cattle
Volume 10(3) · Pages 244–247 · DOI: 10.22271/veterinary.2025.v10.i3d.2139 ↗
Research areasMagnesium in Health and Disease
Abstract
Author-writtenThis study compared blood minerals, hematological parameters, and erythrocyte fragility in Jersey Cross (JX) and Holstein-Friesian Cross (HFX) cattle breeds. Significant breed differences were observed in serum calcium levels (JX: 4.34±0.17 mg/dL vs. HFX: 6.26±0.26 mg/dL, p
Summary
Source-checkedPlain-language reading of the full paper, prepared with AI and checked against the text. Each point links to the authors' own words.
Why it matters
- The dairy sector in Tamil Nadu depends significantly on Holstein Friesian and Jersey crossbred cattle to satisfy the rising demand for milk. View evidence ↗
- Prioritizing high milk and fat production has negatively impacted the health and fertility of dairy cows, increasing the occurrence of metabolic disorders like hypomagnesemia, ketosis, and milk fever. View evidence ↗
The question
- The study aimed to evaluate whether the Erythrocyte Osmotic Fragility (EOF) test could effectively diagnose oxidative stress caused by magnesium deficiency in Jersey and Holstein-Friesian crossbreed cattle. View evidence ↗
What they did
- The researchers studied 40 crossbred dairy cows (20 Jersey and 20 Holstein-Friesian) from village-level farms in the Kudimangalam block of the Tiruppur district. View evidence ↗
- Serum and whole blood samples (5 ml each) were collected from all 40 lactating cows using sterile syringes. View evidence ↗
- Serum calcium and magnesium levels were measured using quantitative colorimetric kits and a photoelectric colorimeter at 540 nm. View evidence ↗
- Hematological parameters, including hemoglobin, red blood cell count, packed cell volume, and erythrocyte indices, were analyzed using a Meril Cellquant 360 hematology analyzer. View evidence ↗
- The Erythrocyte Fragility Test (EFT) involved mixing 20 μl of EDTA whole blood with various phosphate-buffered NaCl dilutions, with testing completed within 24 hours of collection. View evidence ↗
What they found
- Jersey crossbreed (JX) cattle had significantly lower serum calcium levels (4.34±0.17 mg/dL) than Holstein-Friesian crossbreed (HFX) cattle (6.26±0.26 mg/dL). View evidence ↗
- Serum magnesium levels were significantly lower in JX cattle (0.93±0.05 mg/dL) compared to HFX cattle (1.60±0.04 mg/dL). View evidence ↗
- JX cattle exhibited a significantly lower Mean Corpuscular Volume (64.06±0.98 fL) than HF cattle (75.95±0.99 fL). View evidence ↗
- Hemoglobin levels were significantly lower in JX cattle (4.81±0.16 g/dL) compared to HF cattle (5.65±0.25 g/dL). View evidence ↗
- Erythrocyte fragility was significantly higher in JX cattle (0.10±0.02) than in HF cattle (0.33±0.02), indicating that JX red blood cells are more susceptible to hemolysis. View evidence ↗
- There was no statistically significant difference in red blood cell counts between JX cattle (4.70±0.18 x 10⁶/µL) and HF cattle (4.65±0.17 x 10⁶/µL). View evidence ↗
What it means
- The authors concluded that Jersey crossbreed cattle are more prone to cellular dysfunction and oxidative stress resulting from magnesium deficiency. View evidence ↗
- The authors recommend using the erythrocyte fragility test to identify at-risk animals and implement preventive measures, including antioxidant and magnesium supplementation. View evidence ↗
Visual summary
3 visualsIllustrations explain the paper; charts are replotted from the paper's own table values.
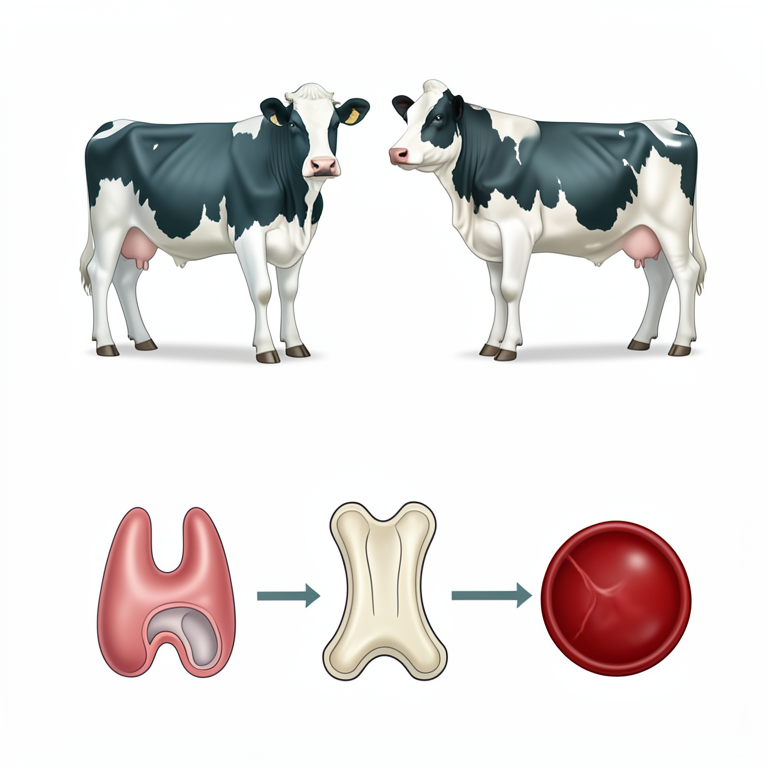
Magnesium-Calcium Homeostasis Pathway
AI-generated conceptual illustration (Jersey and Holstein-Friesian crossbreed dairy cattle). It explains the idea and does not show study data.
View source evidence ↗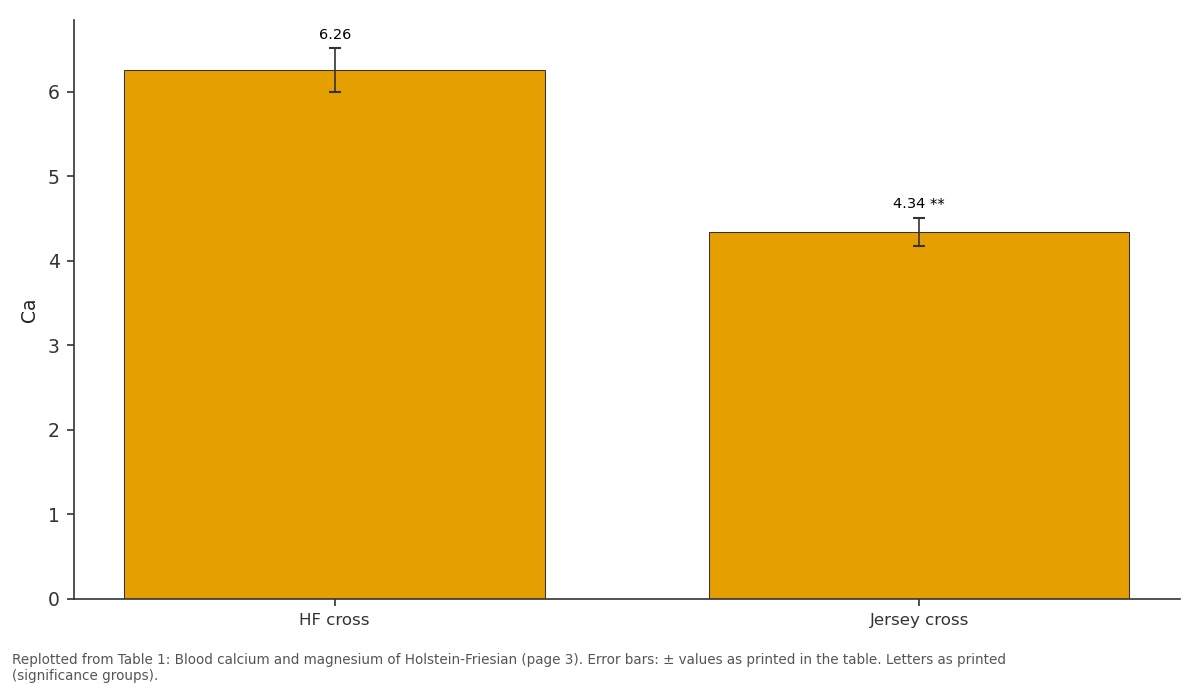
Ca: HF cross vs Jersey cross
Replotted from Table 1 (page 3) of the original paper. Every bar is the paper's own table value.
View source evidence ↗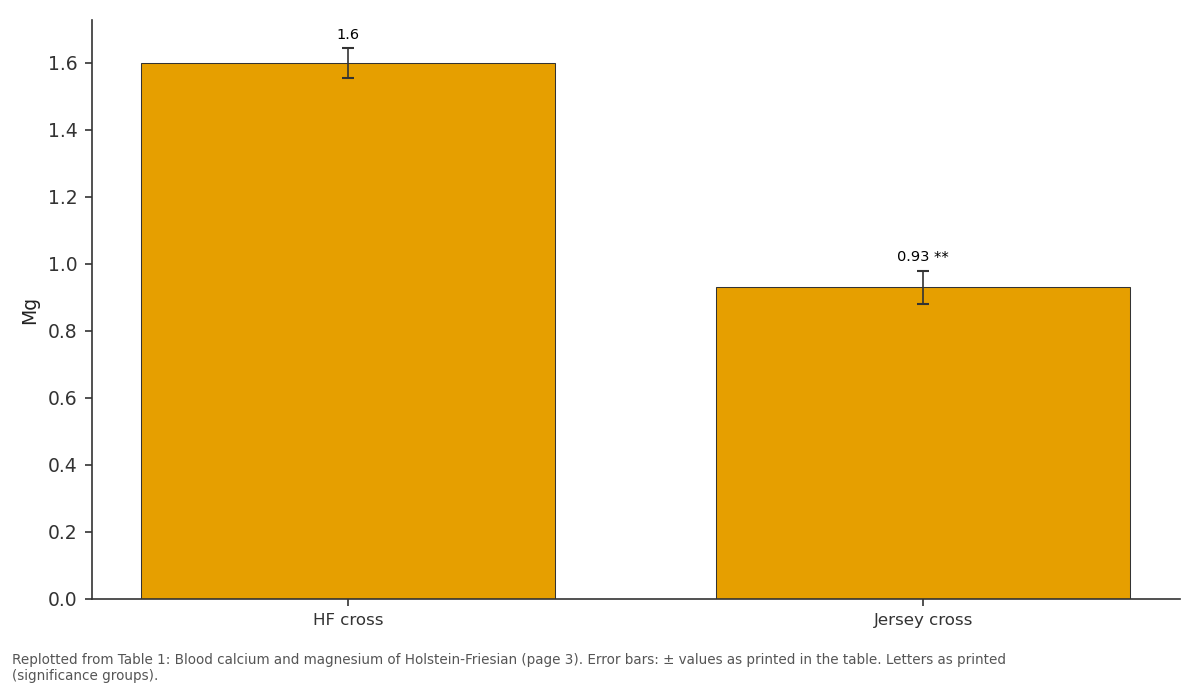
Mg: HF cross vs Jersey cross
Replotted from Table 1 (page 3) of the original paper. Every bar is the paper's own table value.
View source evidence ↗Figures & tables
From the original paper Table 1
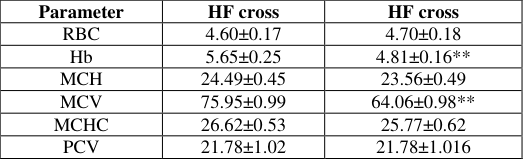 Table 2
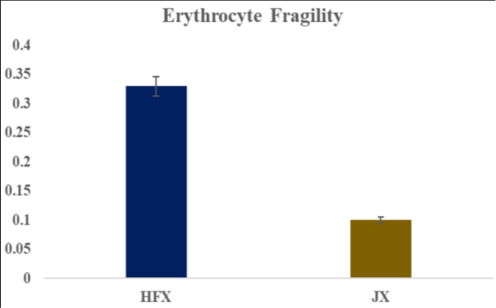 Figure 1
Introduction
Tamil Nadu's dairy sector relies heavily on crossbred cattle, particularly Holstein Friesian and Jersey breeds, to meet the increasing demand for milk production (Vijayakumar, et al., 2019) [24] . However, the focus on high milk production and fat content has compromised the health and fertility of dairy cows (Hernandez CT, 2013) [7] . This has led to a surge in metabolic disorders, including milk fever, ketosis, hypomagnesemia (Mulligan and Doherty, 2008) [14] . The transition period between late pregnancy and early lactation is the most significant risk period for these disorders (Roche et al., 2013).A deficiency in essential minerals like calcium, phosphorus, magnesium, or potassium can impair a cow's ability to stand, particularly postpartum. Calcium plays a crucial role in muscle contraction, and milk fever symptoms include ataxia, flaccid paresis, and recumbence (GoffJ P, et al., 2006) [6] . Dairy cows are prone to milk fever due to increased calcium demands during parturition and lactation. Hypocalcemia occurs when blood calcium concentrations fall below 1.87 mmol/L, with normal serum concentrations ranging from 2.0 to 2.5 mmol/L. The incidence of milk fever is around 5-7% in confined cows (Goff, 2005) [17] and 5% in grazing systems (Martín-Tereso J, et al., 2014). As cows age, their ability to mobilize calcium from bone decreases, making them more susceptible to milk fever (Krehbiel, 2014).High-yielding cows are more prone to energy deficiencies and metabolic diseases due to their high energy demands (Mulligan et al., 2006b) [13] . Heifers have a lower risk of milk fever than multiparous cows, but their risk increases by 9% with each additional lactation (DeGaris P, et al., 2006) [10] . Magnesium (Mg) is an essential element in a cow's diet, playing a crucial role in various bodily functions (Dairy NZ, 2009) [5] . Mg is necessary for parathyroid hormone (PTH) secretion and activity, which regulates calcium homeostasis. A deficiency in Mg can lead to impaired PTH secretion and resistance to PTH receptors, reducing a cow's ability to maintain calcium homeostasis. Mg deficiency can also lead to anemia, increased intestinal absorption of iron, decreased red blood cell counts (Sanchez-MoritoN, et al., 2014) [21] and magnesium deficiency may be compromising the integrity of the erythrocyte membrane, making it more susceptible to oxidative damage (Lerma et al., 1995) [11] . Cortisol measurement is a common stress indicator, but its assessment through Radioimmunoassay (RIA) and Enzyme-Linked Immunosorbent Assay (ELISA) is complex and impractical for large-scale animal welfare screening (Pawlusky et al., 2017) [15] . Therefore, simpler evaluation indices are needed. Erythrocyte Osmotic Fragility (EOF) is a promising index, already valuable in assessing oxidative stress and transport stress in pigs (Asala et al., 2011) [1] . EOF measures red blood cell sensitivity to osmotic changes, reflecting cell volume, membrane integrity, and surface area (Islah et al., 2016) [8] . This study aimed to assess EOF's effectiveness in diagnosing magnesium-induced oxidative stress in Holstein-Friesian and Jersey crossbreed cattle.
Materials and Methods
This study examined milk production and hypocalcemia in 40 crossbred dairy cows (20 Holstein-Friesian and 20 Jersey) managed in village-level dairy farms in Kudimangalam block, Tiruppur district. Data collection was facilitated by veterinary officer, with on-site records including breed, parity, calving date, date of milk fever occurrence, and 305-day total milk production per cow. Clinical diagnosis of milk fever was based on distinct signs, including weakness, trembling, muscle contractions, tachycardia, hyperthermia, and tetany.
Hematological and Biochemical Analyses
Blood samples (5 ml) both whole blood and serum were collected from each of the 40 lactating dairy cows using sterile disposable syringe. Serum transferred into vacutainer tubes without anticoagulant and whole blood into EDTA added vacutainer tubes. The samples were kept at room temperature for one hours, then blood samples were centrifuged at 3000 rpm for 15 minutes, and the serum was collected in Eppendorf tubes using pasture pipettes and stored at-20 °C until analysis.
Biochemical Parameters
Selective biochemical parameters, including serum calcium and magnesium levels, were determined using commercial test kits according to the manufacturer's instructions. Serum calcium concentration was measured using the quantitative colorimetric Kit (Arkray Liquid Gold Calcium Test Kit, Arkray Pvt Ltd, Mumbai, India), while magnesium concentration was measured using the quantitative colorimetric Kit (Magnesium-L (monoTM) Calmagite Method, Reckon Diagnostic Private Ltd, Gujarat, India) using a photoelectric colorimeter (Systronics, Haryana, India) at 540 nm.
Hematological parameters
One ml of EDTA added blood used for measuring Hematological parameter such as total red blood cell count, Hemoglobin, Packed cell volume and erythrocyte indices using a hematology analyzer (Meril, Cellquant 360, India).
Erythrocyte Fragility Test (EFT)
EFT was performed as previously described by Tritschler et al., (2016) [23] . Samples were tested within 24 hours of collection. Briefly, 20 μl of EDTA whole blood was mixed with a series of 2 ml phosphate-buffered NaCl dilutions. After incubation at room temperature for 30 minutes, samples were centrifuged (2000 g/10 minutes), and optical densities of the supernatant of hemolysed RBC were used to detect percentage hemolysis using a photoelectric colorimeter (Systonics, Haryana, India) at 540 nm. The percentage of hemolysis in each concentration of saline was calculated assuming 100% hemolysis in distilled water.
Statistical analysis
Data were entered in Microsoft Excel 2019 and transferred to IBM SPSS (Statistical Package for Social Science) statistics 20.0 software. All data are expressed as mean±standard error of the mean (SEM). Differences were considered to be statistically significant at p<0.001.
Results
Results
Biochemical Parameters
The mean ± SE values of blood calcium and magnesium of Holstein-Friesian crossbreed and jersey crossbreed are represented in Table 1. The serum calcium and magnesium levels showed significant breed differences between Jersey crossbreed (JX) and Holstein Friesian crossbreed (HFX) cattle. The serum calcium levels were significantly lower in JX cattle (4.34±0.17 mg/dL) compared to HFX cattle (6.26±0.26 mg/dL) (p<0.001). Similarly, the serum magnesium levels were also significantly lower in JX cattle (0.93±0.05 mg/dL) compared to HFX cattle (1.60±0.04 mg/dL) (p<0.001).
| Parameter | HF cross | Jersey cross |
|---|---|---|
| Ca | 6.26±0.26 | 4.34±0.17** |
| Mg | 1.60±0.045 | 0.93±0.05** |
Table text extracted from the original PDF; superscript letters are shown inline. The original table image is below.
View original table image
Hematological Parameters
The mean ± SE values of Erythrocyte indices of Holstein Friesian crossbreed and jersey crossbreed are represented in Table 2. The Red Blood Cell Count (RBC) was slightly higher in Jersey crossbreed (JX) cattle (4.70±0.18 x 10 6 /µL) compared to Holstein-Friesian (HF) cattle (4.65±0.17 x 10 6 /µL), but the difference was not statistically significant. Both breeds showed similar Packed Cell Volume (PCV) values, with JX cattle at 21.78±1.02% and HF cattle at 21.78±1.02%. However, a significant difference was observed in Mean Corpuscular Volume (MCV), with JX cattle having a lower value (64.06±0.98 fL) compared to HF cattle (75.95±0.99 fL). No significant differences were found in Mean Corpuscular Hemoglobin (MCH) and Mean Corpuscular Hemoglobin Concentration (MCHC) between the two breeds. Nevertheless, a significant difference was observed in hemoglobin levels, with JX cattle having lower values (4.81±0.16 g/dL) compared to HF cattle (5.65±0.25 g/dL).
| Parameter | HF cross | HF cross |
|---|---|---|
| RBC | 4.60±0.17 | 4.70±0.18 |
| Hb | 5.65±0.25 | 4.81±0.16** |
| MCH | 24.49±0.45 | 23.56±0.49 |
| MCV | 75.95±0.99 | 64.06±0.98** |
| MCHC | 26.62±0.53 | 25.77±0.62 |
| PCV | 21.78±1.02 | 21.78±1.016 |
Table text extracted from the original PDF; superscript letters are shown inline. The original table image is below.
View original table image
Erythrocyte Fragility
The mean ± SE values of Erythrocyte fragility of Holstein Friesian crossbreed and jersey crossbreed are represented in Figure 1. The erythrocyte fragility was significantly higher in JX cattle (0.10±0.02) compared to HF cattle (0.33±0.02) (p<0.001). This indicates that the red blood cells of JX cattle are more susceptible to hemolysis compared to those of HF cattle.
Discussion
The significant breed difference in serum calcium levels observed in this study, with JX cattle having lower levels compared to HF cattle (p<0.001), is consistent with previous reports highlighting the increased susceptibility of Jersey cattle to milk fever (Chiwome, B, et al., 2017) [3] . The lower serum calcium levels in JX cattle may be attributed to their higher milk yield relative to their body size, as well as potential breed-specific differences in calcium metabolism (Mulligan et al., 2006) [13] . This study's findings suggest that Jersey cattle may be more prone to milk fever due to lower vitamin D receptor levels (Goff, 2005) [17] . Breed-specific differences in the secretory enzyme Ca2+-ATPase in mammary tissue and milk fat globule membranes (Prapong et al., 2005) may also contribute to the observed differences in serum calcium levels between JX and HF cattle. Additionally, factors such as age-related declines in hormone receptor numbers can impede intestinal calcium absorption, with Jersey cows having fewer 1,25-dihydroxyvitamin D3 receptors in their intestinal mucosa compared to Holstein cows (Goff et al., 2005) [17] . The significantly lower serum magnesium levels observed in JX cattle (0.93±0.05 mg/dL) compared to HF cattle (1.60±0.04 mg/dL) (p<0.001) have important implications for calcium metabolism and milk fever susceptibility. Hypomagnesemia, or low magnesium levels, is known to impair parathyroid hormone (PTH) secretion and its effects on target organs, leading to reduced calcium mobilization from (Goff et al., 2005) [17] . This increases the risk of milk fever, as demonstrated by Sansom et al. (1983) [22] , who showed that hypomagnesemia significantly impairs calcium mobilization in cows. The importance of adequate magnesium intake at parturition is underscored by a meta-analysis examining the causal factors of milk fever, which revealed that increasing dietary magnesium from 0.3% to 0.4% dry matter reduces the risk of milk fever by approximately 62% (Lean et al., 2006) [10] . The significantly lower serum magnesium levels in JX cattle may contribute to their increased susceptibility to milk fever. Hypomagnesemia has a two-fold impact on calcium metabolism, reducing PTH secretion in response to hypocalcemia and decreasing tissue sensitivity to PTH. (Sansom et al., 1983) [22] . The interaction between PTH and its receptor is crucial for maintaining calcium homeostasis, and hypomagnesemia can disrupt this interaction, impairing PTH's ability to act on its target tissues (Rude, 1998) [19] . The significantly lower serum magnesium levels in JX cattle may therefore impair PTH signaling and calcium mobilization, increasing their susceptibility to milk fever. The hematological parameters of JX and HF cattle breeds were evaluated in this study, revealing significant differences in erythrocyte indices between the two breeds. The RBC count was slightly higher in JX cattle, but the difference was not statistically significant. However, a significant difference was observed in MCV, with JX cattle showing a lower value compared to HF cattle. This suggests that JX cattle may have smaller erythrocytes, which could be indicative of magnesium deficiency, as previously reported (Sanchez-Morito et al., 2014) [21] . Magnesium deficiency has been shown to lead to increased intestinal absorption of iron and decreased RBC counts, possibly due to increased fragility of erythrocytes (Sanchez-Morito et al., 2014) [21] . The lower MCV and hemoglobin levels observed in JX cattle in this study may be indicative of magnesium deficiency-induced alterations in erythrocyte structure and function. Additionally, magnesium deficiency has been shown to induce significant alterations in the erythrocyte membrane, including changes in fatty acid composition and fluidity (Lerma et al., 1995) [11] . The significant difference in hemoglobin levels between JX and HF cattle observed in this study may also be related to magnesium deficiency-induced changes in erythropoiesis.
Magnesium deficiency has been shown to lead to increased tissue accumulation of iron, which can activate the calciumbinding protein calmodulin, disrupting the cytoskeletal structure of erythrocytes (Planells et al., 1995) [11] . This study employed Erythrocyte Osmotic Fragility (EOF) as a measure of hypomagnesemia-induced oxidative stress, revealing that JX cattle exhibited higher EOF values compared to HF cattle. This indicates increased sensitivity of red blood cells to osmotic changes, suggesting that JX cattle may be more susceptible to oxidative stress due to magnesium deficiency. The use of EOF as a measure of oxidative stress is supported by previous studies, which have demonstrated that magnesium deficiency can lead to increased oxidative stress, lipid peroxidation, and protein modification (Beard et al., 1977) [2] . The erythrocyte's delicate membrane structure and crucial role in oxygen delivery make it particularly vulnerable to oxidative stress. EOF measures the sensitivity of red blood cells to osmotic changes, reflecting RBC volume, membrane integrity, and surface area (Islah et al., 2016) [8] . Recent studies have further validated the use of EOF as a measure of stress and physiological recovery. Reddy et al. (2022) [20] demonstrated that EOF could be a potential measure of stress and subsequent physiological recovery in tropical small ruminants. The higher EOF values observed in JX cattle suggest that magnesium deficiency may be compromising the integrity of the erythrocyte membrane, making it more susceptible to oxidative damage. This is consistent with previous studies, which have shown that magnesium deficiency can lead to changes in erythrocyte membrane structure and function (Lerma et al., 1995) [11] .
Conclusion
This study found that JX cattle are more susceptible to oxidative stress and cellular dysfunction due to magnesium deficiency. The erythrocyte fragility test can help identify individuals at risk, enabling implementation of preventive measures such as magnesium and antioxidant supplementation. This can improve the health and welfare of Jersey cross cattle, reduce disease incidence, and promote sustainable livestock production.
References
24 in the original paper- Asala OO, Ayo JO, Rekwot PI, Minka NS, Omoniwa DO, Adenkola AY. Effect of ascorbic acid administration on erythrocyte osmotic fragility of pigs transported by road during the hot-dry season. Veterinary Research Communications. 2011;35(4):245-254.
- Beard JL, Dawson HD. Iron. In: O'Dell BL, Sunde RA, editors. Handbook of Nutritionally Essential Mineral Elements. Marcel Dekker; Basel, Switzerland. 1997. p. 275-334.
- Chiwome B, Kandiwa E, Mushonga B, Sajeni S, Habarugira G. A study of the incidence of milk fever in Jersey and Holstein cows at a dairy farm in Beatrice, Zimbabwe. Journal of the South African Veterinary Association. 2017;88(1):1-6.
- DeGaris PJ, Lean IJ. Milk fever in dairy cows: A review of pathophysiology and control principles. Veterinary Journal. 2008;176:58-69.
- Dairy NZ. FarmFact 3-1: Magnesium Supplementation. 2009.
- Goff JP. Macromineral physiology and application to the feeding of the dairy cow for prevention of milk fever and other periparturient mineral disorders. Animal Feed Science and Technology. 2006;126(3-4):237-257.
- Hernandez CT. Dairy cows: Reproduction, nutritional management and diseases. Nova Science Publishers, Inc. 2013.
- Islah L, Rita B, Youssef C, Abdarrahmane B, Abdarrahman H, Mohammed EK. Study of incubation conditions for erythrocytes osmotic fragility testing in dromedary camel (Camelus dromedarius). International Journal of Research in Environmental Science. 2016;2:22-32.
- Krehbiel CR. Applied nutrition of ruminants: Fermentation and digestive physiology. Professional Animal Scientist. 2014;30:129.
- Lean IJ, DeGaris PJ, McNeil DM, Block E. Hypocalcemia in dairy cows: Meta-analysis and dietary cation anion difference theory revisited. Journal of Dairy Science. 2006;89:669-684.
- Lerma A, Planells E, Aranda P, Llopis J. Effect of magnesium deficiency on fatty acid composition of the erythrocyte membrane and plasma lipid concentration in rats. Journal of Nutrition and Biochemistry. 1995;6:577581.
- Martín-Tereso J, Martens H. Calcium and magnesium physiology and nutrition in relation to the prevention of milk fever and tetany (dietary management of macrominerals in preventing disease). Veterinary Clinics: Food Animal Practice. 2014;30(3):643-670.
- Mulligan F, O'Grady L, Rice D, Doherty M. A herd health approach to dairy cow nutrition and production diseases of the transition cow. Animal Reproduction Science. 2006;96:331-353.
- Mulligan F, Doherty M. Production diseases of the transition cow. Veterinary Journal. 2008;176:3-9.
- Pawlusky J, Jego P, Henry S, Bruchet A, Palme R, Coste C. Low plasma cortisol and fecal cortisol metabolite measures as indicators of compromised welfare in domestic horses (Equus caballus). PLoS One. 2017;12(9):e0182257.
- Planells E, Llopis J, Perán F, Aranda P. Changes in tissue calcium and phosphorus content and plasma concentrations of parathyroid hormone and calcitonin after long-term magnesium deficiency in rats. Journal of the American College of Nutrition. 1995;14(3):292-298.
- Prapong S, Reinhardt TA, Goff JP, Horst RL. Short communication: Ca2+-adenosine triphosphatase protein expression in the mammary gland of periparturient cows. Journal of Dairy Science. 2005;88:1741-1744.
- Roche J, Bell A, Overton T, Loor J. Nutritional management of the transition cow in the 21st century: A paradigm shift in thinking. Animal Production Science. 2013;53:1000-1023.
- Rude RK. Magnesium deficiency: A cause of heterogeneous disease in humans. Journal of Bone and Mineral Research. 1998;13(4):749-758.
- Reddy PR, Kumar BR, Prasad CS, Venkataseshiah C, Hyder I. Erythrocyte fragility based assessment of true thermal resilience in tropical small ruminants. Biological Rhythm Research. 2022;53(2):234-245.
- Sanchez JM, Saborío-Montero A. Hypocalcemia and hypomagnesemia in a herd of Holstein, Jersey, and Guernsey cows on pasture. Agronomía Costarricense. 2014;38:55-65.
- Sansom BF, Manston R, Vagg MJ. Magnesium and milk fever. Veterinary Record. 1983;112(19):447-449.
- Tritschler C, Reinhardt TA, Kraft W, Schwert B, Kölle P. Increased erythrocytic osmotic fragility in anemic domestic shorthair and purebred cats. Journal of Feline Medicine and Surgery. 2016;18(6):462-470.
- Vijayakumar P, Singaravadivelan A, Silambarasan P, Ramachandran M, Churchil R. Production and reproduction performances of crossbred Jersey cows. Veterinary Research International. 2019;7(2):56-59.
Cited by 1
From OpenAlex, OpenCitations and reference lists read by Scinovex
- Investigation of Negative Energy Balance and Biochemical Parameters in Dairy Cows with Hypomagnesemia Developing in the Fresh Period ↗
Cennet Nur Ünal, Mert Alperen İnce, Hakan Keçeci, Murat Uzti̇mür · Livestock Studies · 2025
Hypomagnesemia is a disease in ruminants characterized by biochemically low serum magnesium. Metabolic profile refers to the analysis of blood biochemical parameters used to assess and prevent metabolic and nutritional disorders in dairy farms. This study aims to evaluate the effect of magnesium on energy balance and metabolic profile parameters in fresh postpartum dairy cows. The study included 30 cows…
❝ 1PDF