
Research article · 2025 · Full text
International Journal of Biology SciencesVariations in physiochemical properties of soil under selected tropical trees in the university of Port Harcourt arboretum
Volume 7(3) · Pages 01–07 · DOI: 10.33545/26649926.2025.v7.i3a.308 ↗
Research areasAfrican Botany and Ecology Studies
Abstract
Author-writtenPlant and soil are major parts of terrestrial ecosystem, and variations in vegetation cover may alter the properties of soil, mostly the topsoil. Hence, this study investigated the influence of trees on soil physiochemical properties. The study was done in the forestry and wildlife arboretum of the University of Port Harcourt, Nigeria, and involved five tree species. Soil samples were gotten at two depths under the selected tree species, and their physiochemical properties were analyzed. Analysis of variance was performed on the data obtained, and the last significant difference at 5% was employed to separate the means. Results indicated that; sand particles ranged from 78%-81% at 0-15 cm depth, bulk density ranged from 1.29-1.70 gcm-3 at 0-15 cm depth and 1.59-1.75 gcm-3 at 15-30 cm depth, the maximum pH (5.6) was recorded under Gmelina arborea at 15-30 cm depth while the lowest pH (4.6) was recorded under Tectona grandis and Anona moricata at 15-30 cm depth respectively, the maximum total nitrogen (44.5 g/cmol) was recorded under Gmelina arborea and Irvingia gabonensis at 0-15 cm depth while its lowest value of 22.3 g/cmol was recorded under Anona moricata at 15-30cm depth, magnesium at 0-15 cm depth ranged from 2.15-3.30C mol kg-1 and 1.20-1.45C mol kg-1 at 15-30 cm depth, among others. It was concluded that selected tropical tree species in the Arboretum exerted some level of influence on soil physiochemical properties in the following decreasing order; Gmelina arborea > Nauclea dedirrichii > Tectona grandis > Irvingia gabonensis > Anona moricata.
Summary
Source-checkedPlain-language reading of the full paper, prepared with AI and checked against the text. Each point links to the authors' own words.
Why it matters
- Plants and soil are fundamental components of terrestrial ecosystems, where changes in vegetation cover can modify soil properties, particularly in the topsoil. View evidence ↗
- Trees play a critical role in soil formation and can influence soil through nutrient cycling, organic matter dynamics, acidity changes via root-soil exchange, and protection against erosion. View evidence ↗
- Agroforestry systems are considered essential for improving the movement of nutrients and the overall quality of the soil. View evidence ↗
The question
- The study aimed to investigate changes in soil physicochemical properties under selected tropical trees in the University of Port Harcourt arboretum to identify species that best improve soil for agricultural productivity. View evidence ↗
What they did
- The research was conducted between January and August 2024 at the University of Port Harcourt's forestry and wildlife arboretum in Nigeria. View evidence ↗
- Five tropical tree species were selected for the study: Gmelina arborea, Anona moricata, Nauclea diderrichii, Tectona grandis, and Irvingia gabonensis. View evidence ↗
- Soil samples were collected from the rhizosphere of the selected trees at two specific depths: 0-15 cm and 15-30 cm. View evidence ↗
- The study utilized a total of 20 disturbed and 20 undisturbed core soil samples for physical and chemical analysis. View evidence ↗
What they found
- Sand content was higher in the topsoil (78%-81% at 0-15 cm) compared to the subsoil, where it remained constant at 72% (15-30 cm). View evidence ↗
- Bulk density increased with depth, ranging from 1.29-1.70 g/cm³ at 0-15 cm to 1.59-1.75 g/cm³ at 15-30 cm. View evidence ↗
- Soil pH ranged from 4.6 to 5.6, indicating acidic conditions, with the highest value under Gmelina arborea and the lowest under Tectona grandis and Anona moricata at 15-30 cm depth. View evidence ↗
- Total nitrogen varied significantly, peaking at 44.5 g/cmol under Gmelina arborea and Irvingia gabonensis (0-15 cm) and reaching a minimum of 22.3 g/cmol under Anona moricata (15-30 cm). View evidence ↗
- Cation Exchange Capacity (CEC) was higher in the topsoil (8.74-11.40 C mol/kg) than in the subsoil (5.32-6.81 C mol/kg). View evidence ↗
- Aggregate stability, measured by Mean Weight Diameter (MWD), was significantly higher in the topsoil (0.75-1.67 mm) than in the subsoil (0.45-0.71 mm). View evidence ↗
What it means
- The authors concluded that the selected trees influenced soil properties in a decreasing order of effectiveness: Gmelina arborea, followed by Nauclea dedirrichii, Tectona grandis, Irvingia gabonensis, and Anona moricata. View evidence ↗
- The authors recommend that farmers adopt agroforestry systems because tree species provide more sustainable, long-term improvements to soil properties than annual crops. View evidence ↗
Visual summary
1 visualsIllustrations explain the paper; they do not show study data.
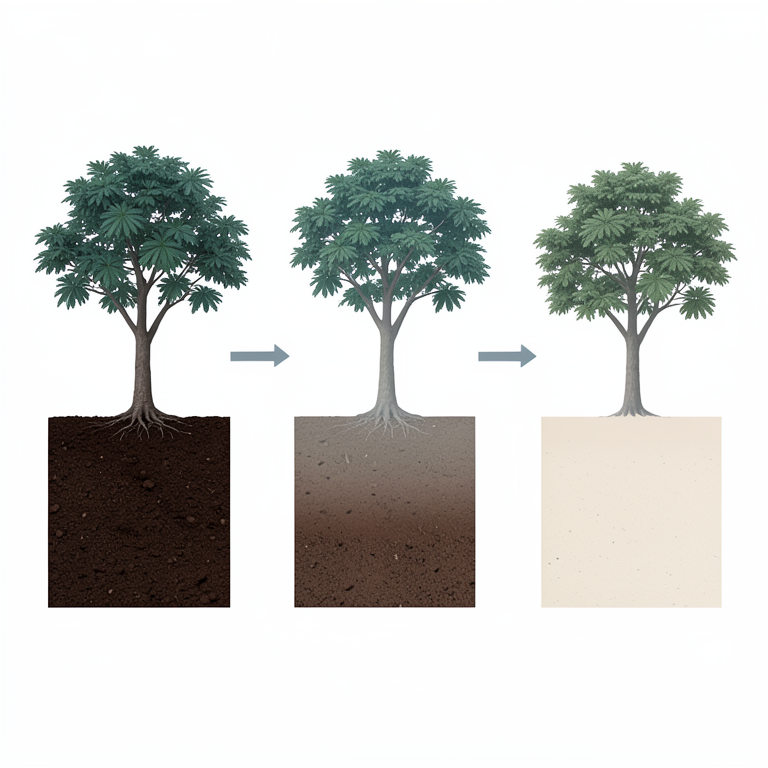
Tree Influence Hierarchy
AI-generated conceptual illustration (Tropical tree species (Gmelina arborea, Nauclea dedirrichii, Tectona grandis, Irvingia gabonensis, and Anona moricata)}). It explains the idea and does not show study data.
View source evidence ↗Figures & tables
From the original paper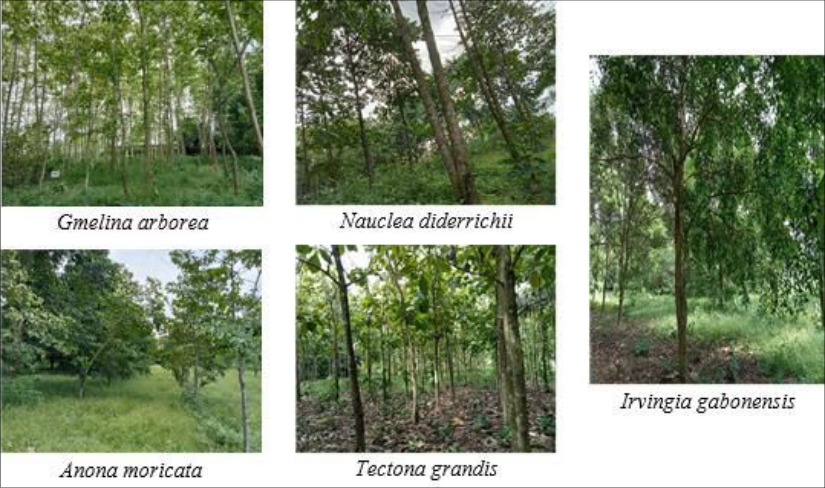 Plate 1
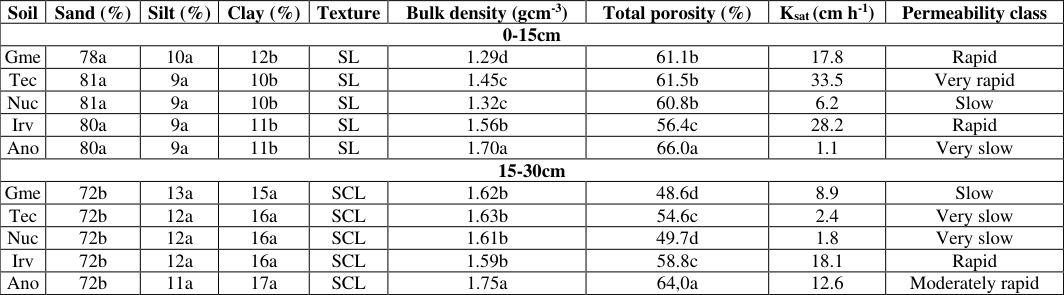 Table 1
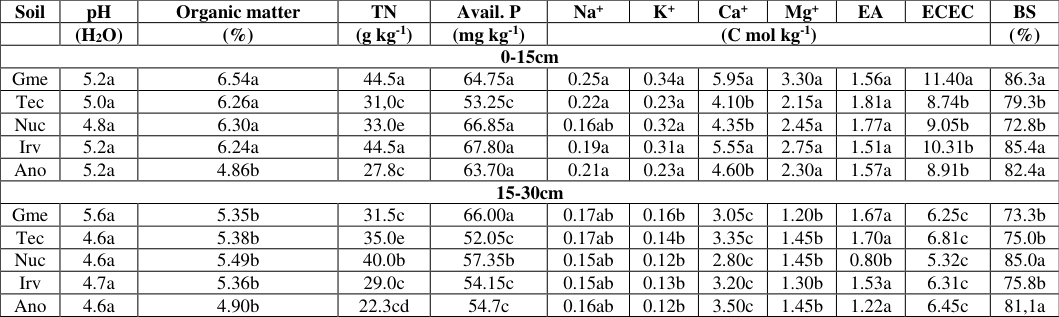 Table 2
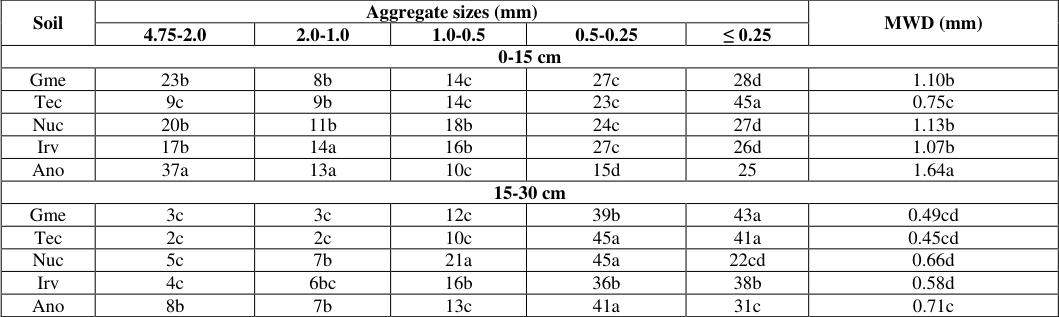 Table 3
Introduction
Soil is one important habitat that stores converted organic materials, primarily regenerated organic carbon (Salome et al., 2016; Vignozzi et al., 2018) [21,27] . In forest ecosystems, soil is crucial for fertility and stability (Baveye et al., 2016; Lucas-Borja et al., 2018) [1,13] , and it either directly or indirectly controls or affects numerous cellular processes (Zhang & Liu, 2018) [30] , physical (Bünemann et al., 2018) [3] and chemical processes (Qiao et al., 2019) [19] . It was also reported by Wood (2018) [29] that forests, as ecosystem engineers, not only have species-specific effects on soil physicochemical properties and soil communities, but they also occupy around 7% of the entire global soil ecosystem, but also regulate climates, mineral recycling and prevents soil erosion. Plant and soil are essential parts of terrestrial ecosystem, and variations in vegetation cover may alter soil properties, particularly in forest topsoil (Greiner et al., 2017; Zhang & Liu 2018) [10,30] . In turn, it is important to note that trees are vital in soil-formation, and tree species can influence soil in a number of ways, such as nutrient intake and return, soil organic matter dynamics, root-soil exchange that alters soil acidity, and erosion protection (Vignozzi et al., 2018) [27] . Trees according to Sjoerd et al. (2018) [22] contribute differently in quality and amount to soil, root architecture, and nutrient requirements, and the impact that each tree may have on soil quality and biodiversity primarily explains the differences between exotic, native, and agroforestry trees. Although Qiao et al. (2019) [19] posited that different trees exhibits species-specific effect on quality and quantity of soil, and may also alter biological, and physiochemical properties of soil. Thus, it can be argued that aboveground and below ground progressions of forest ecosystem control plant-soil feedback and influences the structure of the plant community and nutrient recycling. Soil biological and physiochemical properties as well as other associated processes can be exaggerated by trees, and hence, stimulate the nutrient stock of the soil to the trees (Lucas-Borja et al., 2018; Vogel et al., 2019) [13,28] . It is quite indicative that there is an inevitable relationship existing between plant tree species abundance and the physicochemical and nutrient properties of soil in many areas (Wood, 2018; Curtin et al., 2021) [29,6] . This is so because soil contains nutrients that are required by plants to grow, provides strong physical structure for anchorage and stability being in the soft sediments, and theaters an imperative fertility and stability function in forest ecosystem (Lucas-Borja et al., 2018) [13] . Agroforestry crop production systems are therefore crucial for enhancing soil quality and nutrient movement.
Studies (Ospina, 2017 [18,13,19] has shown the influence of trees on biological and physiochemical properties of soil in great altitude forest. However, no study has investigated the changes in soil physiochemical properties under selected tropical trees in the arboretum of the University of Port Harcourt. The current study seek to bridge this knowledge gap in the study area and also determine specific tree species that best improves soil physicochemical properties, in order to boast agricultural productivity.
Methodology Study Area
This study was carried out from January to August, 2024 at the arboretum/research and teaching farm of the forestry and wildlife department, faculty of agriculture, University of Port Harcourt, Nigeria. The experimental location has an average temperature of 27 °C, a relative humidity of 78%, and an average rainfall of 2500-4000 mm. It is situated between latitudes 400 31N and 50 00N and longitudes 6° 45''E and 70° E. Port Harcourt metropolis is located at the sub equatorial region of Nigeria, it experiences an average rainfall between 3,000mm to 4,500 mm yearly, with a bimodal seasonal pattern, (dry and wet). Port Harcourt represents soils of coastal plain sands (brown to dark brown), and these soils have been reported to range from sands to sandy loam in the top soil layer.
Selected Tree Species
The selected tree species for this study (plate 1) are Gmelina arborea (Gmelina or Ghamher), Anona moricata (Graviola or Soursop or Guyabano), Nauclea diderrichii (African Peach or Opepe), Tectona grandis (Teak), and Irvingia gabonensis (Ogbono or bush mango).
Plate 1: Selected Tree Species
Soil Samples Collection
Samples of soil were taken at two depths (0-15 cm and 15-30 cm) using soil auger and core samplers from the rhizosphere of selected tropical tree species respectively. Disturbed samples were collected using soil auger, at three randomly selected points, not more than 4mm apart from the trees (rhizosphere). Systematic method of random sampling was applied in course of sample collection. Samples collected at each depths were bulked and carefully placed in a well labeled fresh polythene bags. Core samplers were utilized in the collection of undisturbed soil sample from the mapped out areas for physical analysis in the laboratory. A total of 20 disturbed and 20 undisturbed core samples were collected for chemical and physical analysis.
Soil Physical Parameters
Samples of soil were allowed to air dry at ambient temperature, and sieved through a 2 mm and 4.75 mm sieve.
Determination of soil Texture
Samples of disturbed soil were allowed to air dry before being passed through 2mm sieve to separate gravel from fine earth. 50g of soil was used to determine particle size distribution by the hydrometer method (Gee & Bauder, 1986) [8] .
Bulk Density: Bulk density was computed with core samples by the method of Grossman & Reinsch (2002) [11] using the formulae:
Bulk density = Mass of oven-dried soil (g)
Volume of bulk soil (Cm 3 )
Total Porosity
Using core samples, total porosity was computed using the core method described by Flint & Flint (2002) [7] as:
Total porosity = Volume of water at saturation (Cm 3 ) Volume of bulk soil (Cm 3 ) Saturated Hydraulic Conductivity (Ksat) Saturated hydraulic conductivity (Ksat) was computed using the constant head core technique described by Reynolds et al. (2002) [20] . After the volume of water pouring out was observed over time until the flow was constant, the flow rate was calculated using the equation:
Where, A is the cross-sectional area of the core (cm 2 ), T is the time (h), L is the length of the core (cm), Q is the amount of water collected (cm 3 ), and ∆H is the hydraulic head difference (cm).
Aggregate Stability
Using the wet-sieving method, the mean weight diameter (MWD) of water-stable aggregates was used to quantify aggregate stability. This technique involved placing 50g of 4.75mm dry-sieved aggregates in the uppermost of a nest of 2.0, 1.0, 0.5, and 0.25mm sieves. A mechanical agitator was used to vibrate the aggregates vertically in water 20 times with a 4 cm amplitude after they had been pre-soaked by capillary in distilled water for 15 minutes. Each sieve's residual stable aggregates were weighed after being ovendried for 24 hours at 50°C. Water stable aggregates (WSA) are represented by the percentage of stable aggregates on each sieve, which is determined as:
Where, MT total mass of wet-sieved soil (g) and MR mass of resistant aggregates (g). The formulae were used to determine the stable aggregates' mean weight diameter (MWD) as follow:
Where, wi is the weight of aggregates in that size range as a percentage of the dry weight of the sample analysed, and xi is the mean diameter of each size fraction.
Water Holding Capacity
Water holding capacity was calculated with the Volume of water at saturation using the formula:
Where, W.H.C is the water holding capacity, M d is the mass of oven-dried soil and M W the mass of wet soil.
Soil Chemical Parameters Soil pH
A glass electrode in a 1:2:5 soil/water aqueous solution was used to measure the pH of the soil samples (Mclean, 1982) [14] .
Total Organic Carbon
Organic carbon was computed using the Wet oxidation dichromate method with H 2 SO 4 -K 2 Cr 2 O 7 followed by residual titration with 1N HCl (Nelson & Sommer, 1996) [16] .
Total Organic Matter (TOM)
The Total Organic Carbon (TOC) was changed to Total Organic Matter (TOM) by multiplying the TOC values by the Van Bemelen factor of 1.724 (Van der Ploeg et al., 1999) [26] .
Total Nitrogen
The total nitrogen was computed using the macro-Kjelhahl digestion procedure as reported by Bremer & Mulvancy (1982) [2] .
Available Phosphorus
Available Phosphorus was computed using the Bray 11 soil extract procedure as reported by McLean (1982) [14] .
Exchangeable Cation (Ca, Mg, Na and K) Mg and exchangeable CA were calculated using the EDTA Complex onietric titration method and Exchangeable Na and K was determined by flame photometry.
Cation Exchange Capacity
Cation Exchange Capacity (CEC) was determined by the ammonium acetate displacement method.
Statistical Analysis
Data generated from the study was used for analysis of variance, and the last significant difference at 5% was used to separate the means.
Results
Results
Soil Physical Properties
Results of the physical properties (Bulk density, particle size, total porosity, hydraulic conductivity, and aggregate stability) of the tested soil under selected tropical tree species in the arboretum at 2 depths (0-15 cm and 15-30 cm) are presented on Table 1. The selected tropical trees had significant effect on the physical properties of the soil, and the effect of selected tropical tree species on the particle size distribution of the soil at two depths were statistically different (p≤0.05). Sand particles ranged from 78%-81% at 0-15 cm depth, and had a constant value of 72% at 15-30 cm depth respectively. Silt particles ranged from 9-10% and 11-13%, at 0-15cm and 15-30cm respectively, while clay particle ranged from 10-12% and 15-17%, at 0-15 cm and 15-30 cm depths respectively (Table 1). Percentage sand content was not significantly different at the two depths, but sand content at 0-15cm depth was statistically different (p≤0.05) and higher than sand content at 15-30 cm depth. Similarly, percentage silt content at 0-15 cm and 15-30 cm depth were not significantly different, but silt at 15-30 cm depth was significantly higher than silt at 0-15 cm depth. It was also observed from the result that the Clay content at both depths were not significantly different but the highest clay value of 17% was observed at depth 15-30 cm for Anona moricata, and its lowest value of 10% at depth 0-15 cm for Tectona grandis and Nauclea dedirichii.
| Soil | Sand (%) | Silt (%) | Clay (%) | Texture | Bulk density (gcm-3) | Total porosity (%) | Ksat (cm h-1) | Permeability class |
|---|---|---|---|---|---|---|---|---|
| 0-15cm | ||||||||
| Gme | 78a | 10a | 12b | SL | 1.29d | 61.1b | 17.8 | Rapid |
| Tec | 81a | 9a | 10b | SL | 1.45c | 61.5b | 33.5 | Very rapid |
| Nuc | 81a | 9a | 10b | SL | 1.32c | 60.8b | 6.2 | Slow |
| Irv | 80a | 9a | 11b | SL | 1.56b | 56.4c | 28.2 | Rapid |
| Ano | 80a | 9a | 11b | SL | 1.70a | 66.0a | 1.1 | Very slow |
| 15-30cm | ||||||||
| Gme | 72b | 13a | 15a | SCL | 1.62b | 48.6d | 8.9 | Slow |
| Tec | 72b | 12a | 16a | SCL | 1.63b | 54.6c | 2.4 | Very slow |
| Nuc | 72b | 12a | 16a | SCL | 1.61b | 49.7d | 1.8 | Very slow |
| Irv | 72b | 12a | 16a | SCL | 1.59b | 58.8c | 18.1 | Rapid |
| Ano | 72b | 11a | 17a | SCL | 1.75a | 64,0a | 12.6 | Moderately rapid |
Table text extracted from the original PDF; superscript letters are shown inline. The original table image is below.
View original table image
The soils at 0-15 cm depth were predominantly sandy loam while soils at the 15-30 cm depth were sandy-clay loam (Table 1). Bulk density had a range of 1.29-1.70 gcm -3 at 0-15 cm depth and 1.59-1.75 gcm -3 at 15-30 cm depth. It was significantly different at both depths, though the maximum bulk density (1.75g/cm³) was observed at depth 15-30cm for Anona moricata, while the minimum bulk density (1.29 gcm -3 ) was observed at 0-15 cm depth for Gmelina arborea (Table 1 Generally, Total porosity values were higher at 0-15 cm depth than at 15-30 cm depth (Table 1). Saturated hydraulic conductivity had a range of 1.1-33.5 cm h -1 at 0-15 cm depth and 1.8-18.1 cm h -1 at 15-30cm depth. Generally, the permeability class of saturated hydraulic conductivity test at 0-15 cm depth ranged from very slow, slow, rapid to very rapid while it ranged from very slow, slow, rapid to moderately rapid at depth 15-30 cm depth. It was generally observed that the permeability class at 0-15 cm depth was generally faster than at 15-30 cm depth (Table 1). Moderately rapid At p≤0.05, there was no significant difference between the means of the identical letters in the column and depth. Key: Gme-Gmelina arborea, Tec-Tectona grandis, Nuc-Nauclea dedirrichii, Irv-Irvingia gabonensis, Ano-Anona moricata, Ksat-Saturated hydraulic conductivity, SL-Sandy loam, SCL-Sandy clay loam.
Soil Chemical Properties
Results of the tested soil chemical properties: (pH, organic matter, total nitrogen, available phosphorus, sodium, potassium, calcium, magnesium, exchangeable acidity, effective cation exchangeable acidity and base saturation) under the selected tropical tree species in the arboretum are presented in Table 2. pH values ranged from 4.6-5.6 at 0-15cm and 15-30cm depth and were not significantly different p≤0.05. The highest pH value of 5.6 was observed under Gmelina arborea at 15-30cm depth while the lowest pH value of 4.6 was observed under Tectona grandis and Anona moricata at 15-30cm depth respectively, indicating that the soils under the selected tropical trees are acidic (Table 2). Organic matter content at 0-15 cm depth ranged from 4.86%-6.54% and 4.90%-5.49% at 15-30 cm depth respectively. Organic matter at 0-15cm depth was not significantly different, although it was significantly higher than organic matter at 15-30cm depth (Table 2). Total nitrogen ranged from 27.8-44.5 g kg -1 at 0-15 cm depth and 22.3-40.0 g kg -1 at 15-30 cm depth. The total nitrogen at both depths were significantly different with the highest total nitrogen value of 44.5 g/cmol recorded under Gmelina arborea and Irvingia gabonensis at 0-15cm depth while its lowest value of 22.3 g/cmol was recorded under Anona moricata at 15-30cm depth (Table 2). Available phosphorus ranged from 53.25-67.80 mg kg -1 at 0-15 cm depth and 52.05-66.00 mg kg -1 at 15-30cm depth having its highest significant value of 67.80 g/cmol under Irvingia gabonensis at 0-15 cm depth, and the lowest statistical value of 52.05 g/cmol under Tectona grandis at depth 15-30cm (Table 2). Sodium at 0-15 cm depth had a range of 0.16-0.25 C mol kg - 1 while those at 15-30cm depth ranged from 0.15-0.17 C mol kg -1 . Its values under the selected topical trees were not significantly different (p≤0.05) at 0-15cm depth, except under Nauclea dedirrichii (0.16 C mol kg -1 ) which was observed to be lower. Generally, sodium at 0-15cm depth were significantly higher than sodium at depth 15-30cm depth. Similarly, potassium values at 0-15 cm depth ranged from 0.23-0.34 C mol kg -1 and 0.12-0.16 C mol kg -1 at 15-30cm depth, and potassium at 0-15 cm depth was significantly higher than those at 15-30cm depth (Table 2).
| Soil | pH | Organic matter | TN | Avail. P | Na+ | K+ | Ca+ | Mg+ | EA | ECEC | BS |
|---|---|---|---|---|---|---|---|---|---|---|---|
| (H2O) | (%) | (g kg-1) | (mg kg-1) | (C mol kg-1) | (%) | ||||||
| 0-15cm | |||||||||||
| Gme | 5.2a | 6.54a | 44.5a | 64.75a | 0.25a | 0.34a | 5.95a | 3.30a | 1.56a | 11.40a | 86.3a |
| Tec | 5.0a | 6.26a | 31,0c | 53.25c | 0.22a | 0.23a | 4.10b | 2.15a | 1.81a | 8.74b | 79.3b |
| Nuc | 4.8a | 6.30a | 33.0e | 66.85a | 0.16ab | 0.32a | 4.35b | 2.45a | 1.77a | 9.05b | 72.8b |
| Irv | 5.2a | 6.24a | 44.5a | 67.80a | 0.19a | 0.31a | 5.55a | 2.75a | 1.51a | 10.31b | 85.4a |
| Ano | 5.2a | 4.86b | 27.8c | 63.70a | 0.21a | 0.23a | 4.60b | 2.30a | 1.57a | 8.91b | 82.4a |
| 15-30cm | |||||||||||
| Gme | 5.6a | 5.35b | 31.5c | 66.00a | 0.17ab | 0.16b | 3.05c | 1.20b | 1.67a | 6.25c | 73.3b |
| Tec | 4.6a | 5.38b | 35.0e | 52.05c | 0.17ab | 0.14b | 3.35c | 1.45b | 1.70a | 6.81c | 75.0b |
| Nuc | 4.6a | 5.49b | 40.0b | 57.35b | 0.15ab | 0.12b | 2.80c | 1.45b | 0.80b | 5.32c | 85.0a |
| Irv | 4.7a | 5.36b | 29.0c | 54.15c | 0.15ab | 0.13b | 3.20c | 1.30b | 1.53a | 6.31c | 75.8b |
| Ano | 4.6a | 4.90b | 22.3cd | 54.7c | 0.16ab | 0.12b | 3.50c | 1.45b | 1.22a | 6.45c | 81,1a |
Table text extracted from the original PDF; superscript letters are shown inline. The original table image is below.
View original table image
Values of calcium at 0-15cm depth ranged from 4.10-5.95 C mol kg -1 , and were significantly different and stated as follows; 5.95 C mol kg -1 under Gmelina arborea, 4.10 C mol kg -1 under Tectona grandis, 4.35 C mol kg -1 under Nauclea dedirichii, 5.55 C mol kg -1 under Irvingia gabonensis, and 4.60 C mol kg -1 under Anona moricata. Calcium at 15-30 cm depth ranged from 2.80-3.50 C mol kg - 1 , and were not significantly different, although calcium values at depth 0-15 cm were significantly higher than values at 15-30 cm depth (Table 2). Magnesium at 0-15 cm depth ranged from 2.15-3.30 C mol kg -1 and 1.20-1.45 C mol kg -1 at 15-30cm depth. Magnesium at 0-15cm depth were significantly higher than Magnesium at depth 15-30 cm. Exchangeable acidity at 0-15 cm depth ranged from 1.51-1.81C mol kg -1 and 0.80-1.70 C mol kg -1 at 15-30 cm depth, and where not significantly different at both depths. Exchangeable Cation Exchange Capacity ranged from 8.74-11.40 C mol kg -1 and 5.32-6.81C mol kg -1 at 0-15 cm and 15-30 cm depth respectively. The highest ECEC value of 11.40 C mol kg -1 was observed under Gmelina arborea at 0-15 cm depth while the lowest value of 5.32 C mol kg -1 was observed under Nauclea dedirrichii at 15-30 cm depth. Percentage Base Saturation ranged from 72.8-86.3 at depth 0-15 cm, and 73.3-85.0 at depth 15-30cm. with the highest BS of 86.3 observed under Gmelina arborea at 0-15 cm depth while its lowest value of 72.8% at the same depth (Table 2).
Water stable aggregates and aggregate stability of the soil as influenced by the forest tree species
Results on Water stable aggregate and aggregate stability at sizes (4.75-2.0, 2.0-1.0, 1.0-0.5, 0.5-0.25, and ≤ 0.25 mm), is shown in Table 3. Aggregate size 4.75-2.0 ranged from 9-37mm and 2-8mm at 0-15cm and 15-30 cm depth respectively. Aggregate size 4.75-2.0 at 0-15 cm depth was significantly higher than those at 15-30cm depth. Aggregate size 2.0-1.0 ranged from 8-14mm and 2-7mm at 0-15cm and 15-30 cm depth respectively. Aggregate size 1.0-0.5 at 0-15 cm depth ranged from 10-18 mm while those at 15-30cm depth ranged from 10-21mm. aggregate size at both depths were significantly different (p≤0.05). Aggregate size 0.5-0.25 ranged from 15-27mm at 0-15 cm depth, while at 15-30 cm depth, it ranged from 36-45mm. although Aggregate size at 15-30 cm depth was significantly higher than those at 15-30 cm depth (Table 3). The aggregate size ≤ 0.25 ranged from 25-45 mm at 0-15 cm depth while those at 15-30cm depth ranged from 22-43 mm. The highest Aggregate of 45 mm was observed under Tectona grandis at 0-15 cm depth, while the lowest aggregate of 25mm was observed under Anona moricata at the same depth. Mean Weight Diameter at 0-15 cn depth ranged from 0.75-1.67 mm and 0.45-0.71 mm at 15-30 cm depth. MWD at both depths were significantly different (p≤0.05) [Table 3]. 0.71c At p≤0.05, there was no significant difference between the means of the identical letters in the column. Key: Gme-Gmelina arborea, Tec-Tectona grandis, Nuc-Nauclea dedirrichii, Irv-Irvingia gabonensis, Ano-Anona moricata, MWD-mean weight diameter.
| Soil | Aggregate sizes (mm) | — | — | — | — | MWD (mm) |
|---|---|---|---|---|---|---|
| 4.75-2.0 | 2.0-1.0 | 1.0-0.5 | 0.5-0.25 | ≤ 0.25 | ||
| 0-15 cm | ||||||
| Gme | 23b | 8b | 14c | 27c | 28d | 1.10b |
| Tec | 9c | 9b | 14c | 23c | 45a | 0.75c |
| Nuc | 20b | 11b | 18b | 24c | 27d | 1.13b |
| Irv | 17b | 14a | 16b | 27c | 26d | 1.07b |
| Ano | 37a | 13a | 10c | 15d | 25 | 1.64a |
| 15-30 cm | ||||||
| Gme | 3c | 3c | 12c | 39b | 43a | 0.49cd |
| Tec | 2c | 2c | 10c | 45a | 41a | 0.45cd |
| Nuc | 5c | 7b | 21a | 45a | 22cd | 0.66d |
| Irv | 4c | 6bc | 16b | 36b | 38b | 0.58d |
| Ano | 8b | 7b | 13c | 41a | 31c | 0.71c |
Table text extracted from the original PDF; superscript letters are shown inline. The original table image is below.
View original table image
Discussion
The particle size distribution (Table 1) shows no statistical difference in the textural class of the soil under selected tropical tree species at 0-15 cm depth and also at 15-30cm depth. Generally, all samples from the selected tropical tree species at both depths were dominated by high sand fractions followed by clay and finally silt. This could be that the formation of sandy soils in the studied area may have resulted from the weathering of parent materials that are rich in quartz, such as granite and sandstone (Bünemann et al., 2018) [3] . The soil at 0-15cm depth were generally Sandy loam, while soil at 15-30cm depth were sandy clay loam (Table 1). This result is in consistent with those of Orji & Ikechi (2018) [17] who showed high sand content of 84% in planted forest soil. The experimental result clearly revealed that bulk density varied with depth and tree species abundance (Table 1). It was also observed from the result in Table 1 that an increase in the organic matter content of the soil, led to a corresponding increase in the bulk density and vice versa. This could be as a result of increased plant litters and deposit on the soil surface, which may have led to increase organic matter thereby reducing bulk density. This view is in synchrony with the earlier results of Buraka et al. (2016) [4] , who posited that higher organic matter in the topsoil makes the soil loose, porous and well aggregated, thereby reducing bulk density. Reduction in bulk density from the result agrees with those of Qiao et al. (2019) [19] . Also, Sjoerd et al. (2018) [22] , reported that bulk density was lowest in plantation soil because of enhanced organic matter. Lower bulk density increases infiltration, percolation, aeration, and is also shown to promote tree growth. Total porosity was significantly different under the selected tropical tree species. Each specie had specific effect on the total porosity. The increased total porosity observed from the result (Table 1) may be due to the tree rooting system, or the leave size and canopy. This result is in consonant with those of Udom & Kamalu (2016) and Udom & Benwari (2019) [24] who postulated that fine particle fractions in the soil is responsible for high total porosity. Saturated hydraulic conductivity (Ksat) had different permeable classes in relation to selected tropical tree, although they were generally higher at topsoil than at subsoil (Table 1). The high value of hydraulic test observed could be attributed to the fact that compared to soils under other plant types, forest soils are linked to higher rates of water infiltration and reduced creation of surface runoff (Chandra et al., 2016) [5] . Accordingly, the Millennium Ecosystem Assessment has determined that trees are essential for providing the ecosystem services of water purification and regulating water. The difference in permeability class could be related to difference in canopy and litter on the soil surface as Udom & Adesodum (2016) posited that topsoil has good structure and macro pores than subsoil. The acidic nature of the soil (pH range: 4.6-5.6) under all selected tropical tree species at two depths (Table 4.2) may be related to the great extent of leaching of bases from the surface soil as a result of heavy downpour of rain in the area. Lang et al. (2020) [28] claimed that soil pH can somewhat change the amount of nutrients in the soil, which in turn shapes the diversity or composition of the flora. The relative acidity observed in this study (Table 2), could be as a result of decomposition of plant residue or organic waste into organic acids. Arguably, the top soil showed acidity nature which may also be due to formation of organic acid from the higher amount of partially decomposed organic matter on the forest floor. The result is similar to the findings of Grace et al. (2019) [9] who reported a pH less than 5.5 in tropical forest. The organic matter content of the soils was not significantly different at the topsoil, but it was significantly different from those at the subsoil (Table 2). This is so because divergence in soil characteristics might affect the soil microbial community because forests with diverse tree species have varied litter quality and root exudates (Chandra et al., 2016) [5] . Though organic matter at 0-15cm depth were significantly higher than those at the 15-30cm depth. This could be as a result of accumulation of plant materials and litters at the topsoil leading to concentration of microorganisms at the topsoil. Udom & Benwari (2019) [24] reported that that increase in soil organic matter, increases the capacity of soil to buffer pH. Total Nitrogen levels were significantly different under selected tropical tree species and also at various depth. The total Nitrogen were generally high under the selected tree species (Table 2). This could be due to the fact that tropical forests show preference for NH 4+ (Min et al. 2017). Also, all selected tropical tree species showed high value for TN which indicates high intake rate of these inorganic forms of N (NH 4+ and NO 3-) and organic form (glycin) from the soil. Previous studies reported higher percent total nitrogen values (0.18-0.70%) under Gmelina arborea plantation than the values obtained in this research (Grace et al. 2019) [9] . Available phosphorus were significantly different under the different tree species, ranging from 53.25-67.80 mg kg -1 at 0-15 cm and 52.05-66.00 mg kg -1 at 15-30 cm. Available phosphorus value were high under the tree species (Table 2). This could result from phosphorus being readily available in inorganic forms, or it could be due to increased tree species diversity, annual litter input and soil organic carbon (Chandra et al. 2016) [5] . This could also be as a result of weathering of parent material, and contradicts the findings of Grace et al. (2019) [9] that showed that available phosphorus range of 0-4.57 mg kg -1 . Arguably, available phosphorus tend to decrease with increasing depth. Exchangeable cations decreased with increasing depth, and were not significantly different at each depth (0-15 cm and 15-30 cm) [Table 2]. This result align with those of Bünemann et al. (2018) [3] who posited that the concentration of exchangeable acids and bases in the soil affects its pH, which decreases when Al + + H + increases and Ca, Mg, and K decreases.
Conclusion
Agroforestry systems integrate trees with agricultural crops, and have the potential to enhance soil fertility, maintain the soil organic matter status, promote efficient nutrient cycling, reduce erosion, improve water quality, enhance biodiversity, increase an esthetics, and over the long-term are also sustainable and appropriate for soil fertility conservation and improve soil health, and sequester carbon. This study showed that selected tropical tree species in the Arboretum exerted some level of effects on soil physical and chemical properties in the following decreasing order; Gmelina arborea > Nauclea dedirrichii > Tectona grandis > Irvingia gabonensis > Anona moricata. These effects helps to define the quality of soil within the study area, highlighting that the soil will be good for agricultural practices hence increase productivity and effective land management. There is the need for farmers and agriculturist to inculcate agroforestry system of agriculture, because trees species have long term effects on soil physicochemical properties compared to other annual crops.
Figures and tables from the paper
References
29 in the original paper- Baveye PC, Ebaveye J, Egowdy J. Soil ecosystem services and natural capital, critical appraisal of International Journal of Biology Sciences https://www.biologyjournal.net research on uncertain ground. Front Environ Sci. 2016;4:41.
- Bremer JM, Mulvaney CS. Total nitrogen. In: Page AL, editor. Methods of Soil Analysis, Part 2: Chemical and Microbial Properties. Agron Monograph. 1982;9:595624.
- Bünemann EK, Bongiorno G, Bai Z, Creamer RE, Deyn DG, Goede DR, et al. Soil quality -a critical review. Soil Biol Biochem. 2018;120:105-125.
- Buraka T, Lelago A. Physico-chemical properties and agricultural potentials of soils of Tembaro Woreda, Kembata Tambaro zone, southern Ethiopia. Chem Mater Res. 2016, 8(7).
- Chandra LR, Gupta S, Pande V, Singh N. Impact of forest vegetation on soil characteristics: a correlation between soil biological and physic-chemical properties. Biotech. 2016;6:188.
- Curtin D, Beare MH, Qiu W. Distinguishing functional pools of soil organic matter based on solubility in hot water. Soil Res. 2021;59:319.
- Flint LE, Flint AL. Pore-size distribution. In: Dane JH, Topp GC, editors. Methods of Soil Analysis, Part 1: Physical Methods. Soil Sci Soc Amer, Madison, WI, USA, p. 246-53, 2002.
- Grace D, Bemgba A, Amonum JI. Changes in chemical properties as influenced by teak, Tectona grandis plantation on a tropical soil in Akwanga Forest Reserve of Nasarawa State, Nigeria. Int J Agric Environ Biores. 2019;4(05):16-17.
- Greiner L, Keller A, Regamey GA, Papritz A. Soil function assessment: Review of methods for quantifying the contributions of soils to ecosystem services. Land Use Policy. 2017;69:224-237.
- Grossman RB, Reinsch TG. Bulk density and linear extensibility. In: Dane JH, Topp CC, editors. Methods of Soil Science Analysis, Part 4: Physical Methods. ASA and SSSA, Madison, WI, USA, 2002, p. 201-28.
- Pan LL, Liu B, Guo T, Hou X. Vegetation characteristics and response to the soil properties of three medicinal plant communities in Altay Prefecture, China. Sustainability. 2020;12(24):10306.
- Borja LME, Santiago DJH, Yang Y, Shen Y, Pérez CD. Nutrient, metal contents and microbiological properties of litter and soil along a tree age gradient in Mediterranean forest ecosystems. Sci Total Environ. 2018;650:749.
- McLean EO. Soil pH and lime requirements. In: Page AL, Miller RH, Keeney DR, editors. Methods of Soil Analysis, Part 2, 2 nd Ed. Madison, Wisconsin, USA, 1982, p. 1159.
- Min L, Changcheng L, Xingliang X, Wolfgang W, Ning J, Huimin W, et al. Organic and inorganic nitrogen uptake by 21 dominant tree species in temperate and tropical forest. Tree Physiol. 2017;37:1515-26
- Nelson DW, Sommers LC. Total carbon, organic carbon and organic matter. In: Sparks DL, editor. Methods of Soil Analysis. Part 3. Chemical Methods. ASA, SSSA, Madison, WI, 1996, p. 539-579.
- Orji AO, Ikechi SN. Moisture characteristics as affected by land use in a typical ultisols in a humid tropical environment. J Environ Sci Toxicol Food Technol. 2018;12(10):20-26.
- Ospina C. Climate and economic benefits of agroforestry systems. Climate Institute, Washington DC, New York, 2017.
- Qiao LL, Li YZ, Song YH, Zhai JY, Wu Y, Chen WJ, et al. Effects of vegetation restoration on the distribution of nutrients, glomalin-related soil protein, and enzyme activity in soil aggregates on the Loess Plateau, China. Forests. 2019;10(9):796.
- Reynolds WD, Elick DE, Youngs EG, Amoozegar A, Bootink NW. Saturated and field-saturated water flow parameters. In: Dane JH, Topp GC, editors. Methods of Soil Analysis, Part 4. SSSA, Madison, WI, USA, 2002, p. 797-878.
- Salome C, Coll P, Lardo E, Metay A, Villenave C, Marsden C, et al. The soil quality concept as a framework to assess management practices in vulnerable agroecosystems: A case study in Mediterranean vineyards. Ecol Indic. 2016;61:456-65.
- Sjoerd P, Acosta LJC, Díaz GJA, Rangel LM. Floristic diversity and cultural importance in agroforestry systems on small-scale farmer's livelihoods in Central Veracruz, México. Sustainability. 2018;10:279.
- Udom BE, Adesodum KA. Soil penetrating quality in cultivated and forested coastal plain sand of southern Nigeria. Arch Soil Agro Soil Sci. 2016;62(7):963-971.
- Udom BE, Benwari A. Soil structure, organic matter and microbial diversity in soil under some tropical cover crops. Asian J Bio Sci. 2019;12(4):742-749.
- Udom BE, Kamalu OJ. Sealing index, air-filled porosity and hydrological behavior of a tropical ultisols as affected by incidental flooding and soil disturbance. Int. J Soil Sci. 2016;11(3):79-86.
- Van Der Ploeg RR, Bohm W, Kirkham MB. On the origin of the theory of mineral nutrition and the law of minimum. Soil Sci Soc Am J. 1999;66:1055-1062.
- Vignozzi N, Agnelli AE, Brandi G, Gagnarli E, Goggioli D, Lagomarsino A, et al. Soil ecosystem functions in a high-density olive orchard managed by different soil conservation practices. Appl Soil Ecol. 2018;134:64-76.
- Vogel H-J, Eberhardt E, Franko U, Lang B, Ließ M, Weller U, et al. Quantitative evaluation of soil functions: potential and state. Front Environ Sci. 2019;7:164.
- Wood J. Earth has more trees than it did 35 years agobut there is a huge catch. World Economic Forum, 2018. Available from: https://www.weforum.org
- Zhang GS, Liu YF. The distribution of micro plastics in soil aggregate fractions in south-western China. Sci Total Environ. 2018;642:12-20.