
Research article · 2025 · Full text
International Journal of Advanced Chemistry ResearchAnalytical method development, validation and forced degradation study of timolol maleate and brinzolamide in ophthalmic suspension
Volume 7(2) · Pages 22–39 · DOI: 10.33545/26646781.2025.v7.i2a.262 ↗
Research areasAnalytical Chemistry and SensorsAnalytical Methods in PharmaceuticalsPesticide Residue Analysis and Safety
Abstract
Author-writtenIn the present work, a stability-indicating reverse phase HPLC (RP-HPLC) technique using an AD HOC Prudent C18 (125 mm x 4.6 mm; 5µ) P/N:P18-12540-5 column was developed and subsequently validated for the detection of Timolol Maleate and Brinzolamide simultaneously. ICH guidelines were followed for the method's validation. All system suitability parameters were determined to be within the intended ranges. This method was found to be specific, precise, linear, accurate and robust. Forced degradation studies were carried out under various circumstances. The drug molecules were not impacted during stress application in thermal and acidic conditions. This method will be beneficial for qualitative as well quantitative determination of Timolol and Brinzolamide used in combination in process and final formulation.
Summary
Source-checkedPlain-language reading of the full paper, prepared with AI and checked against the text. Each point links to the authors' own words.
Why it matters
- Timolol maleate is used as a nonselective beta-adrenergic antagonist to treat conditions such as glaucoma, heart attack, and hypertension. View evidence ↗
- Brinzolamide acts as a carbonic anhydrase II inhibitor and is used in eye drops to reduce ocular hypertension. View evidence ↗
- Using Timolol and Brinzolamide in combination is more effective at lowering intraocular pressure for glaucoma treatment than using them separately. View evidence ↗
The question
- The study aims to address the lack of a rapid and reliable analytical method for identifying and quantifying Timolol and Brinzolamide in combination eye preparations. View evidence ↗
What they did
- The researchers developed and validated a stability-indicating reverse phase HPLC (RP-HPLC) method using an AD HOC Prudent C18 column for simultaneous detection of both drugs. View evidence ↗
- The optimized mobile phase consisted of an acetate buffer (pH 4.25) and acetonitrile in a 70:30 v/v ratio, with a flow rate of 1.0 mL/min. View evidence ↗
- A detection wavelength of 274 nm was selected because it provided optimum absorbance for both Timolol and Brinzolamide. View evidence ↗
- The validation of the analytical method was conducted following ICH guidelines. View evidence ↗
What they found
- The method achieved retention times of 1.7 minutes for Timolol and 2.5 minutes for Brinzolamide. View evidence ↗
- The method demonstrated strong linearity with correlation coefficients (R2) of 0.9996 for Timolol and 0.9993 for Brinzolamide. View evidence ↗
- The accuracy of the method was confirmed by an overall recovery range of 98% to 102% across all tested levels. View evidence ↗
- System suitability was met with tailing factors of 1.25 for Timolol and 1.08 for Brinzolamide, both below the 2.0 limit. View evidence ↗
- Under neutral degradation conditions, neither drug showed degradation, with 0.0% degradation reported for both Timolol and Brinzolamide. View evidence ↗
- Oxidative stress caused the highest degradation for Timolol at 69.5%, while Brinzolamide showed 20.1% degradation. View evidence ↗
- Under basic conditions, Timolol degraded by 23.8% and Brinzolamide degraded by 15.8%. View evidence ↗
What it means
- The authors conclude that this validated method is suitable for both qualitative and quantitative analysis of Timolol and Brinzolamide in combination formulations. View evidence ↗
Figures & tables
From the original paper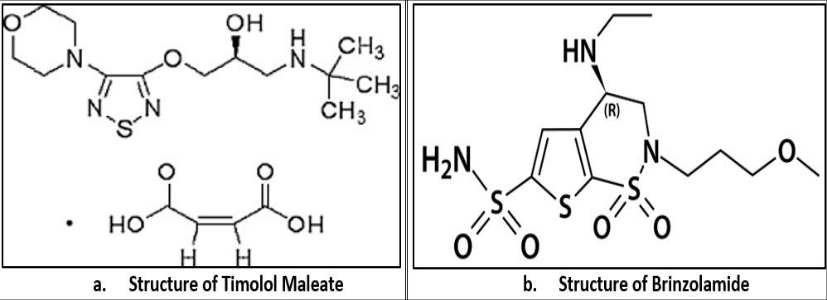 Figure 1
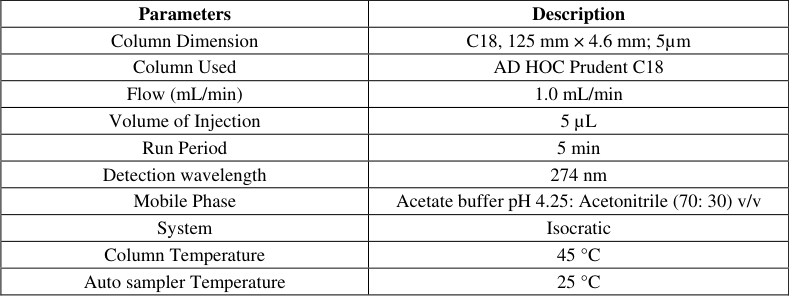 Table 1
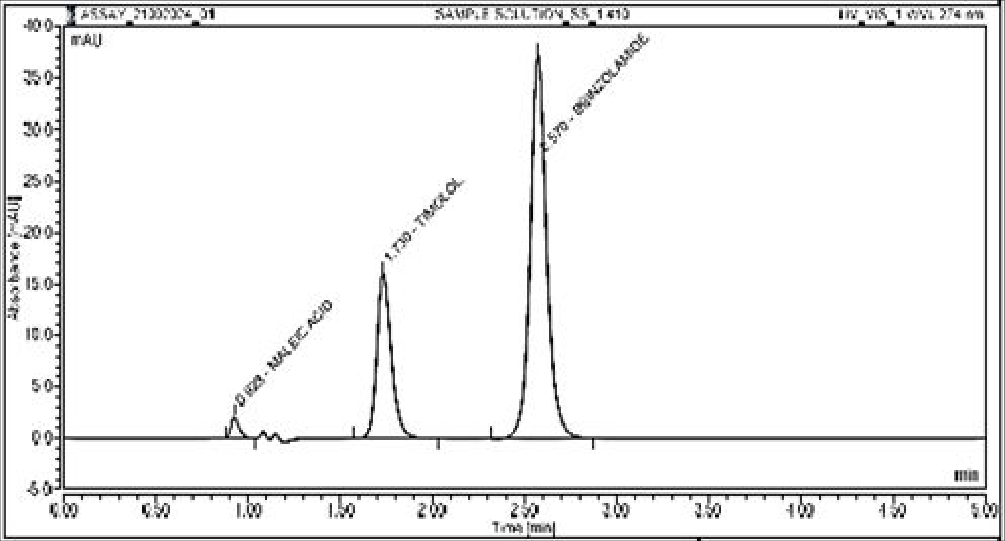 Figure 2
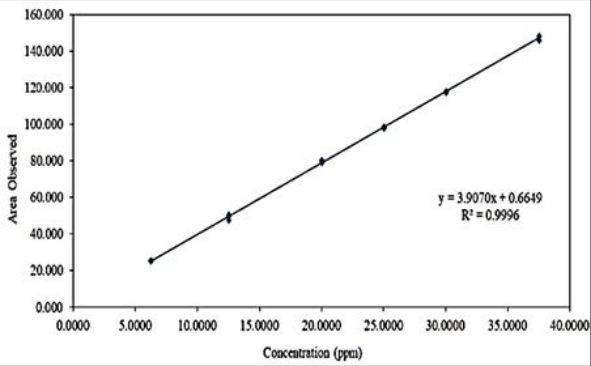 Figure 3
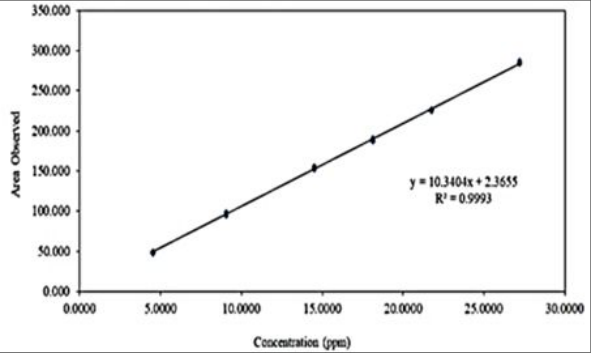 Figure 4
 Table 2
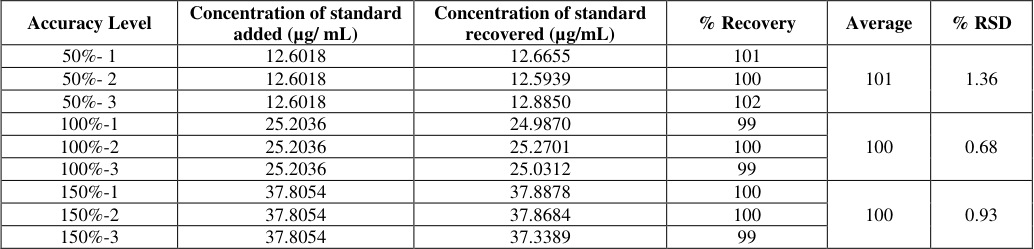 Table 3
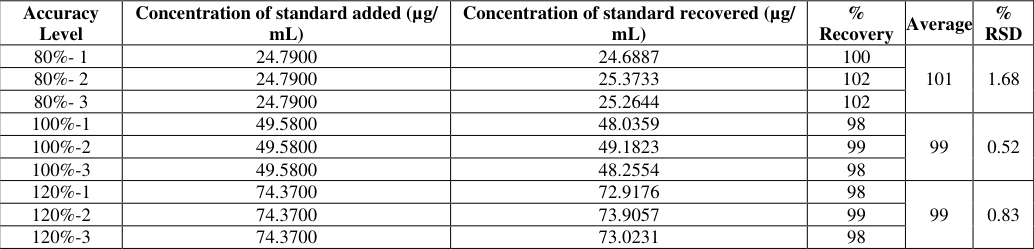 Table 4
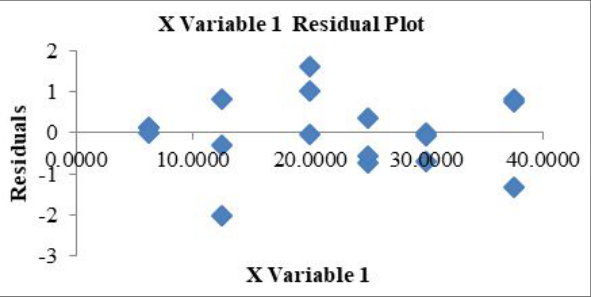 Figure 5
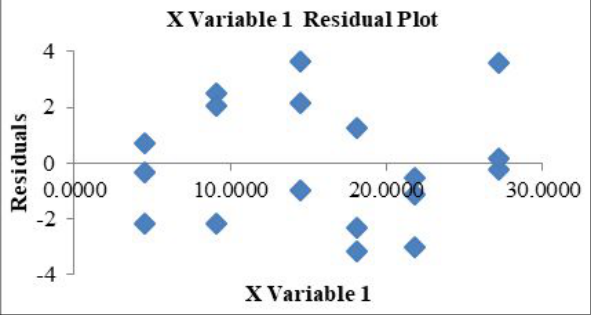 Figure 6
 Table 5
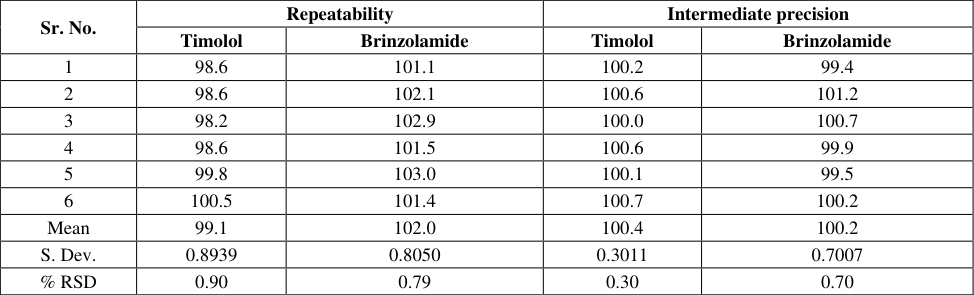 Table 6
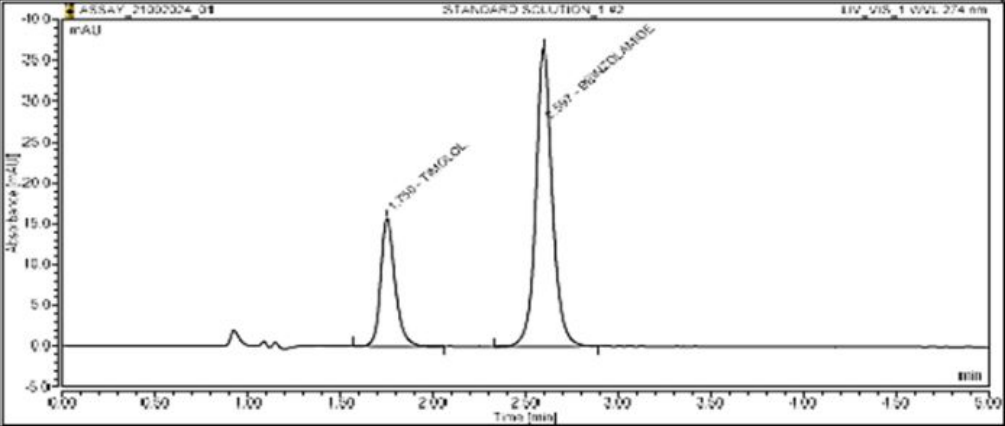 Figure 7
 Table 7
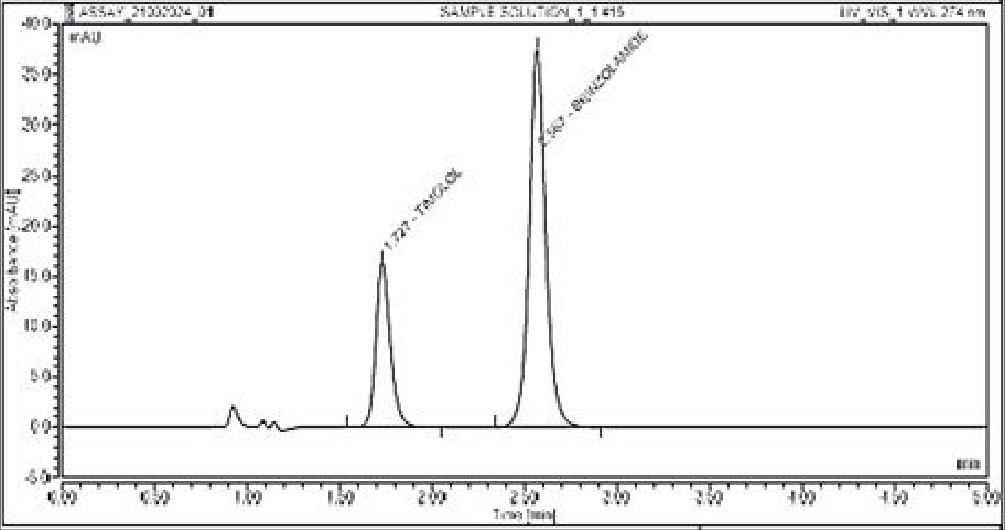 Figure 8
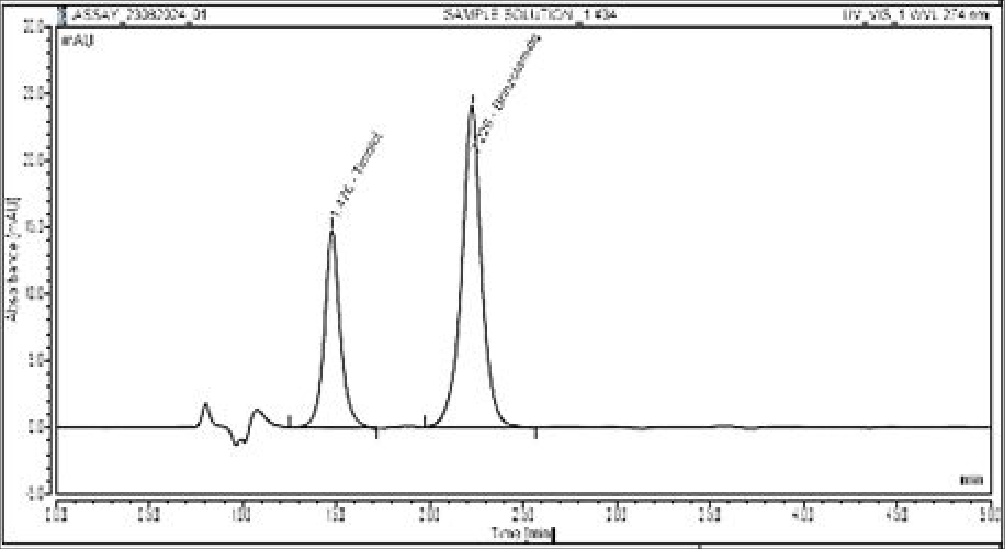 Figure 9
 Table 8
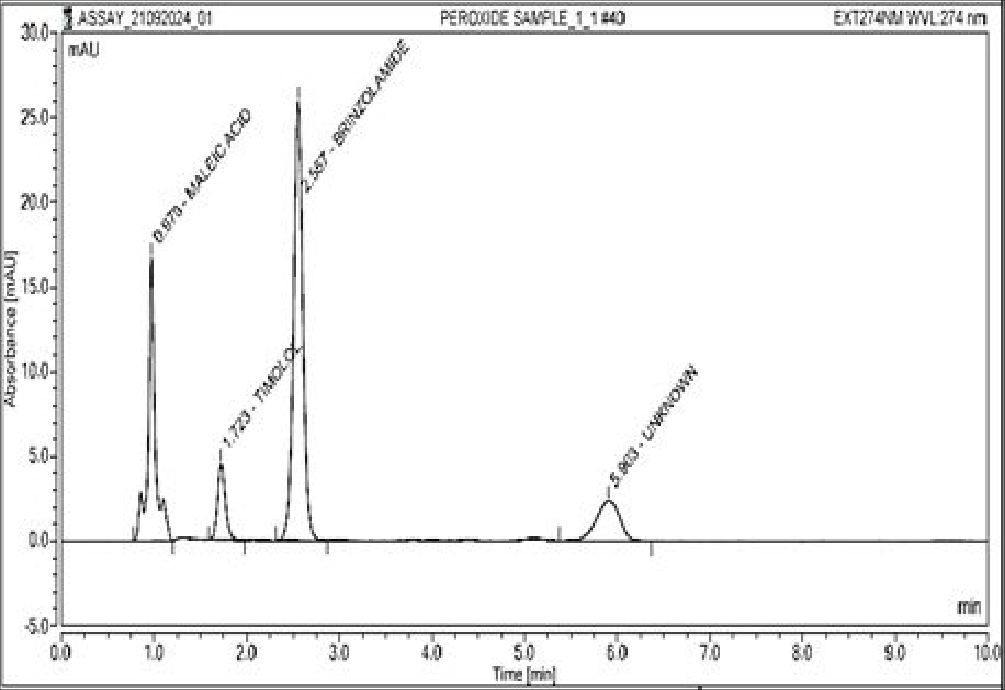 Figure 10
Introduction
Timolol maleate is a nonselective beta-adrenergic antagonist drug which is either used in the oral form or as eye drops for the treatment of hypertension, heart attack and glaucoma [1] . Its IUPAC name is (2S)-1-(tert-butylamino)-3-{[4-(morpholin-4-yl)-1,2,5-thiadiazol-3yl]oxy}propan-2-ol; (2Z)-but-2-enedioic acid [2] . Figure . 1a. In the oral dosage form, this medicine is used to manage high blood pressure [3,4] . These auxiliary drugs to lower the intraocular pressure may not be used or may be used together with this preparation as eye drops for those suffering open angle glaucoma [5][6][7] or ocular hypertension as an eye preparation. Brinzolamide is a carbonic anhydrase II inhibitor [8,9] . When used as eye drops, it acts as an ocular hypertension reducing agent. Its IUPAC name is (4R)-4-(Ethylamino)-2-(3methoxypropyl)-3,4-dihydro-2H-thieno[3,2-e][1,2]thiazine-6-sulfonamide 1,1-dioxide 2 . Figure . 1b. In the Ophthalmic dosage form it works by decreasing aqueous humor secretion which results in lowering the intra-occular pressure in the interior part of eye [10] . The combined effect of these two drugs plays a vital role for Glaucoma treatment and shows more efficiency in lowering the intra ocular pressure (IOP) as compared to separate drug doses [11] . The authors describe several methods for the evaluation of timolol and brinzolamide [12][13][14] . However, there is no established rapid and reliable analytical method required for the identification and subsequent quantification of these two drugs for use in eye preparation in combination dosage form. We have demonstrated that a combination drug formulation can be analyzed rapidly and accurately employing a very sensitive (Stability indicating) [19,20] RP-HPLC technique developed and validated in this work.
Materials and Methods
Materials and Methods
Chemicals and reagents
Timolol maleate standard and Brinzolamide standard were received from Global Calcium Ltd as free samples. HPLC grade (Milli Q) water, acetonitrile (HPLC grade -Merck) and sodium acetate salt (Make -Rankem) were purchased from the open market.
Instrument and system
The instruments used for the analysis were PDA or UVvisible Detection (Ultimate 3000), analytical balance (Sartorius), pH meter (Labindia), ultrasonic bath (Precisonic), and chromatographic system: Thermo Scientific HPLC with Chromeleon Software version 7.2 and separation module. The details are given in Table 1.
| Parameters | Description |
|---|---|
| Column Dimension | C18, 125 mm × 4.6 mm; 5µm |
| Column Used | AD HOC Prudent C18 |
| Flow (mL/min) | 1.0 mL/min |
| Volume of Injection | 5 µL |
| Run Period | 5 min |
| Detection wavelength | 274 nm |
| Mobile Phase | Acetate buffer pH 4.25: Acetonitrile (70: 30) v/v |
| System | Isocratic |
| Column Temperature | 45 °C |
| Auto sampler Temperature | 25 °C |
Table text extracted from the original PDF; superscript letters are shown inline. The original table image is below.
View original table image
Mobile phase preparation
The addition of 5.77 g of sodium acetate and 1.78 g of acetic acid to 800 mL of HPLC grade (Milli Q) water gave 0.1 M sodium acetate solution (buffer pH 4.25). The pH was adjusted to 4.25 with the help of 10N HCl. The final volume was made to 1L with HPLC grade (Milli Q) water. 70: 30 v/v of acetate buffer solution of pH 4.25 and acetonitrile were mixed properly and filtered through 0.45µ nylon membrane filter and degassed to give the mobile phase.
Standard preparation
Timolol Maleate weighing 34 mg and Brinzolamide Standard weighing 25 mg were then placed in a 100 mL and a 50 mL volumetric flask respectively. These volumetric flasks were topped with a mobile phase of 30 mL and the medications dissolved by sonication. The proper level of clear solutions was achieved through dilution with the same mobile phase. The volumetric flasks of 50 mL of content from five mL of the resulting solutions were quantitatively filled using the same mobile phase. The final solutions contained respectively 25 µg/mL Timolol -25 ppm and 50µg/mL Brinzolamide -50 ppm.
Sample preparation
The test sample medicine, Brinzolamide and Timolol in suspension form (Brinzox T eye drops) manufactured by Ajanta Pharma was procured from the Mumbai open market. Sample solutions density (Weight per milliliter) was determined by a densitometer and the value was utilized in the calculations. A 100 mL standard volumetric flask was prepared into which 0.5g of the sample solution was placed. In this case, following dilution with a further 60 mL of the diluent (mobile phase) was added, the flask was sonicated for five minutes, under occasional intermediate shaking. The suspension was subsequently allowed to standard temperature and pressure conditions. The solution after dilution up to the suitable levels with the mobile phase, shaken well and filtered through 0.45 µ nylon membrane syringe filter. The resulting solution contained 25 µg/mL of Timolol and 50 µg/mL of Brinzolamide respectively.
System suitability
The system suitability for Timolol and Brinzolamide was confirmed by evaluating the performance criteria during the analysis. The performance criteria involved achieving theoretical plates count not lower than 1000, tailing factor not exceeding 2.0 with RSD not exceeding 2.0%.
Method Development
In order to obtain the greatest possible separation between timolol and brinzolamide peaks several experiments were done with the use of buffers and stationary phases in a mobile phase [15][16][17][18] . The flow rate selected was 1.0 mL/min as the mobile phase comprising of an acetate buffer solution, pH 4.25 and the increasing concentration of acetonitrile 70:30 v/v brought an acceptable resolution between the two peaks. The column with this combination of the two drugs was selected based upon the sharpness of the peaks, the resolution of the peaks and speed of movement of the peaks. The stationary phase selected was a Prudent C18 AD HOC (125 x 4.6 mm; 5u) P/N: P18-12540-5. Since both timolol and brinzolamide had optimum absorbance at a wavelength of 274 nm, this was the wavelength selected 12 . From the results obtained Timolol and brinzolamide were found to have retention time of 1.7 and 2.5 minutes respectively. The optimal chromatographic parameters chosen in Table 1 have been prepared considering all the conditions described in previous paragraphs. This stability indicating [19,20] method has been determined for the intended purpose after full validation processes following ICH guidelines [21] and the respective chromatographic parameters.
Developed Method Validation:
The developed method was optimized and subjected to validation by utilizing general validation parameters acceptance criteria as per ICH guideline Q2(R2) and USP chapter <1225>. A brief detail of validation outcomes is described along with proper data and final outcome for each parameter.
Specificity
The developed method specificity was also evaluated. This was illustrated by the injection of the blank, standard and individual solutions and noting the interference at the Timolol and Brinzolamide retention times. Preparation of the blank solution began with diluting the mobile phase (The diluent). To prepare the placebo, the same procedures were used as when the sample was being prepared. After that, it was monitored with the chromatographic HPLC apparatus.
Precision
The standards of Timolol and Brinzolamide were readied according to the prescription in standard preparation and injected in the HPLC system with six replicates. The percentage RSD of Timolol and Brinzolamide area was calculated.
Method Precision
The test method was followed and accordingly six individual sample preparations were prepared, injected in the system and the percentage RSD of these six assay results was calculated.
Intermediate Precision
Six different sample preparations are done as per the test procedure and exposed to various HPLC systems, columns and using different lot of chemicals. The experiment was conducted on different days. Six assay results were used to calculate the % RSD. The two assay datasets were also compared using method precision and intermediate precision to assess the percent absolute difference.
Linearity and Range
When the test concentration data is directly proportional to the analyte concentration of the sample within a certain range the analytical method is said to be linear. The concentration 50% to 150% was taken as the standard concentration to determine linearity and range. The graph of concentration taken in µg/mL (x-axis) was plotted against the response (Observed area) (y-axis). Correlation coefficient, percentage y-intercept, slope of regression line, residual sum of squares and percentage relative standard deviation (RSD) of areas of Timolol and Brinzolamide respectively were calculated The concentrations of the standard solutions were prepared at 50%, 80%, 100%, 120% and 150% of the target concentration of Timolol (25 µg/mL) and Brinzolamide (50 µg/mL) respectively. These five levels covered lower and higher level method range.
Accuracy
To determine the accuracy of the analysis three target concentration levels were picked. A placebo was added to a standard stock solution at a concentration of 50%, 100% and 150% respectively in triplicate. As per procedure, these three levels were injected. The overall recovery across all SG levels was 98% to 102% range.
Intermediate precision (Ruggedness)
Although multiple equipment and study days were employed in the activity, the intermediate parameter similarly showed no impact on results. The percent relative standard deviation of the studied data were 0.90 and 0.30 for Timolol while for Brinzolamide 0.79 and 0.70 which were done on different days using separate instrument. The results are presented in Table 6.
| Sr. No. | Repeatability | — | Intermediate precision | — |
|---|---|---|---|---|
| Timolol | Brinzolamide | Timolol | Brinzolamide | |
| 1 | 98.6 | 101.1 | 100.2 | 99.4 |
| 2 | 98.6 | 102.1 | 100.6 | 101.2 |
| 3 | 98.2 | 102.9 | 100.0 | 100.7 |
| 4 | 98.6 | 101.5 | 100.6 | 99.9 |
| 5 | 99.8 | 103.0 | 100.1 | 99.5 |
| 6 | 100.5 | 101.4 | 100.7 | 100.2 |
| Mean | 99.1 | 102.0 | 100.4 | 100.2 |
| S. Dev. | 0.8939 | 0.8050 | 0.3011 | 0.7007 |
| % RSD | 0.90 | 0.79 | 0.30 | 0.70 |
Table text extracted from the original PDF; superscript letters are shown inline. The original table image is below.
View original table image
Robustness
The intentional adjustment (Robustness) of the analytical process and instrumental parameter was examined by small but deliberate changes in the analytical method which uninfluenced the performance of the method. The sample and standard were performed as per the intended methodology. The method variation parameters like flow change + 0.1 mL of 1.0 mL (0.9 mL/ min and 1.1 mL/min), column oven temperature + 5 °C (40 °C and 50 °C) and mobile phase buffer pH + 0.2 (pH 4.05 and pH 4.45) were performed.
Results and Interpretention Specificity
The blank and placebo showed no interference observance at the Timolol (Rt-1.74 Minutes) and Brinzolamide (Rt-2.5 Minutes) retention time respectively as per Figure 2.
Linearity and Range
The R 2 value (correlation of coefficient) was observed at 0.9998 and 0.9955 respectively for Timolol and Brinzolamide, which was within the limit (not less than 0.995) as per validation linearity criteria. The linearity graphs are shown in the Figure 3 and4.
Accuracy:
The methods accuracy as measured by percentage recovery remained in the range of 98-102% (Table 3 and4) Precision: The percentage RSD of system precision observed for standard solution area was 0.1 and 0.2 for Timolol and Brinzolamide peaks which was well below the 2.0% threshold. The method precision was studied with six different sample preparations and % RSD value reported for assay was 0.1 and 0.2 for Timolol and Brinzolamide content, which was within the 2 percent boundaries of the RSD limit range. Similarly intermediate precision also performed on six sample preparation and results 0.1% and 0.2% also fell within the 2 percent boundaries of the RSD limit range. Both the absolute difference between the precision of the methods and the intermediate precision did correlate and were within the given limits. Consequently, Tables 5 and6 showed that the approach was accurate in terms of system precision, method precision, and intermediate precision of the method.
| Accuracy Level | Concentration of standard added (µg/ mL) | Concentration of standard recovered (µg/mL) | % Recovery | Average | % RSD |
|---|---|---|---|---|---|
| 50%- 1 | 12.6018 | 12.6655 | 101 | 101 | 1.36 |
| 50%- 2 | 12.6018 | 12.5939 | 100 | ||
| 50%- 3 | 12.6018 | 12.8850 | 102 | ||
| 100%-1 | 25.2036 | 24.9870 | 99 | 100 | 0.68 |
| 100%-2 | 25.2036 | 25.2701 | 100 | ||
| 100%-3 | 25.2036 | 25.0312 | 99 | ||
| 150%-1 | 37.8054 | 37.8878 | 100 | 100 | 0.93 |
| 150%-2 | 37.8054 | 37.8684 | 100 | ||
| 150%-3 | 37.8054 | 37.3389 | 99 |
Table text extracted from the original PDF; superscript letters are shown inline. The original table image is below.
View original table image
Robustness:
The robustness parameters such as column oven temperature (+ 5°C), flow rate (+ 0.1mL), mobile phase buffer pH (+ 0.2) were performed and their percentage RSD was calculated (Table 7) which was found within the limit. No significant changes were observed in the results even after changing the above parameters and hence we have concluded that the above method is robust as per ICH validation guideline.
| Sr. No. | Parameter change | Absolute Difference | Timolol | Brinzolamide |
|---|---|---|---|---|
| 1 | Column Temperature 40 °C | 2.0% | 98.8 | 101.9 |
| 2 | Column Temperature 50 °C | 99.6 | 101.2 | |
| 3 | Buffer pH 4.15 | 98.5 | 102.1 | |
| 4 | Buffer pH 4.35 | 100.4 | 102.7 | |
| 5 | Flow Rate (0.9 mL/ Min) | 100.0 | 102.4 | |
| 6 | Flow Rate (1.1 mL/ Min) | 100.5 | 102.1 |
Table text extracted from the original PDF; superscript letters are shown inline. The original table image is below.
View original table image
Degradation study Neutral degradation study
The stress level of the test sample was checked by refluxing the test sample quantity at 60 °C for 6 hours under neutral conditions. The resulting solution was diluted up to the mark and injected in HPLC system in order to check the stability of the sample.
Thermal degradation study
The test sample was kept in the oven at 105°C for 6 hours for thermal degradation studies. Subsequently after cooling to room temperature the test sample was diluted up to the mark to obtain the desired concentration and injected in the HPLC device in order to understand the thermal stability of the sample.
Photolytic stability study
The photolytic stability of the test sample was studied by irradiating the test sample to UV-visible light by keeping the sample in a glass beaker in UV photo chamber for 1.2 million Lux hours or 200 watt hours/m 2 . The resulting solution was diluted up to the mark to get the desired concentration and then inserted into the HPLC chromatographic system.
Acid degradation study
Acidic stress level of the sample was analyzed by addition of 1 mL of 2N hydrochloric acid into the sample and refluxing at 60 °C for 30 minutes. Subsequently the resulting solution was cooled and neutralized with 1 mL of 2N sodium hydroxide solution and diluted up to the mark to obtain the desired concentration. HPLC chromatographic system was used to evaluate its acidic stability.
Base degradation study
Alkali stress degradation of the sample was analyzed by addition of 1 mL of 2N sodium hydroxide into the sample and refluxing for 30 minutes at 60 °C. Subsequently the resulting solution was cooled and neutralized with 1 mL of 2N hydrochloric acid solution. Further dilution of the resulting solution was done in order to obtain the desired concentration. The resulting solution was injected in the HPLC system to evaluate its alkali stability.
Peroxide degradation study
Oxidative degradation of sample was evaluated by addition of 1 mL of 3% hydrogen peroxide solution into the sample and refluxing for 30 minutes at 60 °C. After cooling the resulting solution 1 mL of reducing agent sodium metabisulfate solution was added and diluted up to the mark to obtain the desired concentration. The resulting solution was injected in the HPLC device for peroxide degradation study.
The results are shown in Table 8.
| Sr. No. | Type of degradation | Timolol | — | — | Brinzolamide | — | — |
|---|---|---|---|---|---|---|---|
| % Assay | % Release w.r.t digit | % Deg. | % Assay | % Release w.r.t digit | % Deg. | ||
| 1 | Neutral | 102.5 | 100.0 | 0.0 | 100.6 | 100.0 | 0.0 |
| 2 | Thermal | 102.5 | 100.0 | 0.0 | 100.4 | 99.8 | 0.2 |
| 3 | Photolytic | 91.4 | 89.2 | 10.8 | 101.1 | 100.5 | 0.5 |
| 4 | Acid | 102.9 | 100.3 | 0.3 | 98.9 | 98.3 | 1.7 |
| 5 | Base | 78.1 | 76.2 | 23.8 | 84.7 | 84.2 | 15.8 |
| 6 | Oxidative | 31.3 | 30.5 | 69.5 | 80.4 | 79.9 | 20.1 |
Table text extracted from the original PDF; superscript letters are shown inline. The original table image is below.
View original table image
Conclusion
The analytical method developed for Timolol and Brinzolamide quantification in this work, was validated successfully as per ICH guideline Q2(R2) and USP <1225>. This method was found to be specific, precise, linear, accurate and robust. This method will be beneficial for qualitative as well quantitative determination of Timolol and Brinzolamide used in combination in process and final formulation.
Acknowledgement
AcknowledgementThe authors are thankful to Chemclues Life Science Pvt. Ltd in Navi Mumbai, Maharashtra (India) for providing resources and facilities for this research work.
Figures and tables from the paper
| Parameter for Linearity | Timolol | Brinzolamide | Criteria |
|---|---|---|---|
| Correlation coefficient R2 | 0.9996 | 0.9993 | > 0.999 |
| %Y – axis intercept | 0.84 | 1.55 | ≤ ±3% |
| Slope of regression line | 3.91 | 10.34 | To be reported |
| Residual sum of squares | 13.1 | 80.3 | To be reported |
Table text extracted from the original PDF; superscript letters are shown inline. The original table image is below.
View original table image
| Accuracy Level | Concentration of standard added (µg/ mL) | Concentration of standard recovered (µg/ mL) | % Recovery | Average | % RSD |
|---|---|---|---|---|---|
| 80%- 1 | 24.7900 | 24.6887 | 100 | 101 | 1.68 |
| 80%- 2 | 24.7900 | 25.3733 | 102 | ||
| 80%- 3 | 24.7900 | 25.2644 | 102 | ||
| 100%-1 | 49.5800 | 48.0359 | 98 | 99 | 0.52 |
| 100%-2 | 49.5800 | 49.1823 | 99 | ||
| 100%-3 | 49.5800 | 48.2554 | 98 | ||
| 120%-1 | 74.3700 | 72.9176 | 98 | 99 | 0.83 |
| 120%-2 | 74.3700 | 73.9057 | 99 | ||
| 120%-3 | 74.3700 | 73.0231 | 98 |
Table text extracted from the original PDF; superscript letters are shown inline. The original table image is below.
View original table image
| Parameter | Timolol | Brinzolamide | Acceptance Limit |
|---|---|---|---|
| Tailing factor | 1.25 | 1.08 | NMT 2.0 |
| Theoretical plates | 2623 | 4506 | NLT 1000 |
| % Relative standard deviation (RSD) | 0.80 | 0.62 | NMT 2.0% |
| Retention time (in minutes) | 1.75 | 2.59 | - |
Table text extracted from the original PDF; superscript letters are shown inline. The original table image is below.
View original table image
References
19 in the original paper- The American Society of Health-System Pharmacists. Timolol Maleate. Archived from the original on 28 December 2016. Retrieved 8 December 2016.
- Mandour AA, Nabil N, Zaazaa HE, Abdelkawy M. Review on analytical studies of some pharmaceutical compounds containing heterocyclic rings: brinzolamide, timolol maleate, flumethasone pivalate, and clioquinol. Future J Pharm Sci. 2020;6:52.
- O'Brien KP. Timolol Maleate (Blocadern) in the treatment of essential hypertension. N Z Med J. 1975 Nov 12;82(551):293-296.
- Volotinen M, Hakkola J, Pelkonen O, Vappatalo H, Maenpaa J. Metabolism of Ophthalmic Timolol: New aspect of an Old drug. Basic Clin Pharmacol Toxicol. 2011;108:297-303.
- Manni G, Denis P, Chew P. The safety and efficacy of brinzolamide 1%/timolol/0.5% fixed combination versus dorzolamide 2%/timolol/0.5% in patients with open-angle glaucoma or ocular hypertension. J Glaucoma. 2009;18(4):293-300.
- Sanseau A, Sampaolesi J, Suzuki Jr ER, Lopes JF, Borel H. Preference for a fixed combination of brinzolamide/timolol versus dorzolamide/timolol among patients with open-angle glaucoma or ocular hypertension. Clin Ophthalmol. 2013;7:357-362.
- Lester M. Brinzolamide ophthalmic suspension: a review of its pharmacology and use in the treatment of open-angle glaucoma and ocular hypertension. Clin Ophthalmol. 2008;2(3):517-523.
- Tiwari B, Shirsat MK, Kulkarni A. Analytical method development and validation for the determination of Brinzolamide by RP-HPLC. J Drug Deliv Ther. 2020;10(1):92-96.
- Agrawal VP, Desai SS, Jani GK. Development of RPHPLC method for simultaneous determination of Brimonidine Tartrate and Brinzolamide by QbD Approach and its validation. Eurasian J Anal Chem. 2016;11(2):63-78.
- Syed MF, Loucks EMKR. Update and optimal use of a Brinzolamide-timolol fixed combination in open-angle glaucoma and ocular hypertension. Clin Ophthalmol. 2011;5:1291-1296.
- Khatun R, Ashraful Islam SM. Development and validation of analytical method for simultaneous estimation of Brinzolamide and Timolol by HPLC from ophthalmic preparation. IJPSR. 2014;5(3):1001-1007.
- B Anush, AG Susmita, G Rajitha. Analytical method development and validation of new RP-HPLC method for simultaneous estimation of Brinzolamide and Timolol Maleate in ophthalmic solution. Res J Pharm Biol Chem Sci. 2016;7(3):1290-1298.
- Shah PA, Kadikar AS, Gevariya NR, Patel KG. Simultaneous estimation of Brinzolamide and Timolol Maleate using chromatographic methods. Res J Pharm Biol Chem Sci. 2014;5(5):1010-1017.
- El Deeb S, Abdelsamad S, Parr K, Whiter MK, Greener M. RP-HPLC method for simultaneous determination of Dorzolamide, Brinzolamide, and Timolol using Isopropanol as a sustainable organic solvent in the mobile phase. Separations. 2024;11:83.
- Eissa MS, Nour IM, Elghobashy MR, Shehata MA. Validated spectrophotometric methods for simultaneous determination of Brinzolamide and Timolol Maleate in their pure form and ophthalmic preparation. Az J Pharma Sci. 2016 Sep;54:188-202.
- Shah PA, Kadikar AS, Katira RM, Patel KG, Gandhi TR. Simultaneous determination of Brinzolamide and Timolol Maleate using three different spectrophotometric methods. World J Pharm Pharm Sci. 2014;3(2):1955-1967.
- Sandhya D, Sowndarya G, Swathi V. Stability indicating RP-HPLC method for simultaneous estimation of Brinzolamide and Brimonidine in pharmaceutical dosage forms. Int J Adv Pharm Biotechnol. 2020;6(3):15-18.
- Stojanovska AV, Serafimovska T, Darkovska Serafimovska M. Forced degradation of Timolol Maleate on high temperature for verification of HPLC method for related substances in Timolol eye drop 0.5%. Maced Pharm Bull. 2022;68(1):199-200.
- ICH Guideline: Validation of analytical procedures Q2(R2). 2022; Geneva, Switzerland.