
Research article · 2025 · Full text
International Journal of Veterinary Sciences and Animal HusbandryAn overview of lactation curve models for predicting milk yield in Murrah Buffalo
Volume 10(3S) · Pages 03–09 · DOI: 10.22271/veterinary.2025.v10.i3sa.2104 ↗
Research areasLivestock Management and Performance ImprovementAgricultural Economics and PracticesGenetic and phenotypic traits in livestock
Abstract
Author-writtenMilk production is a continuous physiological process during lactation, characterized by the rate of milk secretion as lactation progresses. Even under consistent environmental and managerial conditions, the biometric traits of lactation vary among genetic groups. Although the quantitative levels of milk production differ, the overall trend remains similar, with an initial phase of rapid increase leading to a peak, followed by a gradual decline. In this review, various models have been evaluated for their effectiveness in describing milk yield patterns and predicting 305-day milk yield based on daily milk yield records.
Summary
Source-checkedPlain-language reading of the full paper, prepared with AI and checked against the text. Each point links to the authors' own words.
Why it matters
- Milk production in buffaloes follows a curvilinear pattern, starting with a rapid increase to a peak yield and then gradually declining. View evidence ↗
- The shape of the lactation curve is economically important because animals with steady milk production are more desirable than those with high peaks and rapid declines. View evidence ↗
The question
- The review aims to evaluate different mathematical models to see how effectively they describe milk yield patterns and predict the total 305-day milk yield. View evidence ↗
What they did
- The authors reviewed the impact of four primary non-genetic factors: period of calving, season of calving, parity, and age at first calving. View evidence ↗
- The review examines various mathematical functions, including parabolic exponential, gamma, inverse polynomial, and polynomial regression functions, to determine their fit for lactation data. View evidence ↗
What they found
- The period of calving significantly impacts several production traits in Murrah buffaloes, including peak yield, 305-day milk yield, and the time taken to reach peak yield. View evidence ↗
- Season of calving affects milk yield; in Murrah and Nili-Ravi buffaloes, those calving between July and December showed higher 305-day yields than those calving between January and June. View evidence ↗
- In Egyptian buffaloes, winter calving is associated with the highest daily milk yield, particularly in animals at their fourth parity. View evidence ↗
- Milk yield in Murrah buffaloes generally increases from the first to the fourth parity, with peak yields reaching a maximum at the fourth parity before declining. View evidence ↗
- The polynomial regression function was found to be highly accurate for estimating first lactation 305-day milk yield, achieving an R² of 99.3%. View evidence ↗
- The inverse polynomial function has been identified as providing an exceptionally high fit for lactation curves, with an R² value of 99.92%. View evidence ↗
What it means
- The authors conclude that understanding lactation curves is essential for improving herd performance and developing better breeding and management strategies. View evidence ↗
- The authors state that comparing lactation models is particularly useful for predicting early-life milk production, which helps in early selection or culling of animals. View evidence ↗
Visual summary
2 visualsIllustrations explain the paper; they do not show study data.
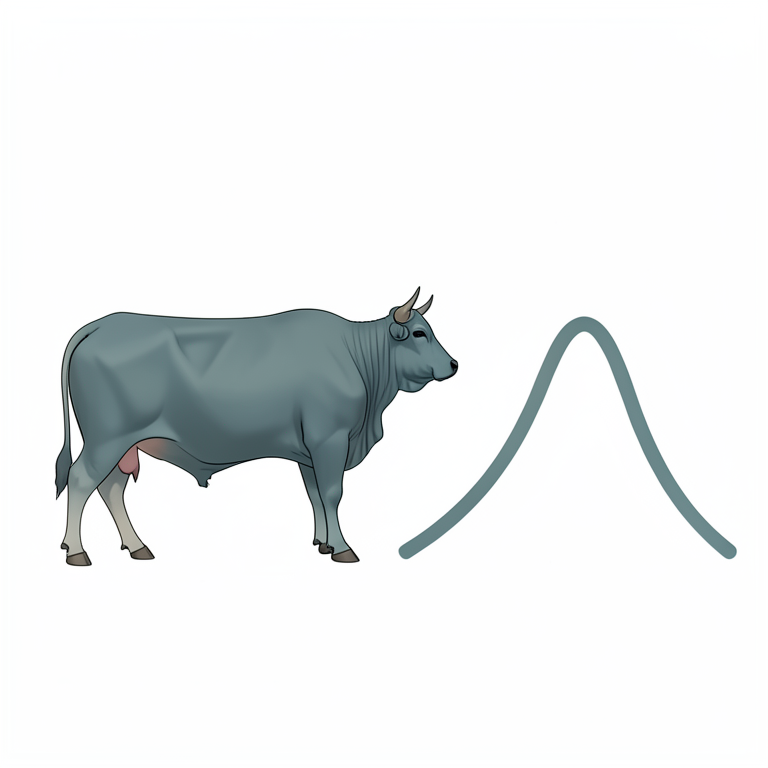
Typical Lactation Curve Shape
AI-generated conceptual illustration (Murrah buffalo). It explains the idea and does not show study data.
View source evidence ↗
Milk Yield vs Parity
AI-generated conceptual illustration (Murrah buffaloes). It explains the idea and does not show study data.
View source evidence ↗Introduction
Buffalo holds significant importance in India's dairy industry, contributing nearly half of the nation's total milk production (BAHS, 2023) [5] . This underscores the widespread adoption of the Murrah breed of buffalo among Indian farmers. Known for their higher milk fat content compared to cattle, buffaloes are extensively reared in peri-urban and rural farming systems with a primary focus on quality milk production. In buffaloes, milk production traits exhibit a curvilinear pattern throughout the lactation. Analysing the lactation curve of dairy animals provides valuable insights into the dynamics of milk production traits, which are significantly influenced by both genetic and non-genetic factors. Non-genetic factors such as the calving period, season of calving, age at first calving, and parity have a profound impact on lactation parameters. Understanding these influences enables breeders to enhance economically important traits like milk production. The lactation curve is a graphical depiction of milk yield over time (Brody et al., 1923) [10] or can also represent the rate of milk secretion as lactation advances. It typically comprises two distinct phases: a rapid increase from calving to peak yield in the early lactation stage, followed by a gradual decline until the end of lactation (Leon-Velarde et al., 1995) [49] . The ascending phase reflects a steep, linear rise in milk yield, the persistent phase showcases the animal's innate capacity for consistent milk production, and the descending phase is shorter and usually associated with the drying-off stage. The biometric characteristics of lactation vary across its stages, even when environmental and managerial conditions remain constant (Yadav and Sharma, 1985) [94] . Economically, the shape of the lactation curve is vital, as animals producing a steady, moderate level of milk throughout lactation are preferred over those that peak highly but taper off quickly. A sharp decline in milk yield post-peak increases production costs as the yield becomes unevenly distributed. Factors like lactation yield and persistency significantly influence milk production costs. Identifying cows with specific lactation patterns and persistency can provide an additional selection criterion for dairy herds. Modelling the lactation curve offers numerous benefits, including predicting a cow's milk yield during lactation with minimal error. It aids in cow/sire evaluation, allowing for decisions about culling or identifying animals with subclinical diseases (Vargas et al., 2000) [89] .
Furthermore, it helps predict production potential from field records and provides a concise summary of biological efficiency and persistency in dairy animals. Knowledge of lactation curves is also crucial for herd management, selection strategies, and genetic evaluation aimed at improving milk production traits. The effectiveness of a lactation model depends on its ability to replicate the biological lactation process and adjust for environmental and other influencing factors. The goal of modelling lactation curves is to predict milk yield at any point during lactation with high accuracy. Numerous studies have been conducted on dairy cattle to fit lactation curve models (Dongre et al., 2011 and Banu et al., 2012) [62,7] , but limited research exists on fitting such models for Murrah buffaloes (Sahoo et al., 2014) [73] .
Review of Literature Non-genetic factors affecting lactation curve
The various non-genetic factors viz. the Period of calving, the Season of calving, Parity and Age at first calving affect the shape of the lactation curve. The effect of these factors has been studied by various workers in different regions on dairy animals.
Effect of period of calving
In Holstein Friesian cattle, the period of calving (POC) has been found to significantly influence the upward slope of the lactation curve (Wood, 1967) [91] . A similar effect of POC on the shape of the lactation curve was observed in Sahiwal cattle by Rao and Sundaresan (1979) [67] and in Hariana cattle by Mehto et al. (1980) [51] using the Wood function. For Holstein cows, Dedkova and Nemcova (2003) [21] reported a highly significant effect of POC. In Murrah buffaloes, Patil et al. (2011) [62] observed a significant impact of POC (p<0.01) on age at first calving, while Barman et al. (2013) [9] documented its significant effect on lifetime milk yield, productive life, and herd life. Geetha (2005) [33] noted a significant influence of POC on all monthly test-day milk yields, except for the 35 th , 215 th , and 305 th test days. Similarly, Rana (2008) [66] highlighted its significant effect on all first lactation cumulative test-day milk yields, while Thiruvenkadan et al. (2014) [86] observed a significant impact on complete lactation milk yield (CLMY), lactation length, peak yield, and 305-day milk yield, along with its effect (p<0.05) on days to attain peak yield. Dass and Sadana (2000) [18] , Jakhar et al. (2017) [39] , and Thiruvenkadan et al. (2010) [87] reported a highly significant (p<0.01) effect of POC on age at first calving, further confirmed by Thiruvenkadan et al. (2015) [85] . POC also significantly affects reproduction traits (p<0.05) and production traits (p<0.01), as highlighted by Jamuna et al. (2015) [40] . Narwaria et al. (2017) [54] reported a highly significant (p<0.01) impact on total milk yield, milk yield per lactation length, and milk yield per calving interval. Verma et al. (2016) [90] found a significant (p<0.05) effect on total milk yield and 305-day milk yield, with similar results observed by Sarkar et al. (2006) [74] . Pareek and Narang (2015) [59] noted a highly significant (p<0.01) influence of POC on persistency, 305-day milk yield, and peak yield. In Murrah buffaloes, Chitra et al. (2018) [14] demonstrated a highly significant (p<0.01) effect on milk constituents and their yield traits. Dangar and Vataliya (2018) [16] observed a significant (p<0.05) impact on complete lactation milk yield in Jaffarabadi buffaloes, while Mire et al. (2019) [52] reported a highly significant (p<0.01) effect on CLMY and lactation length. In Sahiwal cattle, Pandey et al. (2019) [58] documented POC's influence on first lactation 305-day milk yield and lifetime milk yield. Suresh et al. (2004) [82] found a highly significant (p<0.05) effect on days to attain peak yield, and Sigdel et al. (2015) [75] identified a significant (p<0.05) effect on daily and 305-day milk yields in Murrah buffaloes. Kumar et al. (2003) [46] noted a significant (p<0.05) impact on the first total lactation milk yield (TLMY), while Penchev et al. (2011) [65] reported a significant (p<0.01) effect on daily milk yield in Bulgarian Murrah buffaloes. Ambhore et al. (2016) [2] highlighted the highly significant (p<0.01) impact of POC on all first lactation traits except for the first service period, which showed significance at (p<0.05). Tailor and Singh (2011) [83] observed a significant (p≤0.05) effect on the 1 st , 4 th , 6 th , and 7 th monthly test-day milk yields, while Kumar et al. (2012) [64] reported a highly significant (p≤0.01) influence on the 9th test-day milk yield. Singh (2014) identified a highly significant (p<0.01) effect of POC on the 305-day first lactation milk yield and all monthly test-day milk yields except for the 9 th . Gajbhiye and Tripathi (1999) [30] noted a highly significant (p<0.01) influence on the first lactation 305-day milk yield, with similar findings reported by Dhirendra et al. (2003) [23] in Murrah buffaloes and Pathodiya and Jain (2004) [61] in Surti buffaloes. In Murrah buffaloes, a significant effect of POC on 305-day milk yield was documented by El-Arian (1986) [27] , Gajbhiye (1987) [31] , Tomar and Tripathi (1988) [88] , Singh et al. (1990) [80] , Ipe and Nagarcenkar (1992) [38] , Sahana (1993) [70] , Dass and Sharma (1994) [19] , Nath (1996) [55] , Saha (1998) [69] , Lathwal (2000) [48] , and Gupta (2009) [35] . Dev et al. (2015) [22] also reported its significant impact on first lactation milk yield and first lactation peak milk yield, while Pander et al. (2017) [57] noted its significant influence on the first service period in Hardhenu cattle. Yadav et al. (1977a) [92,93] applied the gamma function to average yields in Hariana cattle and reported a significant effect of Season of Calving (SOC) on all parameters of the Wood function. Similarly, Rao and Sundaresan (1979) [67] found a significant impact of SOC on the shape of the lactation curve in Sahiwal cattle, which was also observed in Hariana cattle by Mehto et al. (1980) [51] for all three parameters of the gamma function. Additionally, Tekerli et al. (2000) [84] and Atashi et al. (2009) [3] documented a significant influence of SOC on the shape of the lactation curve in Holstein Friesian cattle. Patro and Bhat (1979) [63] observed a highly significant effect (p<0.01) of SOC on the first lactation 305-day milk yield in Murrah and Nili-Ravi buffaloes, with higher yields recorded for lactations beginning between July and December compared to January to June. El-Arian (1986) [27] also reported a significant effect of SOC on the 305-day lactation milk yield in Murrah buffaloes, noting that summer calvers produced more milk than winter calvers, followed by autumn and rainy season calvers. Dhirendra et al. (2003) [23] confirmed similar findings for 305-day lactation milk yield. In Hardhenu cattle, Pander et al. (2017) [57] found a significant effect only on the first service period. Thiruvenkadan et al. (2014) [86] reported that SOC significantly affected total lactation milk yield (TLMY) and had a highly significant (p<0.01) impact on peak yield, days to attain peak yield, and 305-day milk yield in Murrah buffaloes. A significant (p<0.05) effect on age at first calving was observed by Thiruvenkadan et al. (2015) [85] , who also noted that milk yields were highest for winter calvers, followed by rainy and summer season calvers, findings supported by Pawar et al. (2012) [64] . Dass and Sadana (2000) [18] , Verma et al. (2016) [90] , and Sarkar et al. (2006) [74] also highlighted the significant effect of SOC on TLMY. In Egyptian buffaloes, Hassan et al. (2017) [36] revealed a highly significant (p<0.01) impact of SOC on daily milk yield, 305-day milk yield, lactation length, and TLMY. Winter calvers had the highest daily milk yield compared to other seasons, with the fourth parity yielding the best results. Kamble et al. (2014) [42] reported longer lactation lengths among buffaloes calving in winter, whereas summer calvers exhibited shorter lactation lengths. Ambhore et al. (2016) [2] noted that SOC significantly (p<0.05) influenced first lactation 300-day milk yield but had no significant effect on other first lactation traits. Jamuna et al. (2015) [40] found SOC significantly impacted service periods and days to first service, while Parmar et al. (2018) [60] reported a highly significant (p<0.01) effect on all test-day yields. Additionally, Patil et al. (2011) [62] observed a significant (P<0.01) effect on the first service period, and Narwaria et al. (2017) [54] found a significant (p<0.01) impact on milk yield per lactation length. Sigdel et al. (2015) [75] documented a significant effect of SOC on daily milk yield (p<0.01), lactation length (P<0.05), and 305-day milk yield (p<0.01) in Nepalese Murrah buffaloes. Pareek and Narang (2015) [59] reported SOC significantly affected peak yield. Dev et al. (2015) [22] found significant effects on the first service period and first calving interval in Murrah buffaloes. Garcha and Dev (1994) [32] observed a significant influence of SOC on all test-day milk yields in Murrah buffaloes, while Dass (1995) [20] noted its effect on the 2 nd , 6 th and 7 th monthly test-day milk yields in Surti buffaloes. Tailor and Singh (2011) [83] reported a significant (p≤0.05) impact of SOC on all test-day milk yields in Surti buffaloes. However, Kumar et al. (2012) [64] found a significant effect only on the 2nd testday milk yield in Murrah buffaloes. Yadav et al. (1977b) [92,93] applied the Wood function to average weekly yields in Hariana cattle and its Friesian crosses, finding a significant effect on the inclining and declining parameters of the lactation curve. Using the Wood function in Sahiwal cows, Rao and Sundaresan (1979) [67] reported a significant influence of age at first calving (AFC) on the lactation curve's shape. Similarly, Mehto et al. (1980) [51] observed in Hariana crossbreds that initial milk yield increased linearly with advancing age of the cows, as indicated by their lactation sequence. Dedkova and Nemcova (2003) [21] , studying Holstein cattle, noted that cows with a lower age at first calving exhibited the best persistency, while a slower growth in the slope up to the production peak was observed in cows with a higher age at calving, as modeled by the Wood function. In Holstein cows, Tekerli et al. (2000) [84] found AFC to have a significant effect (p<0.05) on peak yield, while its influence on lactation yields and the lactation curve was also noted. Jamuna et al. (2015) [40] observed a highly significant effect (p˂0.01) of AFC on service period and lactation length. Parmar et al. (2018) [60] reported a highly significant effect (p<0.01) of AFC grouping on all lactation test-day yields. In Sahiwal cattle, Pandey et al. (2019) [58] highlighted a significant effect of AFC on lifetime milk yield. Rana (2008) [66] documented that the regression of cumulative test-day milk yields showed a significant effect (p<0.05) on the first test day, which became highly significant (p<0.01) for the remaining cumulative test-day yields and the 305-day milk yield. Observed highly significant effects (p≤0.01) of AFC on the first lactation 305-day milk yield and monthly test-day yields TD-1, TD-2, TD-3, TD-4, TD-7, and TD-9, along with significant effects (p≤0.05) on TD-5.
Effect of season of calving
Effect of season of calving
Effect of age at first calving
Effect of age at first calving
Effect of parity
Rao and Sundaresan (1979) [67] stated that in Holstein Friesian cattle, least-squares analysis of traits linked to lactation curve shape showed that parity significantly influenced the lactation curve, a finding also reported by Tekerli et al. (2000) [84] . Horan et al. (2005) [37] , studying Holstein Friesian cows, found parity had a significant impact on all three lactation curve parameters, particularly peak production and lactation persistency. They observed that higher parity animals had increased intercept values along with steeper incline and decline parameters. Similarly, Atashi et al. (2009) [3] reported a significant effect of parity on lactation, whereas Singh and Yadav (1987) [77] noted that daily milk yield in Murrah buffaloes increased with the number of lactations. Thiruvenkadan et al. (2014) [86] reported in Murrah buffaloes that daily milk yield increased from the first to fourth parities. They also observed a highly significant effect of parity (p<0.01) on total lactation milk yield (TLMY), 305-day milk yield (305 MY), peak yield, and lactation length, with days to attain peak yield decreasing from the first to the fifth parity. Dass and Sadana (2000) [18] , Jamuna et al. (2015) [40] , Verma et al. (2016) [90] , and Jakhar et al. (2017) [39] found that parity significantly affected 305 MY (p<0.01) in Murrah buffaloes. Chaudhary et al. (2000) [13] reported a peak yield of 9.8±0.55 kg for first-parity buffaloes, which increased until the fourth parity and declined thereafter. Sigdel et al. (2015) [75] observed in Murrah buffaloes a significant impact of parity on daily milk yield in Nepal, with the 305-day milk yield and TLMY significantly influenced by parity (p<0.01). Jamuna et al. (2015) [40] also reported a significant effect of parity on reproduction traits (p˂0.05) and production traits (p˂0.01). Hassan et al. (2017) [36] , studying Egyptian buffaloes, found parity had a significant effect on daily milk yield, lactation length, and TLMY (p<0.01), with the highest TLMY occurring in the fourth parity before declining. Sundaram and Harharan (2013) [81] revealed that 305-day milk yield was significantly affected (p<0.05) by lactation number in Murrah buffaloes. In swamp buffaloes, reported that peak yield was significantly influenced by parity (p<0.01), increasing gradually until the fourth parity and then declining.
Comparative efficiency of different lactation curve models
Singh and Bhat (1978) [76] found that lactation of varying durations (<44 weeks) in Hariana cattle was best described by the parabolic exponential function, which provided a good fit with an R² value of 74% for first lactation milk yield. They also reported an R² value of 97.3% for the gamma function in describing the average lactation curve in Hariana cattle, while the inverse polynomial function explained 99.9% of the variation. Ali and Schaeffer (1987) [1] compared three models-ranked regression, gamma function, and inverse quadratic polynomial function for describing lactation curves in individual cows. The gamma function achieved a relative efficiency of 74.7% compared to selection based solely on 305-day milk yield. Gahlot et al. (1988) [29] observed that the parabolic exponential model was a good fit (R² = 74%) for first lactation milk yield, while the inverse polynomial function provided the best fit. Additionally, the gamma function explained 94.68% of the variation in average monthly milk yields in Rathi cows. Olori et al. (1999) [56] reported an R² value of 96.4% for the mixed log function in Holstein Friesian cattle. Catillo et al. (2002) [12] demonstrated that the mixed log model effectively estimated lactation curves and noted that the polynomial regression function was flexible enough to fit test-day milk production records in Italian water buffaloes. Kumar (2007) [47] reported R² values of 96.7% for the mixed log function, 99.7% for the polynomial regression function, and 99.6% for the exponential function in Murrah buffaloes. Dimauro et al. (2005) [24] observed R² values of 94.4% and 96.7% for the exponential and polynomial regression functions, respectively, in Italian water buffaloes. Aziz et al. (2006) [4] reported an R² value of 96.0% for the gamma-type function in Egyptian buffaloes, consistent with findings by Rashia (2010) [68] , who reported R² values of 87.9% for weekly and 95.9% for monthly test-day milk yields in Karan Fries cattle. Kumar (2007) [47] recorded a 99.6% R² value for the exponential function in Murrah buffaloes, while Cilek and Keskin (2008) [15] reported an R² value of 92.7% for the mixed log function in Simmental cows. Barbosa et al. (2007) [8] identified the incomplete gamma function as the best for lactation curves, yielding a coefficient of determination of 95%, a standard deviation of 0.068, a coefficient of variation of 7.20, and a standard error of 0.003. Cankaya et al. (2011) [11] found that the Wood model had the lowest residual standard deviation (3.562), the highest adjusted R² (91.6%), and the best persistency value (93.3%). Banu et al. (2012) [7] observed maximum accuracy (R² = 99.5%) for the polynomial regression function, with the quadratic cum log model (R² = 99.2%) performing nearly as well. Dongre et al. (2011) [62] determined that the inverse polynomial function offered the best fit, with the highest R² value (99.92%) and the lowest root mean square error (RMSE) (0.107 kg). Dohare et al. (2014) [25] concluded that the Mitscherlich x Exponential model provided the best fit for fortnightly milk yield data in Frieswal cattle, achieving the highest adjusted R² value (99.2%). Ferreira et al. (2015) [28] noted that the Wood model performed best in various scenarios for Holstein cows in southwestern Paraná. Sahoo et al. (2015) [78] found that Ali and Schaeffer's polynomial regression function yielded the highest R² value (0.998) and the lowest RMSE (0.03), indicating superior fit. Singh et al. (2015) observed R² values of 96.42%, 98.65%, 98.48%, and 99.86% for the gamma, exponential, mixed log, and parabolic regression functions, respectively, with PRF offering the best fit based on higher R² and lower RMSE. Ghavi Hossein-Zadeh (2016) [34] reported that the Dijkstra equation best modeled milk yield across the first three parities in buffaloes. Mohanty et al. (2017) [53] found that the Ali and Schaeffer model was the most accurate, with an adjusted R² of 97.8%, the lowest RMSE (0.328), and favourable AIC (-91.208), corrected AIC (-89.587), and SBC (-82.402) values. Bangar and Verma (2017) [54] noted that the mixed log function best modeled the lactation curves for Gir crossbred cows. Kong et al. (2018) [44] concluded that the Nelder, Wood, and Dhanoa models closely matched actual lactation curves and could effectively predict 305-day milk yields for management and genetic evaluation in Chinese Holstein cattle. Sahoo et al. (2018) [71] observed that the polynomial regression function provided the best fit, with the highest R² value (99.3%) and lowest RMSE (0.3%), for estimating first lactation 305-day milk yield (FL305-DMY) from weekly testday records, whereas the exponential function had the lowest R² (88.5%) and highest RMSE (1.26%).
Conclusion
Non-genetic factors such as the period of calving, season of calving, age at first calving, and parity significantly influence milk production traits. Therefore, understanding the lactation curve holds substantial potential for enhancing the herd's overall performance. It also offers a valuable overview of buffalo efficiency, aiding in the development of effective breeding and management strategies for breed improvement programs and the genetic evaluation of buffaloes. Studies comparing various lactation curve models to describe the lactation curve shape in buffaloes have proven to be highly beneficial for predicting several production traits, particularly milk production at early stage of life for early culling/selection.
Conflict of Interest Not available
Conflict of Interest Not available
Financial Support
Financial Support
References
94 in the original paper- Ali TE, Schaeffer LR. Accounting for covariance among test day milk yields in dairy cows. Canadian Journal of Animal Science. 1987;67:637-644.
- Ambhore GS, Singh A, Deokar DK, Sahoo SK, Singh M, Divya P. Heritability estimates of first lactation 300-day milk yield under single versus multi-trait animal models in Phule Triveni cattle. Indian Journal of Animal Sciences. 2016;86(6):682-685.
- Atashi H, Moradi MS. Environmental factors affecting the shape components of the lactation curves in Holstein dairy cattle of Iran. Livestock Research for Rural Development. 2009;21(5).
- Aziz MA, Shalaby NA, El-Shafie OM, Mahdy AT, Nishida A. Comparison between the shapes of lactation curve of Egyptian buffalo milk yield estimated by the incomplete gamma function and a new model. Livestock Research for Rural Development. 2006;18(5):59.
- BAHS. Basic Animal Husbandry and Fisheries Statistics. Department of Animal Husbandry, Dairying and Fisheries, Ministry of Agriculture and Farmers Welfare, Government of India, 2023.
- Bangar YC, Verma MR. Non-linear modelling to describe lactation curve in Gir crossbred cows. Journal of Animal Science and Technology. 2017;59(1):3.
- Banu R, Singh A, Malhotra R, Gowane G, Kumar V, Jaggi S. Comparison of different lactation curve models in Karan Fries cattle of India. Indian Journal of Animal Sciences. 2012;82(11):1377-1380.
- Barbosa SBP, Pereira RGA, Santoro KR, Batista AMV, Ribeiro Neto AC. Lactation curve of cross-bred buffalo under two production systems in the Amazonian region of Brazil. Italian Journal of Animal Sciences. 2007;6(2):1075-1078.
- Barman RSD, Grewal SS, Jha DK. Non-genetic factors affecting lifetime performance traits in Murrah buffaloes. Indian Journal of Animal Production and Management. 2013;29(1-2):81-86.
- Brody S, Ragsdale AC, Turner CW. The rate of decline of milk secretion with the advance of the period of lactation. The Journal of General Physiology. 1923;5:441-444.
- Cankaya S, Unalan A, Soydan E. Selection of a mathematical model to describe the lactation curves of Jersey cattle. Archiv Tierzucht. 2011;54(1):27-35.
- Catillo G, Macciotta NPP, Carretta A, Cappio-Borlino A. Effects of age and calving season on lactation curves of milk production traits in Italian water buffaloes. Journal of Dairy Science. 2002;85(5):1298-1306.
- Chaudhary HZ, Khan MS, Mohiuddin G, Mustafa MI. Peak milk yield and days to attain peak in Nili-Ravi buffaloes. International Journal of Agriculture and Biology. 2000;2:356-358.
- Chitra A, Jain A, Kumar M, Ratwan P, Gupta AK. Effect of genetic and non-genetic factors on milk yield and milk composition traits in Murrah buffaloes. Indian Journal of Animal Research. 2018;52(2):304-308.
- Cilek S, Keskin I. Comparison of six different mathematical models to the lactation curve of Simmental cows reared in Kazova state farm. Journal of Veterinary and Animal Advances. 2008;7(10):1316-1319.
- Dangar NS, Vataliya PH. Non-genetic factors affecting first lactation milk yield of Jaffarabadi buffalo in organized farm of India. Buffalo Bulletin. 2018;37(4):461-471.
- Das A, Das D, Goswami RN, Bhuyan D, Sinha S. Effects of non-genetic factors on lactation milk yield and peak yield of swamp buffalo and their repeatability. Indian Journal of Animal Research. 2015;49(3):418-9.
- Dass G, Sadana DK. Factors affecting some economic traits in Murrah buffaloes. Indian Journal of Animal Research. 2000;34(1):43-5.
- Dass G, Sharma RC. Factors affecting milk production in Murrah buffaloes. Journal of Animal Research. 1994;28:61-4.
- Dass G. Studies on prediction of lactation yield based on test day values in buffaloes. Ph.D. Thesis, NDRI (Deemed University), Karnal, Haryana, India, 1995.
- Dedkova L, Nemcova E. Factors affecting the shape of lactation curves of Holstein cows in the Czech Republic. Czech Journal of Animal Science. 2003;48:395-402.
- Dev K, Dhaka SS, Yadav AS, Sangwan SK. Genetic parameters of early performance traits in Murrah buffaloes. The Haryana Veterinarian. 2015;54(2):144-6.
- Dhirendra K, Singh H, Kumar D, Singh CV. Non-genetic factors affecting some production and reproduction traits in Murrah buffaloes. Indian Journal of Animal Research. 2003;37(1):24-7.
- Dimauro C, Catillo G, Bacciu N, Macciotta NPP. Fit of different linear models to the lactation curve of Italian water buffalo. Italian Journal of Animal Sciences. 2005;4:22-4.
- Dohare AK, Singh B, Verma MR, Perme B, Sharma VB, Gupta N, et al. Comparison of standard lactation curve models using fortnightly milk records in Frieswal cattle. Veterinary World. 2014;7(10):831-4.
- Dongre VB, Gandhi RS, Singh A, Malhotra R. Prediction of first lactation 305-day and fortnightly test day milk yields using lactation curves models in Sahiwal cattle. International Journal of Agriculture: Research and Review. 2011;1(2):87-90.
- El-Arian. Genetic analysis of Murrah buffalo herd. Ph.D. Thesis, Kurukshetra University, Kurukshetra, Haryana, India, 1986.
- Ferreira Abilio GT, Henrique Douglas S, Vieira Ricardo AM, Maeda Emilyn M, Valotto Altair A. Fitting mathematical models to lactation curves from Holstein cows in the south-western region of the state of Parana, Brazil. Annals of the Brazilian Academy of Sciences. 2015;87(1):503-517.
- Gahlot GC, Gahlot RS, Jairath LK. Pattern of lactation curve in Rathi cattle. Indian Journal of Animal Science. 1988;58(9):1112.
- Gajbhiye PU, Tripathi VN. Effect of season, period and age at first calving on first lactation traits in Murrah buffaloes. Indian Journal of Dairy Science. 1999;52:199203.
- Gajbhiye PU. Evolving restricted indices for selection of buffaloes. Ph.D. Thesis, Kurukshetra University, Kurukshetra, Haryana, India, 1987.
- Garcha DS, Dev DS. Number of daughters required to progeny test dairy sires under different sampling schemes. Journal of Dairying, Foods and Home Sciences. 1994;13(2):113-8.
- Geetha E. Studies on breeding values for persistency in Murrah buffaloes. M.Sc. Thesis, National Dairy Research Institute, Karnal, Haryana, India, 2005.
- Ghavi Zadeh HN. Comparison of non-linear models to describe the lactation curves for milk yield and composition in buffaloes (Bubalus bubalis). Animal. 2016;10(2):248-61.
- Gupta JP. Evolving selection criteria using growth and production traits in Murrah buffaloes. M.V.Sc. Thesis, NDRI (Deemed University), Karnal, Haryana, India; 2009.
- Hassan FA, Ali MA, Tarabany ELMS. Economic impacts of calving season and parity on reproduction and production traits of buffaloes in the sub-tropics. Environmental Science and Pollution Research. 2017;24(11):10258-66.
- Horan B, Dillon P, Berry DP, Connor PO, Rath M. The effect of strain of Holstein-Friesian feeding system and parity on lactation curves characteristics of spring calving dairy cows. Livestock Production Science. 2005;95(3):231-41.
- Ipe S, Nagarcenkar R. Estimation of heritabilities and correlations of partial and 300 days first lactation milk yield in Murrah buffaloes. Journal of Dairying, Foods and Home Sciences. 1992;11:43-9.
- Jakhar V, Yadav AS, Dhaka SS. Analysis of different non-genetic factors on production performance traits in Murrah buffaloes. International Journal of Current Microbiology and Applied Sciences. 2017;6(12):426-72.
- Jamuna V, Chakravarty AK, Patil CS. Influence of nongenetic factors on performance traits in Murrah buffaloes. Indian Journal of Animal Research. 2015;49(3):279-83.
- Jamuna V. Impact of progeny testing programme on lifetime fertility and lifetime milk yield in Murrah buffaloes. M.V.Sc. Thesis, NDRI (Deemed University), Karnal, Haryana, India, 2012.
- Kamble SS, Chauhan DS, Bhise BR. Impact of climatic parameters on milk production in Murrah buffaloes. Journal of Crop and Weed. 2014;10:71-6.
- Katneni VK. Studies on genetic persistency of milk production in Murrah buffaloes. Ph.D. Thesis, NDRI (Deemed University), Karnal, Haryana, India, 2007.
- Kong LN, Li JB, Li RL, Zhao XX, Ma YB, Sun SH, et al. Estimation of 305-day milk yield from test-day records of Chinese Holstein cattle. Journal of Applied Animal Research. 2018;46(1):791-7.
- Kumar A, Gupta JP, Kaswan S, Lathwal SS. Non-genetic factors influencing monthly test day milk yield records in Murrah buffaloes. Indian Journal of Field Veterinarians. 2012;8(1):41-3.
- Kumar D, Singh H, Singh CV. Non-genetic factors affecting some production and reproduction traits in Murrah buffaloes. Indian Journal of Animal Research. 2003;37(1):24-7.
- Kumar S. A comparative study of lactation curve models for prediction of lactation milk yield in Murrah buffaloes. M.V.Sc. Thesis, NDRI (Deemed University), Karnal, Haryana, India, 2007.
- Lathwal SS. Optimum levels of economic traits for maximizing the profit function in Murrah buffaloes. Ph.D. Thesis, NDRI (Deemed University), Karnal, Haryana, India, 2000.
- Velarde LCU, McMillan I, Gentry RD, Wilton JW. Models for estimating typical lactation curves in dairy cattle. Journal of Animal Breeding and Genetics. 1995;112(5-6):333-40.
- Macciotta NPP, Vicario D, Borlino CA. Detection of different shapes of lactation curve for milk yield in dairy cattle by empirical mathematical models. Journal of Dairy Science. 2005;88:1178-91.
- Mehto L, Kaushik SN, Koul GL. Influence of various factors on components of gamma-type function of a lactation curve in Hariana cross-breds. Indian Journal of Animal Sciences. 1980;50(7):538-41.
- Mire R, Bhonsle D, Mishra S, Singh M, Pathak R. Effect of genetic and non-genetic factors on production performance of Sahiwal cows. International Journal of Agriculture Sciences. 2019;11(10):8485-7.
- Mohanty BS, Verma M, Singh S, Sharma VB, Kumar S, Bardhan D, et al. Modeling of lactation curves of Red Sindhi dairy cows. Indian Journal of Animal Sciences. 2017;87(10):1278-81.
- Narwaria US, Lathwal SS, Verma KK. Non-genetic factors affecting milk production traits of Sahiwal cattle at organized dairy herd. Indian Journal of Animal Production and Management. 2017;33(1-2):86-90.
- Nath M. Evaluation of breeding value in Murrah buffaloes by various methods. M.Sc. Thesis, NDRI (Deemed University), Karnal, Haryana, India, 1996.
- Olori VE, Brotherstone S, Hill WG, McGuirk BJ. Fit of standard models of the lactation curve to weekly records of milk production of cows in a single herd. Livestock Production Science. 1999;58(1):55-63.
- Pander BL, Manjeet, Kamaldeep, Sharma R, Dev K, Dhaka SS, Magotra A. Estimates of genetic parameters of first lactation traits in crossbreed hard henu (Bos taurus x Bos indicus) cattle. International Journal of Agricultural Science and Research. 2017;7(6):253-8.
- Pandey M, Raja KN, Yousuf S, Gupta AK. Effect of nongenetic factors on first lactation 305 days and lifetime milk yield in Sahiwal cattle. Indian Journal of Dairy Science. 2019;72(1):89-92.
- Pareek NK, Narang R. Effect of non-genetic factors on persistency and milk production traits in Murrah buffaloes. Journal of Animal Research. 2015;5(3):493-5.
- Parmar GA, Gupta JP, Chaudhari JD, Prajapati BM, Panchasara HH, Chauhan HD, et al. Estimation of genetic and non-genetic factors for test-day milk yield in Mehsana buffaloes. Indian Journal of Dairy Science. 2018;71(1):67-71.
- Pathodiya OP, Jain LS. Studies on first lactation ratio traits in Surti buffaloes. Indian Journal of Dairy Science. 2004;57(6):429-31.
- Patil CS, Chakravarty AK, Kumar V, Dongre VB, Kumar P. Non-genetic factors affecting first lactation reproductive traits in Murrah buffaloes. Indian Journal of Animal Research. 2011;45(3):205-7.
- Patro BN, Bhat PN. Effect of some non-genetic factors on production traits in Indian buffaloes. Gujarat Agricultural Universities Research Journal. 1979;18(1):90-5.
- Pawar HN, Kumar GVPPSR, Narang R. Effect of year, season and parity on milk production traits in Murrah buffaloes. Journal of Buffalo Science. 2012;1:122-5.
- Penchev P, Boichev M, Ilieva Y, Peeva TZ. Effect of different factors on lactation curve in buffalo cows. Slovak Journal of Animal Science. 2011;44(3):103-10.
- Rana J. Genetic evaluation of Murrah buffalo sires based on part lactation and test day milk yield records. Ph.D. Thesis, Choudhary Charan Singh University, Meerut, UP, India, 2008.
- Rao MK, Sundaresan D. Influence of environment and heredity on the shape of lactation curves in Sahiwal cows. Journal of Agricultural Science. 1979;92(2):393401.
- Rashia B. Genetic evaluation of lactation curve in Karan Fries cattle. Ph.D. Thesis, NDRI (Deemed University), Karnal, India, 2010.
- Saha S. Studies on breeding efficiency of buffaloes in Egypt. M.Sc. Thesis, Faculty of Agriculture, Tanta University, Kafr El-Sheik, Egypt, 1998.
- Sahana G. Association between productive and reproductive traits in Murrah buffaloes. M.Sc. Thesis, NDRI (Deemed University), Karnal, Haryana, India, 1993.
- Sahoo SK, Singh A, Dash SK, Ambhore GS. Modeling lactation curve for genetic evaluation of Murrah buffaloes. Indian Journal of Animal Research. 2018;52(12):1675-1679.
- Sahoo SK, Singh A, Gupta AK, Chakravarty AK, Ambhore GS, Dash SK. Comparative evaluation of different lactation curve functions for prediction of bimonthly test day milk yields in Murrah buffaloes. Animal Science. 2015;9(3):89-94.
- Sahoo SK, Singh A, Shivahre PR, Singh M, Dash S, Dash SK. Prediction of fortnightly test-day milk yields using four different lactation curve models in Indian Murrah buffalo. Advances in Animal and Veterinary Sciences. 2014;2(12):647-51.
- Sarkar U, Gupta AK, Mohanty TK, Raina VS, Prasad S. Genetic and non-genetic factors affecting milk yield and milk constituents in Murrah buffaloes. Journal of Dairying, Food and Home Science. 2006;25(2):125-128.
- Sigdel A, Bhattarai N, Kolachhapati MR, Paudyal S. Estimation of genetic parameters for productive traits of Murrah buffaloes in Kaski, Nepal. International Journal of Research. 2015;2(5):248-257.
- Singh B, Bhat PN. Models of lactation curves for Hariana cattle. Indian Journal of Animal Sciences. 1978;48(11):791-797.
- Singh CV, Yadav MC. Non-genetic factors affecting daily milk yield in Murrah buffaloes. Indian Journal of Animal Sciences. 1987;57(1):56-8.
- Singh M, Singh A, Gupta AK, Dash SK, Gupta A, Sahoo SK, et al. Comparative evaluation of different lactation curve models in prediction of monthly test-day milk yields in Murrah buffaloes. Journal of Animal Research. 2015;5(1):189-93.
- Singh M. Genetic analysis of test-day milk yields in Murrah buffaloes. M.V.Sc. Thesis, NDRI (Deemed University), Karnal, Haryana, India, 2014.
- Singh SS, Rathi SS, Sangwan ML. Environmental variances affecting production efficiency in Murrah buffaloes. Buffalo Journal. 1990;6:105-112.
- Sundaram M, Harharan G. Preliminary study on evaluation of effect of lactation number on milk yield and milk composition in Murrah (Bubalus bubalis) buffaloes. Research Journal of Animal, Veterinary and Fishery Science. 2013;1:21-3.
- Suresh R, Bidarkar DK, Gupta BR, Sudhakarrao B, Sudhakar K. Production and reproduction performance of Murrah buffaloes. Journal of Dairy Science. 2004;74(8):854-857.
- Tailor SP, Singh B. Genetic evaluation of sires using test day yield. Biometrics. 2011;20:818.
- Tekerli M, Akinci Z, Dogan I, Akcan A. Factors affecting the shape of lactation curves of Holstein cows from the Balikesir province of Turkey. Journal of Dairy Science. 2000;83(6):1381-6.
- Thiruvenkadan AK, Panneerselvam S, Murali N. Study on ages at first mating and calving of Murrah buffaloes in hot and humid climate of Tamil Nadu, India. Indian Journal of Animal Research. 2015;49(5):591-4.
- Thiruvenkadan AK, Panneerselvam S, Murali N, Selvam S, Saravanakumar VR. Milk production and reproduction performance of Murrah buffaloes of Tamil Nadu, India. Buffalo Bulletin. 2014;33(3):291-300.
- Thiruvenkadan AK, Panneerselvam S, Rajendran R, Murali N. Analysis on the productive and reproductive traits of Murrah buffalo cows maintained in the coastal region of India. Applied Animal Husbandry & Rural Development. 2010;3:1-5.
- Tomar SS, Tripathi VN. Standardization of data on lactation performance of Murrah buffaloes affected by various diseases. Indian Journal of Dairy Science. 1988;41:244-246.
- Vargas B, Koops WJ, Herrero M, Van Arendonk JA. Modeling extended lactations of dairy cows. Journal of Dairy Science. 2000;83(6):1371-80.
- Verma MK, Sachdeva GK, Yadav AK, Gautam S, Ali MM, Kumar S. Effect of genetic and non-genetic factors on milk yield and milk constituents in Murrah buffalo. Indian Journal of Animal Research. 2016;51(2):387-90.
- Wood PDP. Algebraic model of lactation curve in cattle. Nature. 1967;216:164.
- Yadav MC, Katpatal BG, Kaushik SN. Study of lactation curve in Hariana and its Friesian crosses. Indian Journal of Animal Sciences. 1977;47(10):607-9.
- Yadav MP, Katpatal BG, Kaushik SN. Components of inverse polynomial function of lactation curve and factors affecting them in Haryana and its Friesian crosses. Indian Journal of Animal Sciences. 1977;47(12):777-81.
- Yadav SBS, Sharma JS. Functions for lactation curves in crossbred dairy cattle. Indian Journal of Animal Sciences. 1985;55(1):42-47.