
Research article · 2025 · Full text
International Journal of Agriculture and Food ScienceEcological interactions in paddy fields: Population dynamics of natural enemies rove beetle in relation to weather parameters
Volume 7(2) · Pages 197–201 · DOI: 10.33545/2664844x.2025.v7.i2c.298 ↗
Research areasInsect-Plant Interactions and ControlForest Insect Ecology and ManagementInsect Resistance and Genetics
Abstract
Author-writtenThe present study investigates the population dynamics of rove beetle (Paederus fuscipes) in paddy fields across different locations during the Kharif seasons of 2022 and 2023. The study was conducted in Palpur, SHUATS, and Korsand to analyze the seasonal abundance of rove beetles and their correlation with weather parameters. Observations revealed that the rove beetle population first appeared in the 37th Standard Meteorological Week (SMW) and persisted until the 44th SMW. The beetle population, recorded in terms of beetles per hill and percentage beetle population, varied across locations and years. In Palpur, the population ranged from 0.56 (0.14%) to 0.97 (0.24%) in 2023 and from 0.60 (0.15%) to 1.07 (0.27%) in 2022, peaking in the 42nd SMW. Similar trends were recorded in SHUATS and Korsand, where the beetle population peaked during the third week of October before declining in early November. Weather parameters such as temperature, relative humidity, rainfall, wind velocity, and sunshine hours were analyzed for their influence on beetle populations. The pooled data from 2022 and 2023 indicated that the population increased with rising temperatures and sunshine hours while showing a decline with increasing rainfall and wind velocity. Correlation analysis revealed that rove beetle populations were positively correlated with evening relative humidity (r=0.515) and mean relative humidity (r=0.438), while negative correlations were observed with maximum temperature, mean temperature, rainfall, and wind velocity. The findings suggest that weather conditions play a crucial role in determining the population dynamics of rove beetles, influencing their role as natural enemies in rice ecosystems. Understanding these ecological interactions can contribute to the development of sustainable pest management strategies by enhancing the effectiveness of natural predators like rove beetles in controlling paddy insect pests.
Summary
Source-checkedPlain-language reading of the full paper, prepared with AI and checked against the text. Each point links to the authors' own words.
Why it matters
- Rice is a critical staple food crop globally, with about 90% of its production and consumption occurring in Asia. View evidence ↗
- Rice productivity is threatened by a vast array of biotic factors, including more than 1,400 reported insect pest species. View evidence ↗
- Heavy reliance on chemical insecticides for pest control has caused environmental issues and pest resistance, creating a need for sustainable ecological alternatives. View evidence ↗
The question
- The study aimed to analyze how the populations of natural enemies, specifically spiders and rove beetles, change over time in rice ecosystems and how these dynamics relate to weather factors. View evidence ↗
What they did
- The research took place across the Kharif seasons of 2022 and 2023 at three sites: Palpur, Korsand, and the SHUATS Central Research Farm. View evidence ↗
- To monitor insect populations, the researchers established 100 m² bulk plots of paddy at each study location. View evidence ↗
- Weekly population assessments were conducted by counting insects on ten randomly selected rice hills from plots adjacent to the main trial field. View evidence ↗
- The researchers analyzed the correlation between insect populations and weather data, including rainfall, wind speed, sunshine hours, relative humidity, and various temperature measurements. View evidence ↗
What they found
- Rove beetle populations were first observed in the 37th Standard Meteorological Week (SMW) and remained present until the 44th SMW. View evidence ↗
- In Palpur, rove beetle density peaked in the 42nd SMW, ranging from 0.60 (0.15%) to 1.07 (0.27%) in 2022 and 0.56 (0.14%) to 0.97 (0.24%) in 2023. View evidence ↗
- At SHUATS, beetle populations peaked in mid-October (or the 42nd SMW in 2023), with densities between 0.65 (0.16%) and 0.88 (0.22%) in 2022 and 0.40 (0.10%) to 0.83 (0.21%) in 2023. View evidence ↗
- At Korsand, populations peaked in mid-October (or the 42nd SMW in 2023), with densities ranging from 0.76 (0.19%) to 1.25 (0.31%) in 2022 and 0.72 (0.18%) to 1.17 (0.29%) in 2023. View evidence ↗
- Pooled data showed that rove beetle populations had a positive correlation with mean relative humidity (r=0.438) and evening relative humidity (r=0.515), but a negative correlation with rainfall, wind velocity, mean temperature, and maximum temperature. View evidence ↗
- Analysis of pooled data from both years indicated that beetle populations increased as sunshine hours and temperatures rose, but decreased as wind velocity and rainfall increased. View evidence ↗
What it means
- The authors conclude that rove beetles are effective natural enemies and are important for integrated pest management strategies in rice ecosystems. View evidence ↗
- The authors recommend reducing pesticide use and implementing habitat management to conserve these natural enemies and promote sustainable pest control. View evidence ↗
Visual summary
1 visualsIllustrations explain the paper; they do not show study data.
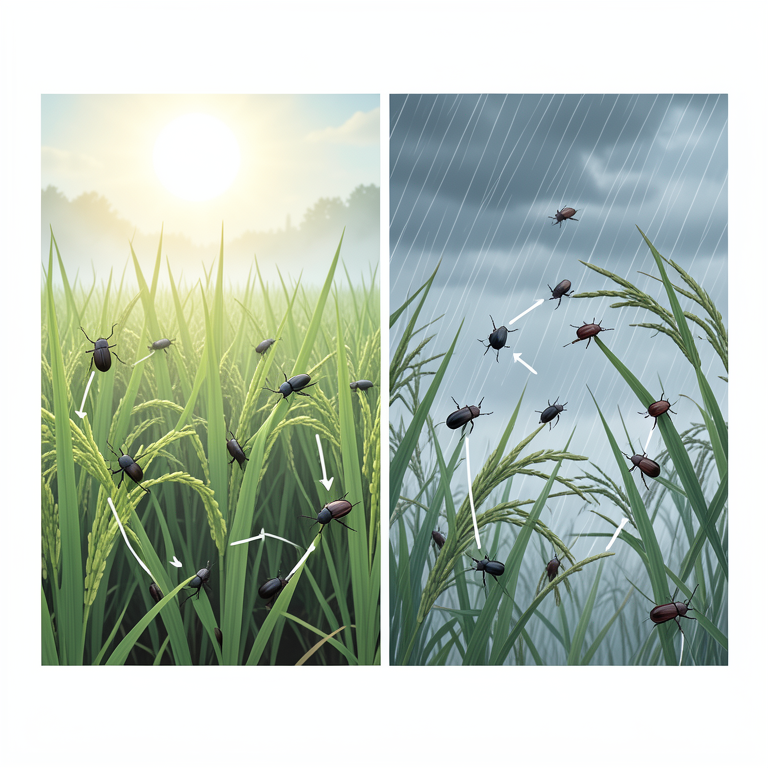
Weather Influence on Rove Beetles
AI-generated conceptual illustration (rove beetles in a paddy field). It explains the idea and does not show study data.
View source evidence ↗Figures & tables
From the original paper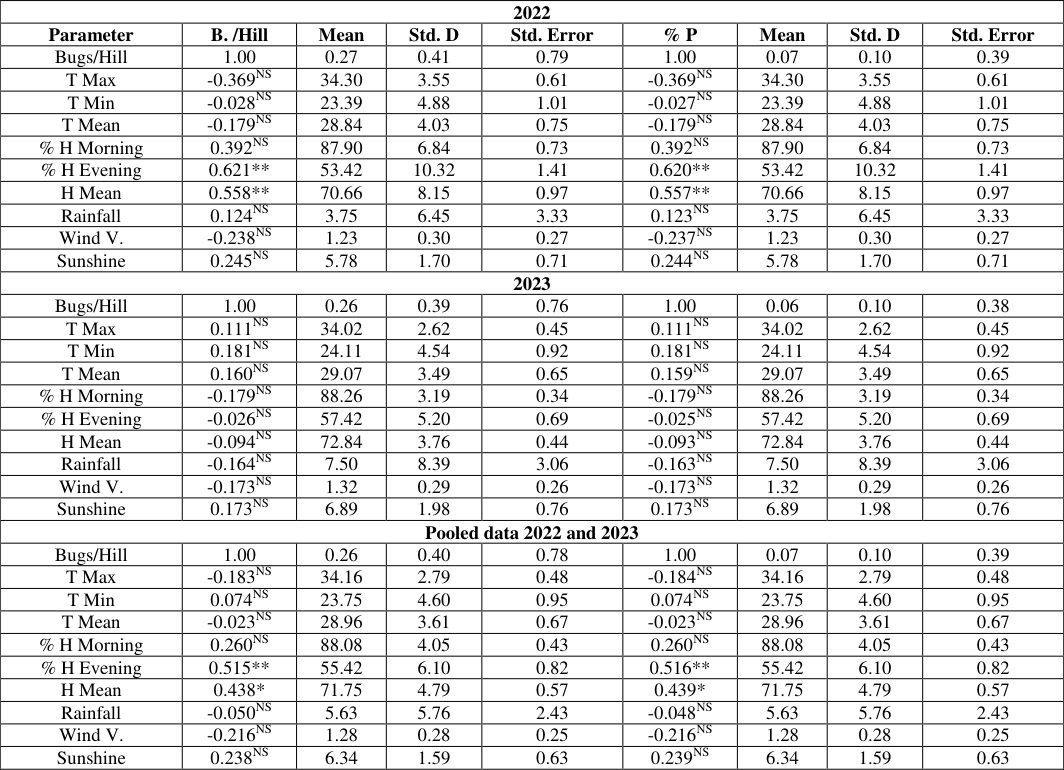 Table 1
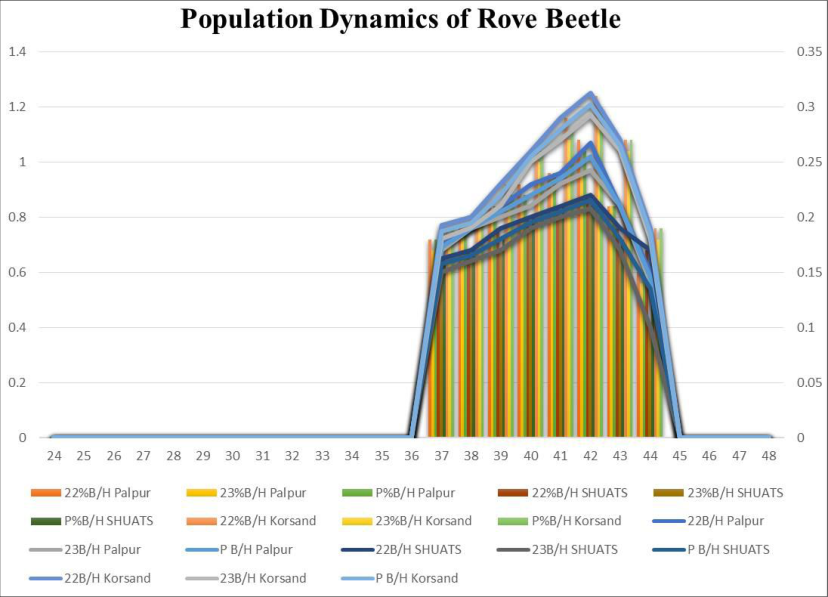 Figure 1
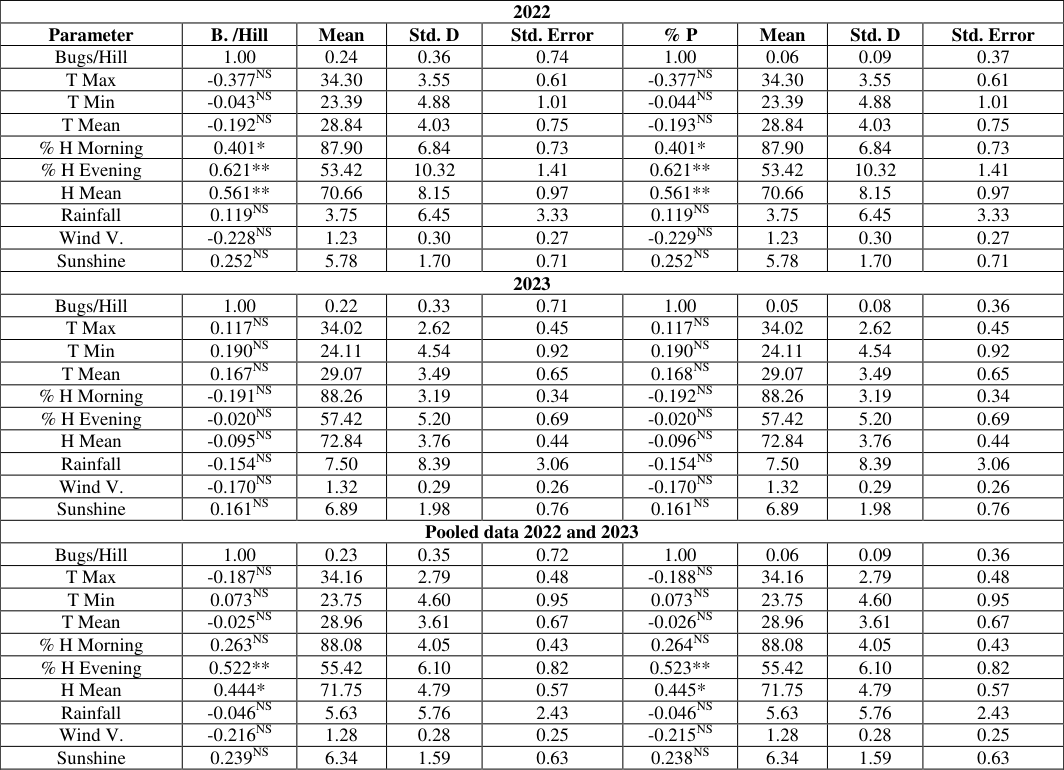 Table 2
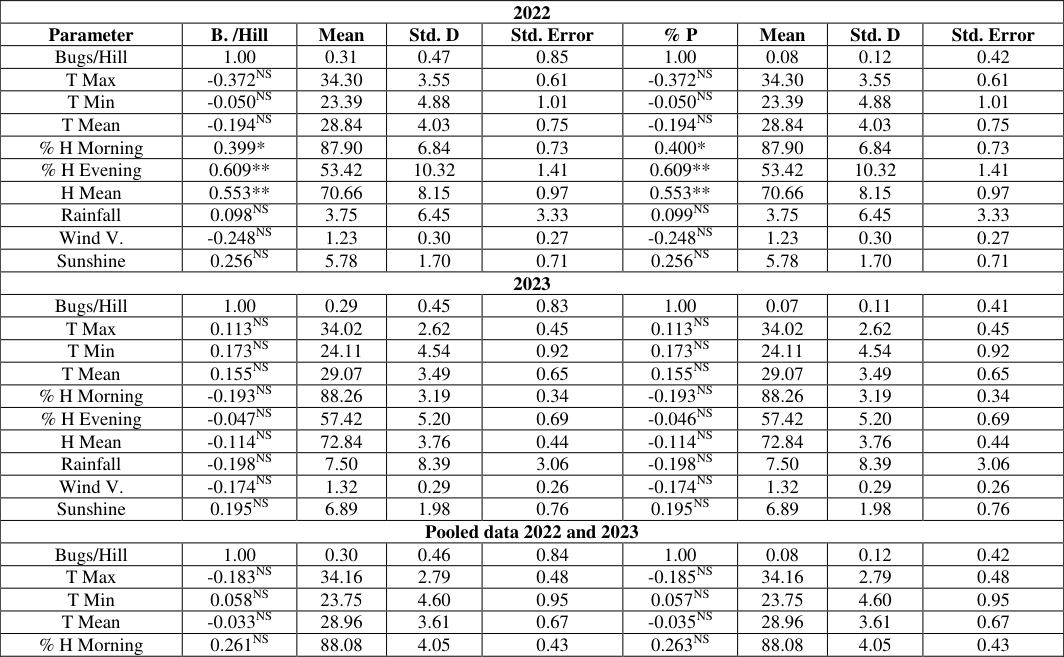 Table 3
Introduction
Rice (Oryza sativa L.) is one of the most important staple food crops, supporting the livelihood and food security of millions of people worldwide, particularly in Asia, where approximately 90% of global rice is grown and consumed (Pathak et al., 2002) [10] . The productivity of rice is significantly affected by various biotic and abiotic factors, with insect pests posing a major challenge. Over 1400 insect species have been reported to attack rice at different growth stages (Grist and Lever, 1969) [5] , and their management is crucial for sustainable rice production. Climate change, along with agronomic interventions such as crop diversity, irrigation, fertilization, and pesticide application, has significantly influenced the intensity and severity of pest infestations and their natural enemies in rice ecosystems (Way and Heong, 1994; Ooi and Shephard, 1994) [15,9] . Conventional pest management strategies rely heavily on chemical insecticides, leading to environmental concerns, pest resistance, and adverse effects on non-target beneficial organisms, necessitating the adoption of ecologically sustainable alternatives (Gurr et al., 2016) [6] . Natural enemies, including predatory beetles and spiders, play a critical role in regulating pest populations in rice fields. Among these, rove beetles (Paederus fuscipes) and various spider species have gained attention for their potential as biological control agents (Meena et al., 2019) [8] . Their population dynamics are largely influenced by abiotic factors such as temperature, humidity, and rainfall (Dhurva and Soni, 2020) [4] . However, despite their significance in integrated pest management (IPM), there is a lack of comprehensive studies documenting the seasonal incidence and environmental factors affecting these beneficial arthropods. Previous research has primarily focused on pest attraction to light traps, with limited data available on the light trap collection of natural enemies such as predatory beetles and spiders (Atwal et al., 1969; De Bach, 1974; Sharma et al., 2010) [1,3,13] . Given their importance in sustainable agriculture, understanding the population trends of these predators and their correlation with weather parameters is crucial for improving biological pest control measures. Light traps have long been used as an indigenous and eco-friendly pest monitoring tool in rice ecosystems, capturing a diverse range of phototactic insects, including pest species and their natural enemies (Hufnagel et al., 2008) [7] . The efficiency of light traps in assessing insect biodiversity has been demonstrated in various studies, though their role in monitoring the population dynamics of predatory arthropods remains underexplored. Limited research has examined the diversity and seasonal abundance of natural enemies in rice fields, particularly in high-altitude rainfed ecosystems, where insect populations are influenced by unique climatic conditions (Bhattacharyya et al., 2006; Pathak et al., 2014) [11] . Therefore, there is a pressing need to document the diversity and seasonal trends of insect natural enemies to enhance conservation efforts and optimize their use in pest management strategies. The present study aims to analyze the population dynamics of natural enemies, particularly rove beetles and spiders, in rice agroecosystems and assess their relationship with key abiotic factors such as temperature, humidity, rainfall, and sunshine hours. By utilizing light traps and field surveys, this research seeks to provide a comprehensive understanding of the seasonal incidence of these beneficial predators and their potential in sustainable rice pest management. The findings will contribute to biodiversity conservation and integrated pest management efforts, ensuring a balanced approach to pest control while minimizing environmental risks.
Materials and Methods
This study aimed to assess the population dynamics of major insect pests, with a focus on rove beetles and spiders, in relation to climatic factors affecting rice ecosystems. The research was conducted during the Kharif seasons of 2022 and 2023 at three locations: Palpur, SHUATS, Central Research Farm, and Korsand. At each location, a bulk plot of 100 m² of paddy was established to monitor the seasonal build-up of insect pest populations. To assess pest populations, experimented on randomly selected ten hills from adjacent paddy plots surrounding the main trial field each week. They counted the insect pests on these hills and calculated the average population per ten hills to determine seasonal incidence. Rove beetles and other insect pests were regularly monitored to understand their population dynamics and biological control potential. In addition to pest population assessment, observation recorded insect pest damage to the rice crop weekly. They correlated this data with meteorological parameters, including maximum and minimum temperatures, mean temperature, relative humidity, sunshine hours, wind speed, and rainfall. Meteorological data were collected from the Department of Meteorology's observatory at SHUATS, Prayagraj. The correlation between weather parameters and the occurrence, population dynamics, and damage caused by both pest species and beneficial insects, such as rove beetles, was analyzed to determine the impact of climatic factors on pest management in rice.
Results and Discussion Population Dynamics of Rove Beetle (Paederus fuscipes) in Kharif Season Palpur, Tehsil: Karchhana (Kharif 2022 & 2023)
The rove beetle population first appeared in the 37 th (SMW) and persisted until the 44 th SMW in both years. During Kharif 2023, beetle density ranged from 0.56 (0.14%) to 0.97 (0.24%), peaking in the third week of October (42 nd SMW) before declining in early November (44 th SMW). Weather parameters during this period varied: temperature (25.89°C to 35.46°C), relative humidity (54.29% to 85.14%), rainfall (1.57 mm/day), wind velocity (1.25 km/hr), and sunshine hours (7.34 hr/day). In Kharif 2022, beetle density varied between 0.60 (0.15%) and 1.07 (0.27%), also peaking in the third week of October. The weather ranged as follows: temperature (21.20°C to 32.09°C), relative humidity (58.00% to 92.43%), rainfall (0.00 mm/day), wind velocity (1.03 km/hr), and sunshine hours (7.49 hr/day). Correlation analysis revealed a positive association with evening relative humidity (H min = 0.621) and mean relative humidity (H mean = 0.558) in 2022, while in 2023, positive correlations were observed with temperature and sunshine hours but negative with relative humidity, rainfall, and wind velocity. Pooled data analysis confirmed similar trends (Table 1). SHUATS, Naini, Tehsil: Salempur (Kharif 2022 & 2023). In 2023, the rove beetle population ranged from 0.40 (0.10%) to 0.83 (0.21%), peaking during the 42 nd SMW, with a decline from the 44 th SMW. Weather conditions included temperatures between 25.89°C and 35.46°C, relative humidity from 54.29% to 85.14%, rainfall at 1.57 mm/day, wind velocity of 1.25 km/hr, and 7.34 sunshine hours per day. For Kharif 2022, population density ranged from 0.65 (0.16%) to 0.88 (0.22%), peaking in mid-October. Weather parameters were: temperature (21.20°C to 32.09°C), relative humidity (58.00% to 92.43%), rainfall (0.00 mm/day), wind velocity (1.03 km/hr), and sunshine hours (7.49 hr/day). Correlation analysis for 2022 indicated a strong positive relationship with relative humidity and sunshine hours, while in 2023, temperature showed a stronger positive correlation. Pooled data reaffirmed the significant influence of evening relative humidity (H min = 0.522) and sunshine hours on beetle population (Table 2). Korsand, Tehsil: Soraon (Kharif 2022 & 2023). In 2023, the beetle population varied from 0.72 (0.18%) to 1.17 (0.29%), reaching its peak in the 42 nd SMW. Weather conditions during this period included temperatures of 25.89°C to 35.46°C, relative humidity of 54.29% to 85.14%, rainfall of 1.57 mm/day, wind velocity of 1.25 km/hr, and sunshine hours of 7.34 hr/day. During Kharif 2022, the population ranged from 0.76 (0.19%) to 1.25 (0.31%), peaking in mid-October. The weather conditions recorded were temperature (21.20°C to 32.09°C), relative humidity (58.00% to 92.43%), no recorded rainfall, wind velocity of 1.03 km/hr, and 7.49 sunshine hours per day. Correlation analysis highlighted a strong positive correlation with relative humidity in 2022, whereas in 2023, temperature and sunshine hours showed stronger associations. The pooled data validated these findings, with evening relative humidity (H min = 0.495) and sunshine hours significantly influencing the population dynamics (Table 3).
| 2022 | — | — | — | — | — | — | — | — |
|---|---|---|---|---|---|---|---|---|
| Parameter | B. /Hill | Mean | Std. D | Std. Error | % P | Mean | Std. D | Std. Error |
| Bugs/Hill | 1.00 | 0.31 | 0.47 | 0.85 | 1.00 | 0.08 | 0.12 | 0.42 |
| T Max | -0.372NS | 34.30 | 3.55 | 0.61 | -0.372NS | 34.30 | 3.55 | 0.61 |
| T Min | -0.050NS | 23.39 | 4.88 | 1.01 | -0.050NS | 23.39 | 4.88 | 1.01 |
| T Mean | -0.194NS | 28.84 | 4.03 | 0.75 | -0.194NS | 28.84 | 4.03 | 0.75 |
| % H Morning | 0.399* | 87.90 | 6.84 | 0.73 | 0.400* | 87.90 | 6.84 | 0.73 |
| % H Evening | 0.609** | 53.42 | 10.32 | 1.41 | 0.609** | 53.42 | 10.32 | 1.41 |
| H Mean | 0.553** | 70.66 | 8.15 | 0.97 | 0.553** | 70.66 | 8.15 | 0.97 |
| Rainfall | 0.098NS | 3.75 | 6.45 | 3.33 | 0.099NS | 3.75 | 6.45 | 3.33 |
| Wind V. | -0.248NS | 1.23 | 0.30 | 0.27 | -0.248NS | 1.23 | 0.30 | 0.27 |
| Sunshine | 0.256NS | 5.78 | 1.70 | 0.71 | 0.256NS | 5.78 | 1.70 | 0.71 |
| 2023 | ||||||||
| Bugs/Hill | 1.00 | 0.29 | 0.45 | 0.83 | 1.00 | 0.07 | 0.11 | 0.41 |
| T Max | 0.113NS | 34.02 | 2.62 | 0.45 | 0.113NS | 34.02 | 2.62 | 0.45 |
| T Min | 0.173NS | 24.11 | 4.54 | 0.92 | 0.173NS | 24.11 | 4.54 | 0.92 |
| T Mean | 0.155NS | 29.07 | 3.49 | 0.65 | 0.155NS | 29.07 | 3.49 | 0.65 |
| % H Morning | -0.193NS | 88.26 | 3.19 | 0.34 | -0.193NS | 88.26 | 3.19 | 0.34 |
| % H Evening | -0.047NS | 57.42 | 5.20 | 0.69 | -0.046NS | 57.42 | 5.20 | 0.69 |
| H Mean | -0.114NS | 72.84 | 3.76 | 0.44 | -0.114NS | 72.84 | 3.76 | 0.44 |
| Rainfall | -0.198NS | 7.50 | 8.39 | 3.06 | -0.198NS | 7.50 | 8.39 | 3.06 |
| Wind V. | -0.174NS | 1.32 | 0.29 | 0.26 | -0.174NS | 1.32 | 0.29 | 0.26 |
| Sunshine | 0.195NS | 6.89 | 1.98 | 0.76 | 0.195NS | 6.89 | 1.98 | 0.76 |
| Pooled data 2022 and 2023 | ||||||||
| Bugs/Hill | 1.00 | 0.30 | 0.46 | 0.84 | 1.00 | 0.08 | 0.12 | 0.42 |
| T Max | -0.183NS | 34.16 | 2.79 | 0.48 | -0.185NS | 34.16 | 2.79 | 0.48 |
| T Min | 0.058NS | 23.75 | 4.60 | 0.95 | 0.057NS | 23.75 | 4.60 | 0.95 |
| T Mean | -0.033NS | 28.96 | 3.61 | 0.67 | -0.035NS | 28.96 | 3.61 | 0.67 |
| % H Morning | 0.261NS | 88.08 | 4.05 | 0.43 | 0.263NS | 88.08 | 4.05 | 0.43 |
Table text extracted from the original PDF; superscript letters are shown inline. The original table image is below.
View original table image
| 2022 | — | — | — | — | — | — | — | — |
|---|---|---|---|---|---|---|---|---|
| Parameter | B. /Hill | Mean | Std. D | Std. Error | % P | Mean | Std. D | Std. Error |
| Bugs/Hill | 1.00 | 0.24 | 0.36 | 0.74 | 1.00 | 0.06 | 0.09 | 0.37 |
| T Max | -0.377NS | 34.30 | 3.55 | 0.61 | -0.377NS | 34.30 | 3.55 | 0.61 |
| T Min | -0.043NS | 23.39 | 4.88 | 1.01 | -0.044NS | 23.39 | 4.88 | 1.01 |
| T Mean | -0.192NS | 28.84 | 4.03 | 0.75 | -0.193NS | 28.84 | 4.03 | 0.75 |
| % H Morning | 0.401* | 87.90 | 6.84 | 0.73 | 0.401* | 87.90 | 6.84 | 0.73 |
| % H Evening | 0.621** | 53.42 | 10.32 | 1.41 | 0.621** | 53.42 | 10.32 | 1.41 |
| H Mean | 0.561** | 70.66 | 8.15 | 0.97 | 0.561** | 70.66 | 8.15 | 0.97 |
| Rainfall | 0.119NS | 3.75 | 6.45 | 3.33 | 0.119NS | 3.75 | 6.45 | 3.33 |
| Wind V. | -0.228NS | 1.23 | 0.30 | 0.27 | -0.229NS | 1.23 | 0.30 | 0.27 |
| Sunshine | 0.252NS | 5.78 | 1.70 | 0.71 | 0.252NS | 5.78 | 1.70 | 0.71 |
| 2023 | ||||||||
| Bugs/Hill | 1.00 | 0.22 | 0.33 | 0.71 | 1.00 | 0.05 | 0.08 | 0.36 |
| T Max | 0.117NS | 34.02 | 2.62 | 0.45 | 0.117NS | 34.02 | 2.62 | 0.45 |
| T Min | 0.190NS | 24.11 | 4.54 | 0.92 | 0.190NS | 24.11 | 4.54 | 0.92 |
| T Mean | 0.167NS | 29.07 | 3.49 | 0.65 | 0.168NS | 29.07 | 3.49 | 0.65 |
| % H Morning | -0.191NS | 88.26 | 3.19 | 0.34 | -0.192NS | 88.26 | 3.19 | 0.34 |
| % H Evening | -0.020NS | 57.42 | 5.20 | 0.69 | -0.020NS | 57.42 | 5.20 | 0.69 |
| H Mean | -0.095NS | 72.84 | 3.76 | 0.44 | -0.096NS | 72.84 | 3.76 | 0.44 |
| Rainfall | -0.154NS | 7.50 | 8.39 | 3.06 | -0.154NS | 7.50 | 8.39 | 3.06 |
| Wind V. | -0.170NS | 1.32 | 0.29 | 0.26 | -0.170NS | 1.32 | 0.29 | 0.26 |
| Sunshine | 0.161NS | 6.89 | 1.98 | 0.76 | 0.161NS | 6.89 | 1.98 | 0.76 |
| Pooled data 2022 and 2023 | ||||||||
| Bugs/Hill | 1.00 | 0.23 | 0.35 | 0.72 | 1.00 | 0.06 | 0.09 | 0.36 |
| T Max | -0.187NS | 34.16 | 2.79 | 0.48 | -0.188NS | 34.16 | 2.79 | 0.48 |
| T Min | 0.073NS | 23.75 | 4.60 | 0.95 | 0.073NS | 23.75 | 4.60 | 0.95 |
| T Mean | -0.025NS | 28.96 | 3.61 | 0.67 | -0.026NS | 28.96 | 3.61 | 0.67 |
| % H Morning | 0.263NS | 88.08 | 4.05 | 0.43 | 0.264NS | 88.08 | 4.05 | 0.43 |
| % H Evening | 0.522** | 55.42 | 6.10 | 0.82 | 0.523** | 55.42 | 6.10 | 0.82 |
| H Mean | 0.444* | 71.75 | 4.79 | 0.57 | 0.445* | 71.75 | 4.79 | 0.57 |
| Rainfall | -0.046NS | 5.63 | 5.76 | 2.43 | -0.046NS | 5.63 | 5.76 | 2.43 |
| Wind V. | -0.216NS | 1.28 | 0.28 | 0.25 | -0.215NS | 1.28 | 0.28 | 0.25 |
| Sunshine | 0.239NS | 6.34 | 1.59 | 0.63 | 0.238NS | 6.34 | 1.59 | 0.63 |
Table text extracted from the original PDF; superscript letters are shown inline. The original table image is below.
View original table image
| 2022 | — | — | — | — | — | — | — | — |
|---|---|---|---|---|---|---|---|---|
| Parameter | B. /Hill | Mean | Std. D | Std. Error | % P | Mean | Std. D | Std. Error |
| Bugs/Hill | 1.00 | 0.27 | 0.41 | 0.79 | 1.00 | 0.07 | 0.10 | 0.39 |
| T Max | -0.369NS | 34.30 | 3.55 | 0.61 | -0.369NS | 34.30 | 3.55 | 0.61 |
| T Min | -0.028NS | 23.39 | 4.88 | 1.01 | -0.027NS | 23.39 | 4.88 | 1.01 |
| T Mean | -0.179NS | 28.84 | 4.03 | 0.75 | -0.179NS | 28.84 | 4.03 | 0.75 |
| % H Morning | 0.392NS | 87.90 | 6.84 | 0.73 | 0.392NS | 87.90 | 6.84 | 0.73 |
| % H Evening | 0.621** | 53.42 | 10.32 | 1.41 | 0.620** | 53.42 | 10.32 | 1.41 |
| H Mean | 0.558** | 70.66 | 8.15 | 0.97 | 0.557** | 70.66 | 8.15 | 0.97 |
| Rainfall | 0.124NS | 3.75 | 6.45 | 3.33 | 0.123NS | 3.75 | 6.45 | 3.33 |
| Wind V. | -0.238NS | 1.23 | 0.30 | 0.27 | -0.237NS | 1.23 | 0.30 | 0.27 |
| Sunshine | 0.245NS | 5.78 | 1.70 | 0.71 | 0.244NS | 5.78 | 1.70 | 0.71 |
| 2023 | ||||||||
| Bugs/Hill | 1.00 | 0.26 | 0.39 | 0.76 | 1.00 | 0.06 | 0.10 | 0.38 |
| T Max | 0.111NS | 34.02 | 2.62 | 0.45 | 0.111NS | 34.02 | 2.62 | 0.45 |
| T Min | 0.181NS | 24.11 | 4.54 | 0.92 | 0.181NS | 24.11 | 4.54 | 0.92 |
| T Mean | 0.160NS | 29.07 | 3.49 | 0.65 | 0.159NS | 29.07 | 3.49 | 0.65 |
| % H Morning | -0.179NS | 88.26 | 3.19 | 0.34 | -0.179NS | 88.26 | 3.19 | 0.34 |
| % H Evening | -0.026NS | 57.42 | 5.20 | 0.69 | -0.025NS | 57.42 | 5.20 | 0.69 |
| H Mean | -0.094NS | 72.84 | 3.76 | 0.44 | -0.093NS | 72.84 | 3.76 | 0.44 |
| Rainfall | -0.164NS | 7.50 | 8.39 | 3.06 | -0.163NS | 7.50 | 8.39 | 3.06 |
| Wind V. | -0.173NS | 1.32 | 0.29 | 0.26 | -0.173NS | 1.32 | 0.29 | 0.26 |
| Sunshine | 0.173NS | 6.89 | 1.98 | 0.76 | 0.173NS | 6.89 | 1.98 | 0.76 |
| Pooled data 2022 and 2023 | ||||||||
| Bugs/Hill | 1.00 | 0.26 | 0.40 | 0.78 | 1.00 | 0.07 | 0.10 | 0.39 |
| T Max | -0.183NS | 34.16 | 2.79 | 0.48 | -0.184NS | 34.16 | 2.79 | 0.48 |
| T Min | 0.074NS | 23.75 | 4.60 | 0.95 | 0.074NS | 23.75 | 4.60 | 0.95 |
| T Mean | -0.023NS | 28.96 | 3.61 | 0.67 | -0.023NS | 28.96 | 3.61 | 0.67 |
| % H Morning | 0.260NS | 88.08 | 4.05 | 0.43 | 0.260NS | 88.08 | 4.05 | 0.43 |
| % H Evening | 0.515** | 55.42 | 6.10 | 0.82 | 0.516** | 55.42 | 6.10 | 0.82 |
| H Mean | 0.438* | 71.75 | 4.79 | 0.57 | 0.439* | 71.75 | 4.79 | 0.57 |
| Rainfall | -0.050NS | 5.63 | 5.76 | 2.43 | -0.048NS | 5.63 | 5.76 | 2.43 |
| Wind V. | -0.216NS | 1.28 | 0.28 | 0.25 | -0.216NS | 1.28 | 0.28 | 0.25 |
| Sunshine | 0.238NS | 6.34 | 1.59 | 0.63 | 0.239NS | 6.34 | 1.59 | 0.63 |
Table text extracted from the original PDF; superscript letters are shown inline. The original table image is below.
View original table image
Conclusion
The study revealed that the population dynamics of rove beetles (Paederus fuscipes) were significantly influenced by environmental factors such as temperature, relative humidity, rainfall, wind velocity, and sunshine hours. Peak population activity was observed in the third week of October, followed by a decline in early November. The findings underscore the importance of rove beetles as effective natural enemies in integrated pest management (IPM) strategies, particularly in rice ecosystems. The significant correlations observed between beetle populations and key weather parameters further highlight their role in regulating pest populations. Encouraging the conservation of these natural enemies through habitat management and reduced pesticide usage can enhance sustainable pest control, reducing reliance on chemical interventions and promoting ecological balance.
Acknowledgement
AcknowledgmentsWe gratefully acknowledge the financial support provided for this research through the Mahatma Jyotiba Phule Research Fellowship (MJPRF) scheme granted by the Autonomous Institute of the Other Backward Class Bahujan Welfare Department, Government of Maharashtra, India. Also, thankful to SHUATS, Prayagraj, U.P. for providing all the essential facilities, No conflict of interests.
Figures and tables from the paper
References
12 in the original paper- Atwal AS, Choudhary JP, Ramjan M. Studies on the seasonal abundance of insects on light trap at Ludhiana. J Res Agric Univ. 1969;6:186-196.
- Bhattacharyya B, Basit A, Saikia DK. Parasitoids and predators of rice insect pests of Jorhat district of Assam. J Biol Control. 2006;20(1):37-44.
- De Bach P. Biological control by natural enemies. Cambridge: Cambridge University Press; 1974. p. 323.
- Dhurva D, Soni R. Influence of climatic factors on population dynamics of insect pests and their natural enemies in rice ecosystem. J Entomol Res. 2020;44(3):445-453.
- Grist DH, Lever RJ. Pests of rice. London: Longmans, Green; 1969.
- Gurr GM, Lu Z, Zheng X, Xu H, Zhu P, Chen G, Heong KL. Multi-country evidence that crop diversification promotes ecological intensification of agriculture. Nat Plants. 2016;2(3):16014.
- Meena SC, Sharma RK, Singh G. Role of predatory beetles in rice pest management: An ecological approach. Int J Pest Manag. 2019;65(2):98-105.
- Pathak M, Garg DK, Jeswani MD, Singh RN. Farmers participatory IPM in Basmati rice at Sarurpur-A case study. Ann Pl Protec Sci. 2002;10(2):386-388.
- Pathak M, Riba T, Shakywar RC, Sah D, Mishra BP, Singh MP. Rice ecosystem and their integrated management. In: 7th National Extension Education Congress-2014, Translational Research Extension for Sustainable Small Farm Development; 2014 Nov 0811; ICAR Complex for NEH Region, Umiam, Meghalaya; c2014. p. 103.
- Sharma AK, Barche S, Mishra PK. Pest and predatory insect species inhabiting paddy ecosystem in Jabalpur, Madhya Pradesh collected with the help of light traps. Pest Manag Econ Zool. 2010;18(12):125-133.
- Vinoth Kumar R. Seasonal abundance and biological control potential of rove beetles in rice ecosystems. Asian J Agric Sci. 2014;6(2):80-86.
- Way MJ, Heong KL. The role of biodiversity in the dynamics and management of insect pests of tropical irrigated rice -a review. Bull Entomol Res. 1994;86:567-587.