
Research article · 2023 · Full text
International Journal of Agriculture and NutritionZinc biofortified maize (Zea mays L.) grain production strategy on the Rhodic Ferralsol of Southern Togo
Volume 5(2) · Pages 45–53 · DOI: 10.33545/26646064.2023.v5.i2a.130 ↗
Research areasAgriculture and Rural Development Research
Abstract
Author-writtenMicronutrient deficiency is a major strain to increasing food production and a global concern for human nutrition. To help meet this challenge, a study was carried out over two consecutive years (2020 and 2021) at the University of Lome Agronomic Experiments Station with the aim to increase productivity and zinc content in maize grains. The experiment was set up in a split-plot design composed of twelve (12) treatments in three replications. Four maize varieties (V1 = Ikenne, V2 = Tzee, V3 = Sotubaka and V4 = Sammaz 52), and three zinc doses (Zn0 = 0 kg ha-1; Zn45 = 3.75 kg ha-1 and Zn60 = 5 kg ha-1 of ZinGap at 12% Zn) were used for this experiment. Yields and grain zinc concentration were determined. The results showed that maize grain yield and zinc concentration in maize grain were significantly influenced by varieties and zinc doses. On 2-year average basis, the highest yield (3.81±0.13 t ha-1) were recorded under Sotubaka with the application of Zn60. Globally, maize grain yield got under Zn60 were 15.13 and 3.65% higher than those obtained under Zn0 and Zn45 respectively. Based on 2-year average, the highest zinc concentration was recorded in Sotubaka grains (55.62±3.78 mg kg-1). This concentration is higher than those obtained in Ikenne, Tzee and Sammaz 52 grains by 17.02; 7.13 and 2.64% respectively. 2-year average zinc concentration obtained under Zn60 (66.09±2.31 mg kg-1) was higher than those recorded under Zn0 and Zn45 by 118.12 and 9.10% respectively. On 2-year average basis, the Zn60 application to the Sotubaka (70.58±2.91 mg kg-1) gave the highest zinc concentration. Zinc foliar application improved yield and zinc content in maize grain; but its effectiveness depends on environmental conditions.
Summary
Source-checkedPlain-language reading of the full paper, prepared with AI and checked against the text. Each point links to the authors' own words.
Why it matters
- Zinc deficiency is a significant global concern that negatively impacts both human nutrition and overall food production. View evidence ↗
- Maize is a primary staple food in Sub-Saharan Africa and Togo, though Togolese cultivation has been marked by low national average yields (below 1.50 t ha-1 since 2010). View evidence ↗
- Agronomic biofortification is used to increase zinc bioavailability in food crops while maintaining yields, offering a sustainable and accessible solution for rural populations. View evidence ↗
The question
- The study aimed to evaluate how foliar zinc application affects maize grain yield, identify the variety that accumulates the most zinc, and assess the interaction between varieties and zinc doses on grain zinc concentration. View evidence ↗
What they did
- The research was conducted over two years (2020 and 2021) at the University of Lome Agronomic Experiments Station on rhodic Ferralsol soil. View evidence ↗
- The experiment tested four maize varieties (Ikenne, Tzee, Sotubaka, and Sammaz 52) across three zinc doses: 0 kg ha-1 (Zn0), 3.75 kg ha-1 (Zn45), and 5 kg ha-1 (Zn60) of ZinGap (12% Zn). View evidence ↗
- A split-plot design was employed, consisting of twelve treatments with three replications each. View evidence ↗
- Zinc was administered to the plants via two separate foliar applications. View evidence ↗
What they found
- The highest average yield over two years was 3.81±0.13 t ha-1, achieved by the Sotubaka variety treated with the Zn60 dose. View evidence ↗
- Overall, the Zn60 dose increased maize grain yields by 15.13% compared to the control (Zn0) and by 3.65% compared to the Zn45 dose. View evidence ↗
- Sotubaka grains had the highest average zinc concentration (55.62±3.78 mg kg-1), exceeding Ikenne, Tzee, and Sammaz 52 by 17.02%, 7.13%, and 2.64%, respectively. View evidence ↗
- The Zn60 dose resulted in a 2-year average zinc concentration of 66.09±2.31 mg kg-1, which was 118.12% higher than Zn0 and 9.10% higher than Zn45. View evidence ↗
- The combination of the Sotubaka variety and the Zn60 dose produced the highest average zinc concentration at 70.58±2.91 mg kg-1. View evidence ↗
- Grain yields were higher in the first year than the second, with the decline attributed to poor rainfall distribution in the second year. View evidence ↗
What it means
- The authors concluded that foliar zinc application significantly improves both maize grain yield and zinc concentration, with the 5 kg ha-1 (Zn60) dose being the most effective. View evidence ↗
- The authors state that an economic profitability study is necessary before making final recommendations. View evidence ↗
Visual summary
3 visualsIllustrations explain the paper; charts are replotted from the paper's own table values.
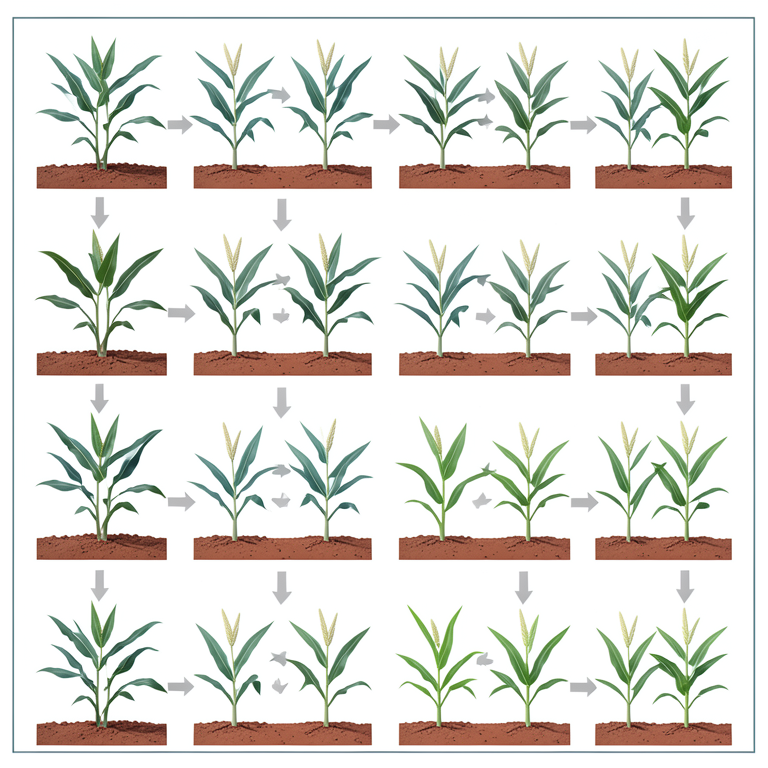
Experimental Setup Overview
AI-generated conceptual illustration (maize plants (Zea mays L.) in Rhodic Ferralsol soil). It explains the idea and does not show study data.
View source evidence ↗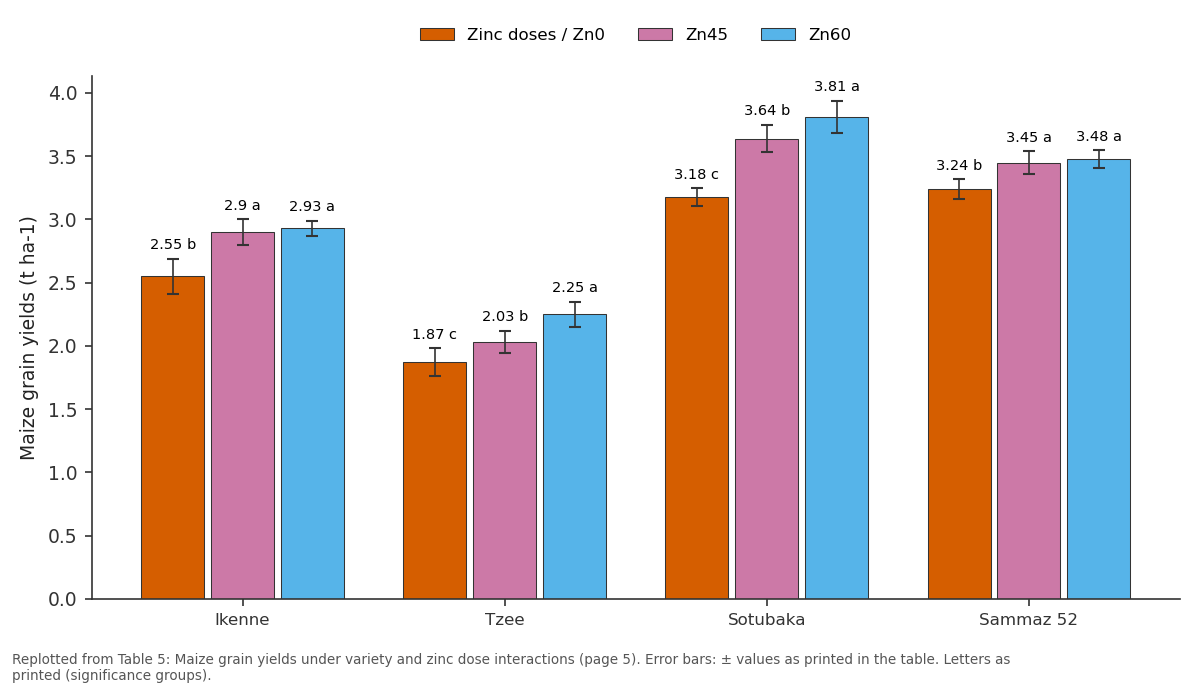
Zinc doses / Zn0 and Zn45 and more: Ikenne vs Tzee vs Sotubaka vs Sammaz 52
Replotted from Table 5 (page 5) of the original paper. Every bar is the paper's own table value.
View source evidence ↗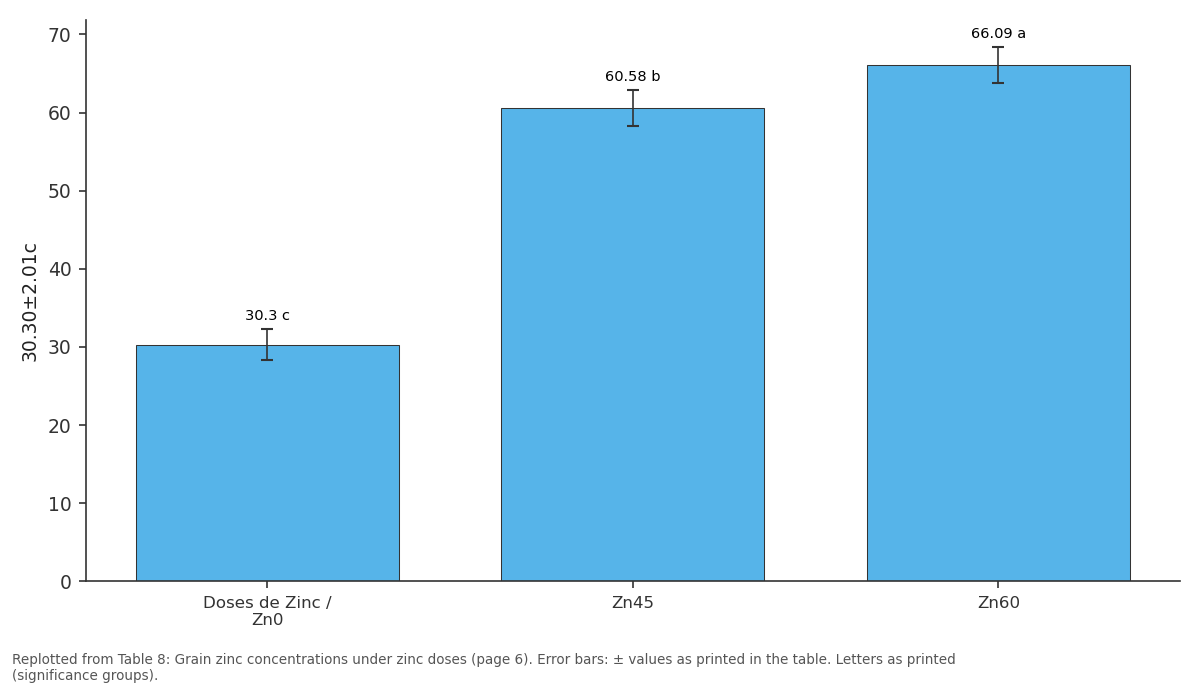
30.30±2.01c: Doses de Zinc / Zn0 vs Zn45 vs Zn60
Replotted from Table 8 (page 6) of the original paper. Every bar is the paper's own table value.
View source evidence ↗Figures & tables
From the original paper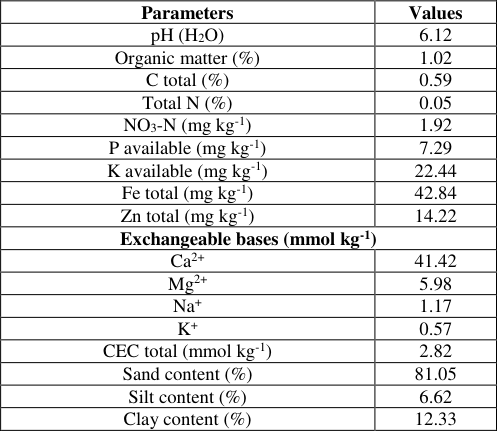 Table 1
 Table 2
 Table 3
 Table 4
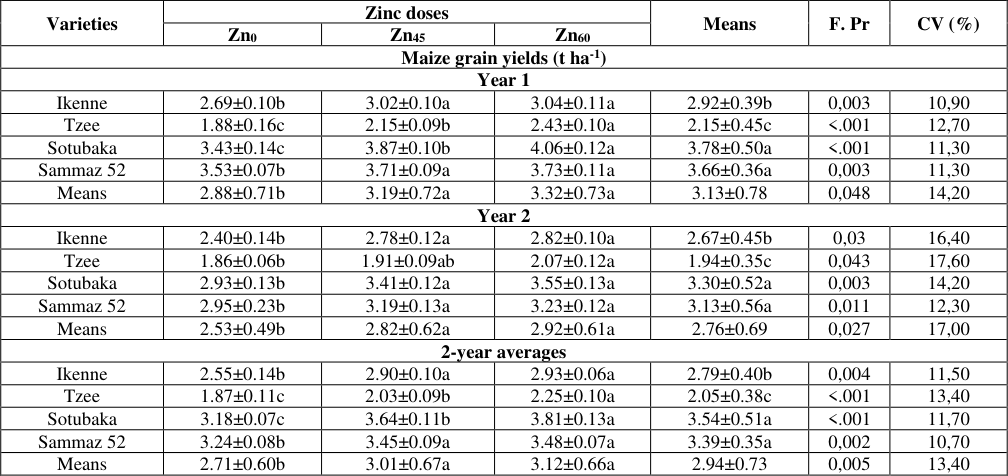 Table 5
 Table 6
 Table 7
 Table 8
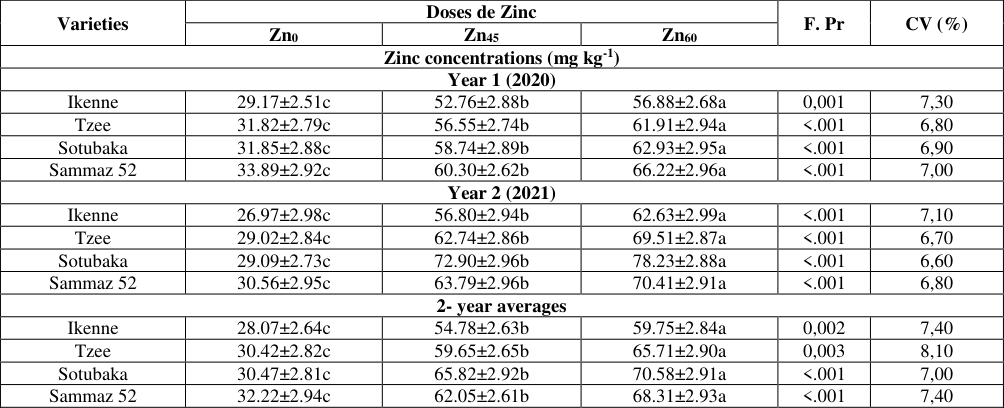 Table 9
Introduction
Agricultural production in Sub-Saharan Africa presents numerous biotic and abiotic strains, including micronutrient deficiencies. Among micronutrients, zinc (Zn) deficiency is considered a major threat to global and regional food security (Rana and Kashif, 2014) [51] , because it is the most deficient micronutrient in soils worldwide (Cakmak, 2002; Shivay et al., 2008) [11,57] and over 30% of soils have low Zn availability (Gibson, 2006; Alloway, 2008) [22,4] . Zn deficiency is therefore a major strain to food production and a global concern for human nutrition (Farooq et al., 2018) [21] . Importantly, the geographic distribution of Zn deficiency in the human diet overlaps with that of Zn deficiency in soil (Peramaiyan et al., The main reason for Zn deficiency in humans was overreliance on low-Zn foods, particularly cereals. Traditional interventions such as supplementation, food fortification and dietary diversification have not achieved the desired success for many reasons (Veni et al., 2019) [62] . Thus, scientists turned more to agronomic biofortification of zinc in food crops to improve human bioavailability of zinc and maintain crop yields, as this type of biofortification was more adaptable and accessible to rural populations (Cakmak, 2008) [12] . Agronomic biofortification of food crops contributed to solving global food security and human nutrition problems on a sustainable basis (Akram et al., 2020) [3] . It aims to increase the concentration of this micronutrient in the edible parts of staple crops without adversely affecting yield (Kachinski et al., 2020) [32] . However, foliar application of Zn is much more effective than soil application of Zn in enriching crop grains with Zn (Wang et al., 2012; Zhang et al., 2012) [64,69] , as the availability of soil Zn to plants depends on soil and climatic factors (Veni et al., 2019) [62] . In Sub-Saharan Africa, maize (Zea mays L.) is a staple food consumed by the majority of people (Macauley & Ramadjita, 2015) [41] . It is one of the main food crops in Togo; but its cultivation was characterized by low yields whose national average has never exceeded 1.50 tha -1 since 2010 (DSID, 2022) [19] . It should also be noted that the maize grains produced intrinsically contain very little Zn to satisfy daily human needs, particularly when maize is grown on Zn-deficient soils (Cakmak, 2008) [12] . This low Zn content in maize grains can lead to Zn deficiency in humans, who are highly dependent on it. It is therefore of great interest to increase Zn concentrations and bioavailability in grain, in order to effectively combat Zn deficiency in humans and reap the benefits for human health. Thus, agronomic practices aimed at zinc biofortification of maize grains are important to mitigate zinc deficiency in humans, especially in resource-poor people due to their diets dominated by cereal-based foods with low zinc concentration and bioavailability (Xia et al., 2018) [67] . That is the background of this study, which aims to: (i) assess the effect of foliar application of zinc on maize grain yield; (ii) determine the most Zn accumulated variety in maize grains and (iii) assess the effect of varieties and zinc doses interactions on zinc concentration in maize grain.
Materials and Methods
Materials and Methods
Experimental site
The study was carried out at the Lomé Agronomic Experiments Station, located at the University of Lomé -Togo (6°22' N, 1°13'E; altitude of 50 m, slope less than 1%). The soil type was a rhodic Ferralsol locally called "Terres de barre", developed from the continental deposits (Saragoni et al., 1992) [54] . This type of soil represented 47% of the soils of the maritime region (Worou, 2000) [66] and covered part of the arable land in Ivory Coast, Ghana, Togo, Benin and Nigeria (Raunet, 1973; Louette, 1988) [52,40] . The climate of the experimental site was the Guinean type, bimodal and allowed for two maize cropping seasons, one from April to July and another from September to December (Sogbedji et al., 2017) [58] . Annual rainfall at the site was between 800 and 1100 mm (Adewi; 2010) [1] . The annual average temperature was between 24 and 27 °C (Worou, 2000; Somana et al., 2001) [66,59] . The experimental plot was under fallow for three years. Before the maize sowing in April 2020, initial soil properties including total C and total N levels, exchangeable base concentrations (Ca ++ , Mg ++ , Na + and K + ), pH, cation exchange capacity (CEC) and soil texture were determined on the first 20 cm soil layer (0-20 cm depth) on the experimental site. It was done through twenty-four (24) composite soil samples obtained by using the standard methods of the International Institute for Tropical Agriculture (IITA, 2014) [27] . These composite soil samples were analysed at the Laboratory of Soil Water Plant Fertilizer of the Togolese Institute for Agronomic Research (LSEVE-ITRA) and in the Geochemistry and Environment Laboratory (LGE). Total C and total N levels, exchangeable base concentrations (Ca ++ , Mg ++ , Na + and K + ), pH, cation exchange capacity (CEC) were determined. The soil of the experimental site was slightly acidic (pH=6.12) and had low total C (0.59%) and total N (0.05%) levels. It was sandy and contained 81.05% sand, indicating that this soil was well drained with low contents of P (7.29 mg kg -1 ); K (22.44 mg kg -1 ) and Fe (42.84 mg kg -1 ) contents. Its CEC was very low 2.82 mmol kg -1 , as were exchangeable bases Ca ++ , Mg ++ , Na + and K + , with respective values of 41.42; 5.98; 1.17 and 0.57 mmol kg -1 (Table 1). [45] Biological Materials Four maize varieties were used as biological material: Ikenne 9449 SR (Ikenne); Tzee W pop STR QPM (Tzee), Sotubaka and Sammaz 52. The characteristics of these varieties were described in the national catalog of plant species and varieties grown in Togo (MAEP, 2013) [42] the ECOWAS-UEMOA-CILSS catalogs of plant species and, varieties (CORAF, 2017 and CORAF, 2019) [16,17] and by Laba and Sogbedji (2015) [37] . The table below summarizes the characteristics of these varieties. Nontolerant Sources: MAEP (2013) [42] , Laba and Sogbedji (2015) [37] , CORAF (2017) [16] , CORAF (2019) [17]
| Parameters | Values |
|---|---|
| pH (H2O) | 6.12 |
| Organic matter (%) | 1.02 |
| C total (%) | 0.59 |
| Total N (%) | 0.05 |
| NO3-N (mg kg-1) | 1.92 |
| P available (mg kg-1) | 7.29 |
| K available (mg kg-1) | 22.44 |
| Fe total (mg kg-1) | 42.84 |
| Zn total (mg kg-1) | 14.22 |
| Exchangeable bases (mmol kg-1) | |
| Ca2+ | 41.42 |
| Mg2+ | 5.98 |
| Na+ | 1.17 |
| K+ | 0.57 |
| CEC total (mmol kg-1) | 2.82 |
| Sand content (%) | 81.05 |
| Silt content (%) | 6.62 |
| Clay content (%) | 12.33 |
Table text extracted from the original PDF; superscript letters are shown inline. The original table image is below.
View original table image
Fertilizers
The fertilizers used for the experiment consisted of complex fertilizer, NPK: 15-15-15, simple fertilizer, urea 46% N and ZinGap wettable powder fertilizer with 12% EDTA chelated Zn.
Experimental Design
The experiment took place during the first growing seasons (April to August) of two consecutive years (2020 and 2021). Four maize varieties: Ikenne; Tzee; Sotubaka and Sammaz 52 and three zinc doses: control (0 kg ha -1 =Zn0); 3.75 kg ha -1 (Zn45) and 5 kg ha -1 of ZinGap at 12% Zn (Zn60) were used. The combination of these two factors (varieties and zinc doses) gave twelve (12) treatments. The trial was set up using a split-plot design with three replications of each treatment. The main plots included the zinc doses and the sub-plots, the varieties. Nine (09) main plots (15 m x 3.20 m) and thirty-six (36) sub-plots (3.20 m x 3 m) were laid out. The distance between the blocks is equivalent to that between the plots and which 1m was. Each sub-plot contains five rows separated from each other by 0.80 m.
Soil and crop management
At the beginning of each cropping season, the experimental site was prepared through the following successive operations: Clearing, deep ploughing, levelling, and demarcation of blocks, main plots and subplots. The maize seeds were sown on April 14, 2020 and April 25, 2021 at four seeds per pocket, follow-up of thinning at one plant per pocket carried out ten (10) days after sowing. The planting pattern was 80 cm x 25 cm, giving a density of 50,000 plants ha -1 . 200 kg ha -1 of NPK: 15-15-15, were applied to the plants on the 15 th day after sowing. 100 kg ha -1 of urea 46% N was applied at the beginning of flowering of each variety (Table 4). NPK: 15-15-15 and urea 46% N were pointplaced at a depth of approximately 5 cm. Zinc fertilizer (ZinGap with 12% of Zn) were brought by foliar application in two times (Table 4). The water quantity used for each Zn spray was 350 litters ha -1 . Zinc foliar application was done between 3 p.m. and 5:30 p.m. Two weeding and one hilling were carried out respectively on the 14 th , 30 th and 45 th day after sowing. Two insecticide treatments against the caterpillars were done and the crop was harvested on August 14, 2020 and August 21, 2021. The table below shows the application dates for ZinGap.
| Product application dates | Ikenne | Tzee | Sotubaka | Sammaz 52 |
|---|---|---|---|---|
| Dates of appearance of panicles (DAS) | 45 | 38 | 55 | 45 |
| Dates of first application of ZinGap (DAS) | 46 | 39 | 56 | 46 |
| Dates of second application of ZinGap (DAS) | 60 | 53 | 70 | 60 |
Table text extracted from the original PDF; superscript letters are shown inline. The original table image is below.
View original table image
Data collection Maize grains yield determination
Maize grain yields were determined from the three (03) centre rows of each subplot. The harvested cobs were dried, shelled and dried again. The maize grain weights were taken when the moisture content of the grains was around 12% (Mazinagou et al., 2022b) [70] .
Sampling
Maize cobs were harvested from nine (09) central plants in the three centre rows of each subplot (Mazinagou et al., 2022a) [45] . The cobs were dried, shelled and dried again. Composite samples of maize grains of the same colour obtained after sorting were made. Samples of 50g of maize grains were taken from the seeds of each maize variety and from each composite sample of harvested maize grains. Similarly, composite samples of 50 g of soil were made and submitted to analysis. They were analysed in the Geochemistry and Environment Laboratory (LGE).
Chemical analysis methods
The maize grains samples were oven dried at 70 °C for 48 h, then finely ground and sieved. Soil samples were also ground and sieved. Soil samples were also finely ground and sieved. The solubilization method used for soil samples was mineralization by acid attack (mixture of hydrochloric acid and nitric acid) in accordance with NF ISO 11466 or the aqua regain method (ISO, 1995) [30] for soils. It was carried out in a closed environment and at high temperature (110-150 °C). For 1 g of soil sample finely ground and weighed on a BEL L303i electric balance (Pmax = 310 g, Accuracy = 0.001), a 3:1 ratio of acid mixture was required (3ml hydrochloric acid and 1ml nitric acid). For maize grains samples, the solubilization method used was mineralization by acid attack with nitric acid. It was also carried out in a closed environment and at high temperature (150 °C). For 1 g of finely ground maize sample and weighed on a BEL L303i electric balance (Pmax=310 g, Accuracy= 0.001), 4 ml of nitric acid were required. 10 ml of 9% hydrogen peroxide (H2O2) was added beforehand to each sample and left to react for 24 hours before acid etching. After acid etching and heating, the samples were filtered using filter paper (Walsh and Beaton, 1977) [63] . The filtrate obtained contained the chemical elements to be assayed. Zinc contents in soil and maize grains were determined by atomic absorption spectrophotometry (Pinta, 1973; Tee et al., 1989) [49,61] . The brand name of the atomic absorption
Data analysis
The data collected were entered and processed using Excel spreadsheets. These data were tested for normality and were subjected to an analysis of variance (ANOVA) using GenSTAT software at the 5% threshold. Duncan's test was used to discriminate the means at this threshold
Results and Discussions
Influence of zinc doses on maize grain yield Table 5 presents maize grain yields obtained under the different zinc doses. Zinc doses had a significant effect on maize grain yields. Yields obtained in the first year of experiment were 13.41% higher than those obtained in the second year. This superiority of first-year yields over second-year yields was due to climatic variability (Adewi et al., 2010; Amouzou et al., 2013) [1,5] . Indeed, the cumulative rainfall obtained from April to August 2021 (540.90 mm) in the study area was higher than that recorded in 2020 (342.50 mm) at the same period. It therefore appeared that rainfall could influence the effectiveness of foliar zinc application on grain maize yield. In addition, the difference between the yields of the two years of experiment could be explained by the effect of previous crops and especially by the variation in the chemical composition of the soil (Mazinagou et al., 2022a) [45] . These results were similar to those of Sogbedji et al. (2017) [58] , who found a drop in yield ranging from 24 to 38% during the main cropping season of the second year compared to the first year, due to rainfall deficits; but in this study, it was the poor distribution of rainfall which led to lower maize grain yield during the second year of cultivation. Several studies ( [38,7,26] had also proved that climate variability had direct impacts on crop production and consequently on food security and economic stability.
| Varieties | Zinc doses | — | — | Means | F. Pr | CV (%) |
|---|---|---|---|---|---|---|
| Zn0 | Zn45 | Zn60 | ||||
| Maize grain yields (t ha-1) | ||||||
| Year 1 | ||||||
| Ikenne | 2.69±0.10b | 3.02±0.10a | 3.04±0.11a | 2.92±0.39b | 0,003 | 10,90 |
| Tzee | 1.88±0.16c | 2.15±0.09b | 2.43±0.10a | 2.15±0.45c | <.001 | 12,70 |
| Sotubaka | 3.43±0.14c | 3.87±0.10b | 4.06±0.12a | 3.78±0.50a | <.001 | 11,30 |
| Sammaz 52 | 3.53±0.07b | 3.71±0.09a | 3.73±0.11a | 3.66±0.36a | 0,003 | 11,30 |
| Means | 2.88±0.71b | 3.19±0.72a | 3.32±0.73a | 3.13±0.78 | 0,048 | 14,20 |
| Year 2 | ||||||
| Ikenne | 2.40±0.14b | 2.78±0.12a | 2.82±0.10a | 2.67±0.45b | 0,03 | 16,40 |
| Tzee | 1.86±0.06b | 1.91±0.09ab | 2.07±0.12a | 1.94±0.35c | 0,043 | 17,60 |
| Sotubaka | 2.93±0.13b | 3.41±0.12a | 3.55±0.13a | 3.30±0.52a | 0,003 | 14,20 |
| Sammaz 52 | 2.95±0.23b | 3.19±0.13a | 3.23±0.12a | 3.13±0.56a | 0,011 | 12,30 |
| Means | 2.53±0.49b | 2.82±0.62a | 2.92±0.61a | 2.76±0.69 | 0,027 | 17,00 |
| 2-year averages | ||||||
| Ikenne | 2.55±0.14b | 2.90±0.10a | 2.93±0.06a | 2.79±0.40b | 0,004 | 11,50 |
| Tzee | 1.87±0.11c | 2.03±0.09b | 2.25±0.10a | 2.05±0.38c | <.001 | 13,40 |
| Sotubaka | 3.18±0.07c | 3.64±0.11b | 3.81±0.13a | 3.54±0.51a | <.001 | 11,70 |
| Sammaz 52 | 3.24±0.08b | 3.45±0.09a | 3.48±0.07a | 3.39±0.35a | 0,002 | 10,70 |
| Means | 2.71±0.60b | 3.01±0.67a | 3.12±0.66a | 2.94±0.73 | 0,005 | 13,40 |
Table text extracted from the original PDF; superscript letters are shown inline. The original table image is below.
View original table image
For the 2-year experiments, the highest yields were obtained with the foliar application of 5 kg ha -1 of ZinGap with 12% Zn (Zn60). These yields were statistically identical to those recorded with 3.75 kg ha -1 of ZinGap at 12% Zn (Zn45). However, the 2-year average yields obtained with Zn60 were 15.13 and 3.65% higher than those got with Zn0 (control) and Zn45 respectively. The highest maize grain yields recorded under Zn60 would be due to the high amount of zinc supplied, which would have contributed to the growth and development of the maize plants. Zn acted as an essential component of many enzymes and controls several biochemical processes in plants necessary for growth (IRRI, 2000) [29] . These results showed that zinc application improved maize grain yield. Sudha and Stalin (2015) [60] had recorded lower paddy rice yields with low zinc concentrations when low amounts of zinc were applied.
Increasing doses of Zinc had also a beneficial effect on strawberry production (Impa et al., 2013) [28] . It was well documented that the application of Zn fertilizers not only increased yields, but also improved crop quality in wheat (Haslett et al., 2001) [25] and rice (Li et al., 2003) [39] .
Effects of variety and zinc dose interactions on maize grain yields
Maize grain yields obtained under different variety and zinc dose interactions were registered in the table below. These yields ranged from 1.88±0.16 to 4.06±0.12 t ha -1 and from 1.86±0.06 to 3.55±0.13 t ha -1 respectively in the first and second years of experimentation. 2-year average yields ranged from 1.87±0.11 to 3.81±0.13 t-ha -1 . Statistical analysis showed that variety and zinc dose interactions significantly influenced maize grain yields. Maize grain yields in the first year of experimentation were higher than those of the second year. The yields decline in the second year was due to poor rainfall distribution in this year, because the amount of rainfall recorded the second year of experiment was greater than those of the first year. In the first and second years of experiments, the highest maize grain yields under the four varieties were obtained with foliar application of 5 kg ha -1 of ZinGap with 12% Zn (Zn60); but the yields got with the Zn60 application to Ikenne and Sammaz 52 were statically identical to those of Zn45 under the same varieties in the first year of cultivation. In contrast, in the second year of experiment, the yields got with the application of Zn60 were statically similar to those obtained with Zn45 under all varieties. The results obtained in this study were similar to those of Keram et al. (2012) [33] , who reported that treatments applied with increasing doses of Zn gave higher grain and straw yields than treatments applied with NPK alone. Indeed, for all four varieties, yields recorded under Zn60 were significantly higher than those obtained under Zn0 (Control with NPK applied) and Zn45. Some authors (Akram et al., 2020) [3] recorded the highest wheat grain yield (5.41 t ha -1 ) with the application of 5 kg ha -1 of Zn. Zinc plays multiple roles in fundamental biochemical processes in plants, including enzyme activation, protein synthesis, starch, auxin and nucleic acid metabolism, and pollen development (Marschner, 1995; Cakmak, 2000; Chang et al., 2005) [44,10,15] . For all the interactions, the highest yields of the 2-year experiments (4.06±0.12 t ha -1 in the first year and 3.55±0.13 t ha -1 in the second year) were observed under Sotubaka with the application of Zn60. These highest yields obtained under this variety with Zn60 application could be explained by the intrinsic genetic characteristics of this variety, which enabled the plants to absorb sufficient quantities of the zinc applied. This superiority could also be due to the difference in potential yields, which could vary the nutrient requirements of plants. Indeed, the potential yields of the varieties were 5 t ha -1 for Ikenne; respectively, 3.50 t ha -1 for Tzee and 6 t ha -1 for Sotubaka and Sammaz 52. With this difference in potential yields, Ikenne and Tzee varieties would never be able to give a maize grain yield identical to that of Sotubaka and Sammaz 52 under normal conditions (especially good climatic conditions) of maize cultivation. The difference in yield observed between Sotubaka and Sammaz 52 would be linked to their production cycles (Mazinagou et al., 2022b) [70] . Overall, the average yields obtained with Sotubaka are higher than those obtained with Ikenne, Tzee and Sammaz 52 by 26.88, 72.68 and 4.42% respectively. It indicated in Sudha and Stalin (2015) [60] study that grain and straw yields of different rice genotypes were significantly increased with zinc application by 14 and 16% respectively. 13,40 Zn0= 0 kg ha -1 ; Zn45 = 3.75 kg ha -1 of ZinGap at 12% Zn. and Zn60 = 5 kg ha -1 of ZinGap at 12% Zn; F.Pr = Fisher's probability; CV= Coefficient of variation. Data were discriminated horizontal direction. Values followed by the same letters are statistically identical.
Assessment of zinc dose performance under each variety
Table 6 shows the average performance rates of zinc doses in relation to the potential yields of varieties. The performance rate of a dose corresponds to the ratio between maize grain yield obtained after application of this dose and the potential yield of the variety to which this dose was applied. The highest performance rates were obtained under all varieties with the application of Zn60. The effectiveness of this dose under all varieties could be explained by its ability to provide plants of different maize varieties with the nutrients they need for their growth and fruiting (Mazinagou et al., 2022b) [70] . Tzee gave the highest performance rate (64.29%) with Zn60 application; although its yield is the lowest of the yields obtained with the application of Zn60 to the four varieties. Indeed, with the application of Zn60, the two-year average yield obtained under Tzee is lower than those of Ikenne, Sotubaka and Sammaz 52 by 23.21; 40.94 and 35.34% respectively. On average basis, Sotubaka variety performed best. The highest performance of Sotubaka could be explained by its greater capacity to absorb more zinc than the other varieties. In addition, the production cycle and level of plant organ constitution of each variety (Maltais, 2006; Mazinagou et al., 2022a) [43,45] could also explain the difference in performance between varieties after dosing. With regard to the performance rates of zinc doses in relation to yield and from an economic view point, Zn60 application would have further improved the profitability of maize production with Tzee and Sotubaka varieties; while the best profitability of maize production with Ikenne and Sammaz 52 varieties could be obtained with Zn45 application. 54,00 57,50 58,00 56,50 Zn0= 0 kg ha -1 ; Zn45 = 3.75 kg ha -1 of ZinGap at 12% Zn. and Zn60 = 5 kg ha -1 of ZinGap at 12% Zn Assessment of zinc uptake and accumulation in maize grains: Grain zinc concentrations obtained after chemical analysis of maize grains in the laboratory were recorded in table 7. Zn concentrations in the second year of experiment were 8.24% higher than those of the first year. The results showed that maize varieties absorbed and accumulated zinc in their grains in different ways. In the first year of experiment, the highest zinc concentration was obtained in the Sammaz 52 grains (53.47±3.08 mg kg -1 ), while it was higher in Sotubaka grains (60.07±3.83 mg kg -1 ) in the second year. Based on the 2-year averages of zinc concentration in maize grains, the highest zinc concentration was observed in Sotubaka grains (55.62±3.78 mg kg -1 ). This concentration was higher than those of Ikenne, Tzee and Sammaz 52 grains by 17.02; 7.13 and 2.64% respectively. This difference in grain zinc accumulation among the varieties was due to genetic characteristics and the nature of plant organs especially stomata, trichomes, cuticle, cuticular and epicuticular wax and cutin which influenced the efficiency of foliar fertilization (Maltais, 2006) [43] . Other factors such as: Soil, climate, plants and their interaction also affected nutrient uptake by plants (Fageria et al., 2009) [20] . According to de Valença et al. (2017) [18] , the bioavailability of micronutrients from the crop to the food was influenced by the crop (variety), which defines whether micronutrients are (re-)localized in the edible parts of the crop.
| Years | Varieties | — | — | — | Means | F.Pr | CV (%) |
|---|---|---|---|---|---|---|---|
| Ikenne | Tzee | Sotubaka | Sammaz 52 | ||||
| Zinc concentrations (mg kg-1) | |||||||
| Year 1 (2020) | 46.27±2.68c | 50.09±2.87b | 51.17±3.02b | 53.47±3.08a | 50.25±4.19 | < 0.001 | 6,90 |
| Year 2 (2021) | 48.80±3.42c | 53.76±3.68b | 60.07±3.83b | 54.92±3.66a | 54.39±4.53 | < 0.001 | 9,50 |
| Means | 47.53±3.05c | 51.92±3.38b | 55.62±3.78a | 54.19±3.46a | 52.32±4.36 | < 0.001 | 7,90 |
Table text extracted from the original PDF; superscript letters are shown inline. The original table image is below.
View original table image
| Varieties | Zinc Doses | — | — | Means |
|---|---|---|---|---|
| Zn0 | Zn45 | Zn60 | ||
| Performance rate (%) | ||||
| Ikenne | 51,00 | 58,00 | 58,60 | 55,80 |
| Tzee | 53,43 | 58,00 | 64,29 | 58,57 |
| Sotubaka | 53,00 | 60,67 | 63,50 | 59,00 |
| Sammaz 52 | 54,00 | 57,50 | 58,00 | 56,50 |
Table text extracted from the original PDF; superscript letters are shown inline. The original table image is below.
View original table image
Effect of zinc doses on zinc concentration in maize grains
Table 8 shows the grain zinc concentrations recorded under each zinc dose. The results indicated that zinc doses also had a significant effect on zinc concentration in maize grains. The highest grain zinc concentrations were obtained with the foliar application of 5 kg ha -1 of ZinGap with 12% Zn (Zn60) in first (61.98±2.46 mg kg -1 ) and second year (70.19±2.79 mg kg -1 ) of experiment. On 2-year average basis, grain zinc concentration recorded under Zn60 (66.09±2.31 mg kg -1 ) were higher than those of Zn0 and Zn45 by 118.12 and 9.10% respectively. Some authors showed that zinc increasing doses supplying to rice plants increased the total zinc content per plant at different stages of strawberry growth (Sarwar et al., 2013) [56] . The effectiveness of this dose (Zn60) would be linked to the quantity of zinc supplied (5 kg ha -1 for Zn60 versus 3.75 kg ha -1 for Zn45), which would have allowed the plants to absorb sufficient zinc and increase its accumulation in the grains, regardless of climatic or environmental conditions which could influence its uptake by the plants. Indeed, relative humidity, light intensity, rain and wind could affect the efficacy of a foliar fertilization at the time of, or just after foliar application of the product (Maltais, 2006) [43] . Some authors (Sanjeeva et al., 2020; Chandel et al., 2010) [54, 14] showed that Zn concentration in grain depends on environmental factors such as temperature, soil type, soil pH and micronutrient availability in the soil. However, zinc application increased zinc concentration in maize grain. It proved in some studies that the foliar application of Zn after flowering had been effective in increasing zinc content in rice grains (Boonchuay et al., 2013 and Yuan et al., 2013) [8,67] . In this study, the foliar application of zinc was made at two stages, early flowering and two weeks after the first application; but the results obtained lead to the conclusion of these authors. According to Phattarakul et al. (2012) [48] and Jalal et al. (2020) [31] , the timing of application (crop stage) and the number of applications were imperative to increase Zn accumulation in the grain (Peramaiyan et al., 2022) [47] . ,90 Zn0= 0 kg ha -1 ; Zn45 = 3.75 kg ha -1 of ZinGap at 12% Zn. and Zn60 = 5 kg ha -1 of ZinGap at 12% Zn F. Pr = Fisher's probability; CV= Coefficient of Variation. Data were discriminated horizontal direction. Values followed by the same letters are statistically identical
| Years | Doses de Zinc | — | — | Average | F. Pr | CV (%) |
|---|---|---|---|---|---|---|
| Zn0 | Zn45 | Zn60 | ||||
| Zinc concentrations (mg kg-1) | ||||||
| Year 1 (2020) | 31.68±2.13c | 57.09±2.23b | 61.98±2.46a | 50.25±4.19 | <.001 | 6,90 |
| Year 2 (2021) | 28.91±2.91c | 64.06±2.86b | 70.19±2.79a | 54.39±4.53 | <.001 | 9,50 |
| Averages | 30.30±2.01c | 60.58±2.29b | 66.09±2.31a | 52.32±4.36 | 0,001 | 8,90 |
Table text extracted from the original PDF; superscript letters are shown inline. The original table image is below.
View original table image
Influence of variety and zinc dose interactions on zinc concentration in maize grains
Grain zinc concentrations obtained under variety and zinc dose interactions ranged from 29.17±2.51 to 66.22±2.96 mg kg -1 and from 26.97±2.98 to 78.23±2.88 mg kg -1 respectively in first and second year of experiments (table 9). Overall, grain zinc concentrations recorded in second year of experiment were higher than those of the first year. This difference could be due to climatic or environmental conditions, which could have a negative impact on the efficient use of zinc supplied by maize plants in the first year. Indeed, cumulative rainfall from April to August 2021 (540.90 mm) in the study area was higher than that recorded in 2020 (342.50 mm) over the same period. According to Maltais (2006) [43] and Mazinagou et al. (2022a) [45] , relative humidity, light intensity, rain and wind can affect the efficacy of product's foliar application at the time of or just after its foliar application. For the two experiments, the highest grain zinc concentrations under the four varieties were obtained with the application of 5 kg ha -1 of ZinGap with 12% Zn (Zn60); but the best grain zinc concentrations were obtained in the first year under Sammaz 52 (66.22±2.96 mg kg -1 ) and in the second year under Sotubaka (78.23±2.88 mg kg -1 ). These results were similar to those of Khampuang et al. (2020) [34] , who proved that foliar Zn application could improve grain Zn concentration; but the response could change according to cropping year and cultivar or variety. On 2-year average basis, Zn60 foliar application to the Sotubaka (70.58±2.91 mg kg -1 ) gave the highest grain Zn concentration. The highest concentration observed under this interaction could be due to the performance of Sotubaka variety in terms of zinc uptake and accumulation, and the effectiveness of this dose to provide sufficient zinc amount to maize plants for their growth and fruiting. Indeed, zinc plays multiple roles in fundamental biochemical processes in plants, including enzyme activation, protein synthesis, starch, auxin and nucleic acid metabolism, and pollen development (Chang et al., 2005) [15] . Some authors (Khampuang et al., 2022) [35] found that Zn concentration in the grains of the CNT1 variety increased from 19.5% to 32.6% compared with the control (without Zn), when rice plants received Zn by foliar application. Veni et al. (2019) [62] also observed the highest Zn contents in rice grain (21.20 mg kg -1 ) and straw (33.20 mg kg -1 ) in CSR-30 cultivar. The bioavailability of micronutrients including zinc therefore depends on [18] . This conclusion is obvious, as there was a difference in zinc uptake and accumulation in the grains of maize varieties in this study. Maize varieties, soil and climatic factors were therefore determinants of zinc accumulation in maize grains. <.001 7,40 Zn0= 0 kg ha -1 ; Zn45= 3.75 kg ha -1 of ZinGap at 12% Zn. and Zn60= 5 kg ha -1 of ZinGap at 12% Zn. F. Pr = Fisher's probability; CV= Coefficient of variation. Data were discriminated in the horizontal direction. Values followed by the same letters are statistically identical.
| Varieties | Doses de Zinc | — | — | F. Pr | CV (%) |
|---|---|---|---|---|---|
| Zn0 | Zn45 | Zn60 | |||
| Zinc concentrations (mg kg-1) | |||||
| Year 1 (2020) | |||||
| Ikenne | 29.17±2.51c | 52.76±2.88b | 56.88±2.68a | 0,001 | 7,30 |
| Tzee | 31.82±2.79c | 56.55±2.74b | 61.91±2.94a | <.001 | 6,80 |
| Sotubaka | 31.85±2.88c | 58.74±2.89b | 62.93±2.95a | <.001 | 6,90 |
| Sammaz 52 | 33.89±2.92c | 60.30±2.62b | 66.22±2.96a | <.001 | 7,00 |
| Year 2 (2021) | |||||
| Ikenne | 26.97±2.98c | 56.80±2.94b | 62.63±2.99a | <.001 | 7,10 |
| Tzee | 29.02±2.84c | 62.74±2.86b | 69.51±2.87a | <.001 | 6,70 |
| Sotubaka | 29.09±2.73c | 72.90±2.96b | 78.23±2.88a | <.001 | 6,60 |
| Sammaz 52 | 30.56±2.95c | 63.79±2.96b | 70.41±2.91a | <.001 | 6,80 |
| 2- year averages | |||||
| Ikenne | 28.07±2.64c | 54.78±2.63b | 59.75±2.84a | 0,002 | 7,40 |
| Tzee | 30.42±2.82c | 59.65±2.65b | 65.71±2.90a | 0,003 | 8,10 |
| Sotubaka | 30.47±2.81c | 65.82±2.92b | 70.58±2.91a | <.001 | 7,00 |
| Sammaz 52 | 32.22±2.94c | 62.05±2.61b | 68.31±2.93a | <.001 | 7,40 |
Table text extracted from the original PDF; superscript letters are shown inline. The original table image is below.
View original table image
Conclusion
At the end of this study aimed at improving yield and zinc concentration in maize grains through agronomic biofortification, it was found that zinc foliar application considerably improved yield and zinc concentration in maize grains. The 5 kg ha -1 of ZinGap with 12% Zn (Zn60) increased both maize grain yield and grain zinc concentration. The Sotubaka variety accumulated more zinc in its grains than Sammaz 52, Tzee and Ikenne varieties. Zn60 foliar application to varieties gave both the highest yield and zinc concentration under each variety. However, it would be necessary to carry out an economic profitability study in order to make appropriate recommendations. It would also be important to enhance the availability and accessibility of zinc fertilizers to increase their use by the producers.
Figures and tables from the paper
| Varieties | Genetic nature | Plant breeder | Maintainer | Height (cm) | Grain Colour | Production Cycle (Days) | Potential yield (T-ha-1) | Pest Resistance |
|---|---|---|---|---|---|---|---|---|
| Ikenne 9449 SR (Ikenne), | Composite | CIMMYT/ IITA | ITRA | 190-210 | White | 90-100 | 5 | Average |
| TZEE W pop STR QPM (Tzee) | Composite | IATI | ITRA | 170-185 | White | 80-85 | 3.50 | Average |
| Sotubaka | Composite | I | ITRA | 210-230 | Yellow | 100-110 | 6 | Average |
| Sammaz 52 | Improved variety (Rich in Vitamin A) | Menkir Abebe | IAR | 190-195 | Orange | 95 (average) | 6 | Non- tolerant |
Table text extracted from the original PDF; superscript letters are shown inline. The original table image is below.
View original table image
| Zinc content (%) | 0 (Zn0) | 45 (Zn45) | 60 (Zn60) |
|---|---|---|---|
| ZinGap quantity 12% Zn (kg ha-1) | 0 | 3.75 | 5.00 |
| Zinc quantity (g ha-1) | 0 | 450 | 600 |
Table text extracted from the original PDF; superscript letters are shown inline. The original table image is below.
View original table image
References
54 in the original paper- Adewi E, Badameli KMS, Dubreuil V. Evolution of potentially useful rainy seasons in Togo from 1950 to 2000. Climatology. 2010;7:89-107.
- Akram MA, Depar N, Memon MY. Synergistic use of nitrogen and zinc to bio-fortify zinc in wheat grains. Eurasian Journal of Soil Science. 2017;6(4):319-326.
- Akram AM, Depar N, Irfan M. Agronomic zinc biofortification of wheat to improve accumulation, bioavailability, and productivity use efficiency. Eurasian Journal of Soil Sciences. 2020;9(1):75-84.
- Alloway BJ. Zinc in Soils and Crop Nutrition. Second edition published by International Zinc Association (IZA), International Fertilizer Association (IFA). Brussels, Belgium and Paris, France, 2008, 139.
- Amouzou KA, Ezui KS, Sogbedji JM. Impacts of climate variability and soil fertility management strategies on maize grain yield on Ferralsol in Coastal. Western Africa, Journal of Renewable Agriculture. 2013;1(3):44-52.
- Andreini C, Banci L, Bertini I, Rosato A. Zinc through the three domains of life. Journal of Proteome Research. 2006;5(11):3173-3178.
- Boonchuay I, Cakmak B, Rerkasem, Thai PUC. Effect of different foliar zinc application at different growth stages on seed zinc concentration and its impact on seedling vigor in rice. Soil Science and Plant Nutrition. 2013;59(2):180-188.
- Brown K, Rivera J, Bhutta Z, Gibson R, King J, Lonnerdal B, et al. International Zinc Nutrition Consultative Group (IZiNCG) technical document: Assessment of the risk of zinc deficiency in populations and options for its control. Food and Nutrition Bulletin. 2004;25:S99-203. 10.4067/S0717-75182010000200014.
- Cakmak I. Possible roles of zinc in protecting plant cells from damage by reactive oxygen species. New Phytology. 2000;146(2):185-205.
- Cakmak I. Plant nutrition research: Priorities to meet human needs for food in sustainable ways. Plant and Soil. 2002;247:3-24.
- Cakmak I. Enrichment of cereal grains with Zinc Agronomic or genetic bio fortification. Plant and Soil. 2008;302(1-2):1-17.
- Cakmak I, Kalayci M, Kaya Y, Torun AA, Aydin N, Wang Y, et al. Biofortification and localization of zinc in wheat grain. Journal of Agricultural and Food Chemistry. 2010;58(16):9092-9102.
- Chandel G, Banerjee S, See S, Meena R, Sharma DJ, Verulkar SBB. Effects of different nitrogen fertilizer levels and native soil properties on rice grain Fe, Zn and protein contents. Rice Sciences. 2010;17(3):213-227. International Journal of Agriculture and Nutrition https://www.agriculturejournal.net
- Chang H, Lin C, Huang H. Zinc induced cell death in rice (Oryza sativa L.) roots. Plant Growth Regulation. 2005;46:261-266.
- CORAF. Regional catalog of plant species and varieties ECOWAS-UEMOA-CILSS-Approved varieties from 2016 to 2018. Dakar. Sénégal, 2019, 4-7.
- Valença DAW, Bake A, Brouwer ID, Giller KE. Agronomic biofortification of crops to fight hidden hunger in sub-Saharan Africa. Global Food Security. 2017;12:8-14. http://dx.doi.org/10.1016/j.gfs.2016.12.001.
- DSID (Agricultural Statistics, IT and Documentation Department). Report on the 2021-2022 agro-pastoral campaign in Togo. Lomé, Togo, 2022, 60.
- Fageria NK, Barbosa Filho MP, Moreira A, Guimaraes CM. Foliar fertilization of crop plants. Journal of Plant Nutrition. 2009;32(6):1044-1064. DOI:10.1080/019041-60902872826.
- Farooq M, Ullah A, Rehman A, Nawaz A, Nadeem A, Wakeel A, et al. Application of zinc improves the productivity and biofortification of fine grain aromatic rice grown in dry seeded and puddled transplanted production systems. Field Crops Research. 2018;216:53-62.
- Gibson RS. Zinc. The missing link in combating micronutrient malnutrition in developing countries. Proceedings of the Nutrition Society. 2006;65(1):51-60.
- Gibson RS. Zinc deficiency and human health, Etiology, health consequences, and future solutions. Plant Soil. 2012;361:291-299.
- Haslett BS, Reid RJ, Rengel Z. Zinc mobility in wheat: Uptake and distribution of zinc applied to leaves or roots. Annals of Botany. 2001;87(3):379-386.
- Hatfield L, Boote KJ, Kimball BA, Ziska LH, Izaurralde RC, Ort D, et al. Climate impacts on agriculture: Implications for crop production. Agronomy. 2011;103(2):351-370.
- Impa SM, Morete MJ, Ismail AM, Schulin R, JohnsonBeebout SE. Zn uptake, translocation, and grain Zn loading in rice (Oryza sativa L.) genotypes selected for Zn deficiency tolerance and high grain Zn. Journal of Experimental Botany. 2013;64(10):2739-2751.
- Jalal A, Shah S, Filho MCMT, Khan A, Shah T, Ilyas M, et al. Agro-bio fortification of zinc and iron in wheat Grains. Gesunde PFLANZ. 2020;72(3):227-236.
- Kachinski WD, Titski LHK, Petranski PH, Matos KKBL, Muller MML, Ávila FW. Zinc and iron concentration in grains of wheat cultivars under foliar zinc spraying. Research, Society and Development. 2020; [S. l.] 9, 6, e96963482. Disponível EM. DOI: 10.33448/rsd-v9i6.3482. https://rsdjournal.org/index.php/rsd/article/view/3482.
- Keram KS, Sharma BL, Sawarkar SD. Impact of Zn application on yield, quality, nutrients uptake and soil fertility in a medium deep black soil (VERTISOL). International Journal of Science, Environment and Technology. 2012;1(5):563-571.
- Khampuang K, Lordkaew S, Thai PD. Foliar zinc application improved grain zinc accumulation and bioavailable zinc in unpolished and polished rice. Plant Production Science. 2020;24(1):94-102. DOI:10.1080/1343943X.2020.1797512.
- Khampuang K, Dell B, Chaiwong N, Lordkaew S, Rouached H, Thai PC. Grain zinc and yield responses of two rice varieties to zinc bio fortification and water management. Sustainability. 2022;14(14):8838. https://doi.org/ 10.3390/su14148838Krężel.
- Krężel A, Maret W. The biological inorganic chemistry of zinc ions. Archives of Biochemistry and Biophysics. 2016;611:3-19.
- Laba BS, Sogbedji JM. Identification of land degradation and climate change resilient soil and crop management strategies for maize production on West African ferralsols. International Invention Journal of Agriculture and Soil Science. 2015;3(2):13-20.
- Lansigan FP, De Santos LWL, Coladilla ETJO. Agronomic impacts of climate variability on rice production in Philippines. Agriculture, Ecosystems and Environment. 2000;28(1-3):129-137.
- Li ZG, Ye ZQ, Fang YY, Yang XE. Effects of Zn supply levels on growth and Zn accumulation and distribution. China Rice Science. 2003;17:61-6.
- Muslumova ZH, Mammadli SA, Farajov MF. Effect of sodium and potassium humate in adaptive reaction of Zea mays under radiation stress. International Journal of Biological Sciences. 2022;4(1):9-15. DOI: 10.33545/26649926.2022.v4.i1a.35
- Peramaiyan P, Craufurd P, Kumar V, Seelan LP, McDonald AJ, Singh B, et al. Agronomic bio fortification of zinc in rice for diminishing malnutrition in South Asia. Sustainability. 2022;14(13):7747. https://doi.org/10.3390/su14137747.
- Phattarakul N, Rerkasem B, Li L, Wu L, Zou C, Ram H, et al. Biofortification of rice grain with zinc through zinc fertilization in different countries. Plant and Soil. 2012;361(1-2):131-141.
- Nuru Seid Tehulie. Review on critical period of weed competition and management in maize (Zea mays L.). Int. J Hortic Food Sci. 2021;3(2):44-48.
- Rana WK, Kashif SR. Effect of different zinc sources and methods of application on rice yield and nutrients concentration in rice grain and straw. Journal of Environnemental and Agricultural Sciences. 2014;1:9.
- Raunet M. Contribution à l'étude pédologique des terres de barre du Dahomey et du Togo. Agronomie Tropicale. 1973;28(11):1049-1069.
- Eleduma AF, Aderibigbe ATB, Sanni KO, Obabire SO. Effect of cattle manure on soil nutrients dynamics and performances of maize (Zea mays L) grown on sandy loam soil in forest-savannah transition zone southwest Nigeria. International Journal of Horticulture and Food Science. 2020;2(2):05-09.
- Sanjeeva RD, Neeraja CN, Madhu Babu P, Nirmala B, Suman K, Rao LVS, et al. Zinc biofortified rice varieties: Challenges, possibilities, and progress in India. Frontières in Nutrition. 2020;7:26.
- Saragoni H, Poss R, Marquette J, Latrille E. Fertilisation and succession of food crops in southern Togo: summary of a long-term experiment on bar land. Tropical Agronomy. 1992;46(2):107-120.
- Sarwar N, Ali H, Ahmad A, Ullah E, Ahmad S, Mubeen K, et al. Water wise rice cultivation on calcareous soil with the addition of essential micronutrients. The Journal of Animal and Plant Sciences. 2013;23(10):244.
- Shivay YS, Kumar D, Prasad RR. Effect of zincenriched urea on productivity, zinc uptake and efficiency of an aromatic rice-wheat cropping system. Nutrient Cycling in Agro-ecosystems. 2008;81:229243.
- Sogbedji MJ, Detchinli SK, Mazinagou M. Atchoglo R, Bona AK. Land degradation and climate change resilient soil and crop management strategies for maize production in Coastal Western Africa. Journal of Agriculture and Veterinary Science. 2017;10(6):24-30.
- Sudha S and Stalin P. Effect of zinc on yield, quality and grain zinc content of rice genotypes. International Journal of Farm Sciences. 2015;5(3):17-27.
- Tee ES, Choo KS, Shahid SM. Determination of iron in foods by the atomic absorption spectrophotometric and colorimetric methods. PERTANIA. 1989;12(3):313322.
- Veni VG, Datta SP, Rattan RK, Meena MC, Singh AK, Sharma KL, et al. Effect of variability of zinc on enhancement of zinc density in basmati rice grain grown in three different soils in India. Journal of Plant Nutrition. 2019;43(5):709-724.
- Wang J, Mao H, Zhao H, Huang D, Wang Z. Different increases in maize and wheat grain zinc concentrations caused by soil and foliar applications of zinc in Loess plateau, China. Field Crops Research. 2012;135:89-96. DOI: 10.1016/j.fcr.2012.07.010.
- White PJ, Broadley MR. Biofortification of crops with seven mineral elements often lacking in human diets - iron, zinc, copper, calcium, magnesium, selenium and iodine. New Phytology. 2009;182(1):49-84.
- Worou SK. Dominant soils of Togo: Correlation with the World Reference Database. ISSN 1014-853. Fourteenth Meeting of the West and Central African subcommittee on soil correlation for land reclamation. Abomey, Benin, AG/AGL; c2000. p. 105-120. Available on http://www.fao.org/3/a-y3948f.pdf, Accessed on January 10, 2022.
- Xia H, Xue Y, Liu D, Kong W, Xue Y, Tang Y, et al. Rational application of fertilizer nitrogen to soil in combination with foliar Zn spraying improved Zn nutritional quality of wheat grains. Frontiers in Plant Science. 2018;9:677.
- Yuan L, Lianghuan W, Chunlei Y, Qian LV. Effects of iron and zinc foliar applications on rice plants and their grain accumulation and grain nutritional quality. Journal of the Science of Food and Agriculture. 2013;93(2):254-261.
- Zhang YQ, Sun YX, Ye YL, Karim MR, Xue YF, Yan P, et al. Zinc biofortification of wheat through fertilizer applications in different locations of China. Field Crops Research. 2012;125:1-7.