
Research article · 2024 · Full text
International Journal of Geography Geology and EnvironmentWater scarcity in Ukhrul Town: Current status, challenges and future solutions
Volume 6(2) · Pages 226–232 · DOI: 10.22271/27067483.2024.v6.i2c.315 ↗
Research areasWater management and technologiesTransboundary Water Resource Management
Abstract
Author-writtenGrowing water demand and water scarcity have turned into a prominent challenge to livelihood in many regions of the world. Water is becoming a scarce resource due to climate change, coupled with population increases and urbanisation combined with poor management practices that are putting strain on natural resources. This abstract outline the primary concerns that populations encounter as a result of water scarcity and address the multifaced implications of the inadequate water resources on the communities at large in Ukhrul town. The methodology includes in-depth interviews and field observation. The data collected was analysed using SPSS version 27. The study employed purposive sampling to select the localities and was conducted with 550 respondents using simple random sampling. Ukhrul, which has a growing population, is known as a water scarce region due to its low supply of fresh water every year especially during the dry summer months.
Summary
Source-checkedPlain-language reading of the full paper, prepared with AI and checked against the text. Each point links to the authors' own words.
Why it matters
- Global water scarcity is driven by a combination of climate change, population growth, urbanization, and poor resource management. View evidence ↗
- A nation is classified as water-stressed when the annual water availability per person drops below 1700 m³. View evidence ↗
- In Ukhrul town, there is a significant gap between the daily water demand of 17 lakh litres and the actual supply of only 8-9 lakh litres provided twice weekly. View evidence ↗
The question
- The study aims to identify primary water sources in Ukhrul town, assess the challenges associated with water scarcity, and recommend future solution strategies. View evidence ↗
What they did
- The researchers used purposeful sampling to select five localities and simple random sampling to survey 550 respondents (110 per locality). View evidence ↗
- Data was gathered through in-depth interviews and field observations, then analyzed using SPSS version 27. View evidence ↗
- The data collection for this study took place between 2022 and 2023. View evidence ↗
What they found
- Pond water (76.3%) and private water vendors (44.6%) are the most critical water sources and distribution systems for residents. View evidence ↗
- A majority of households have low to middle-low incomes, with 46% earning between ₹15,000-₹34,000 and 37% earning between ₹35,000-₹55,000 monthly. View evidence ↗
- Water procurement is a significant expense, with 43.8% of households spending ₹2000-₹3000 and 12% spending over ₹3000 per month. View evidence ↗
- Accessibility is a challenge, as 45.5% of residents travel 500-1000m and 19.4% travel over 1000m to reach water sources. View evidence ↗
- Water scarcity negatively affects education, with 66% of participants believing it impacts children's academic performance. View evidence ↗
- Uncontrolled resource exploitation and forest fires have caused aquifers and springs to dry up, reducing the area's water capacity. View evidence ↗
What it means
- The authors recommend the wide adoption of rainwater harvesting as an environmentally friendly way to minimize water scarcity. View evidence ↗
- Implementing afforestation policies is recommended to improve groundwater quality and conserve water in catchment areas. View evidence ↗
Visual summary
3 visualsIllustrations explain the paper; charts are replotted from the paper's own table values.
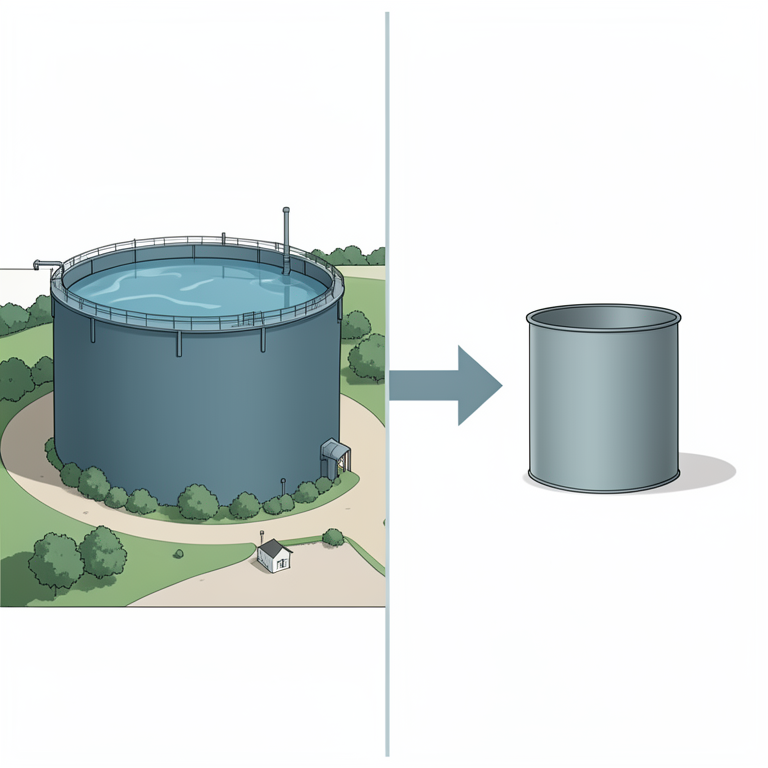
Demand vs Supply Gap
AI-generated conceptual illustration (A residential town landscape with water storage tanks and piping systems). It explains the idea and does not show study data.
View source evidence ↗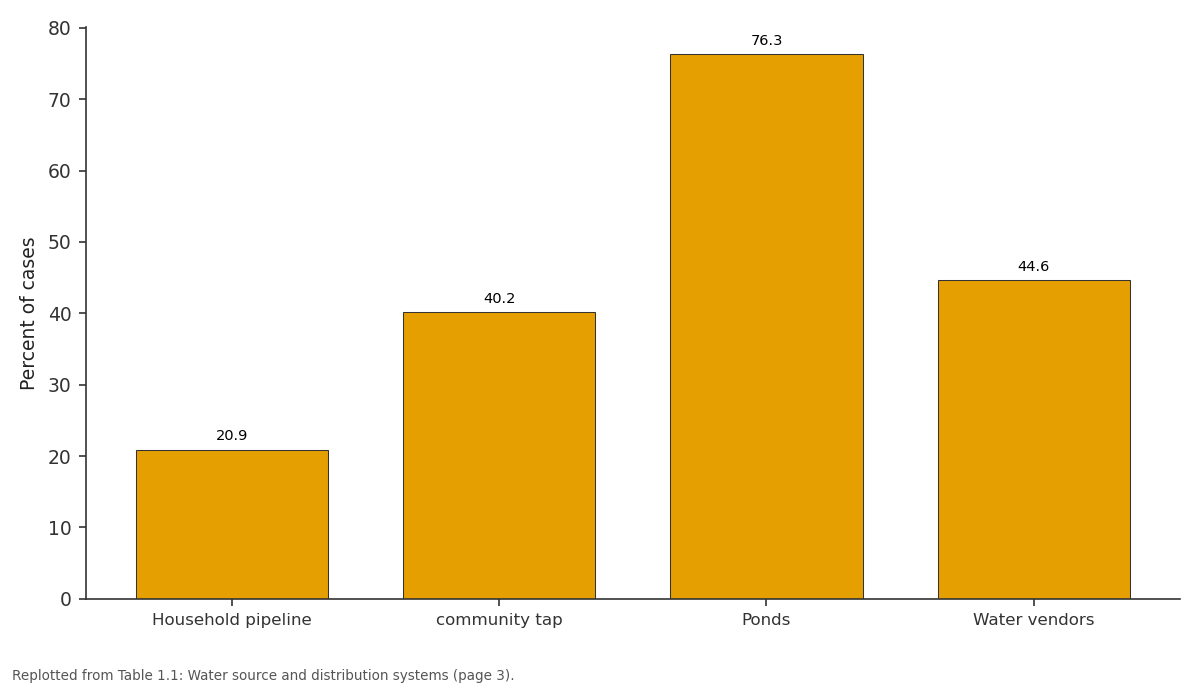
Percent of cases: Household pipeline vs community tap vs Ponds vs Water vendors
Replotted from Table 1 (page 3) of the original paper. Every bar is the paper's own table value.
View source evidence ↗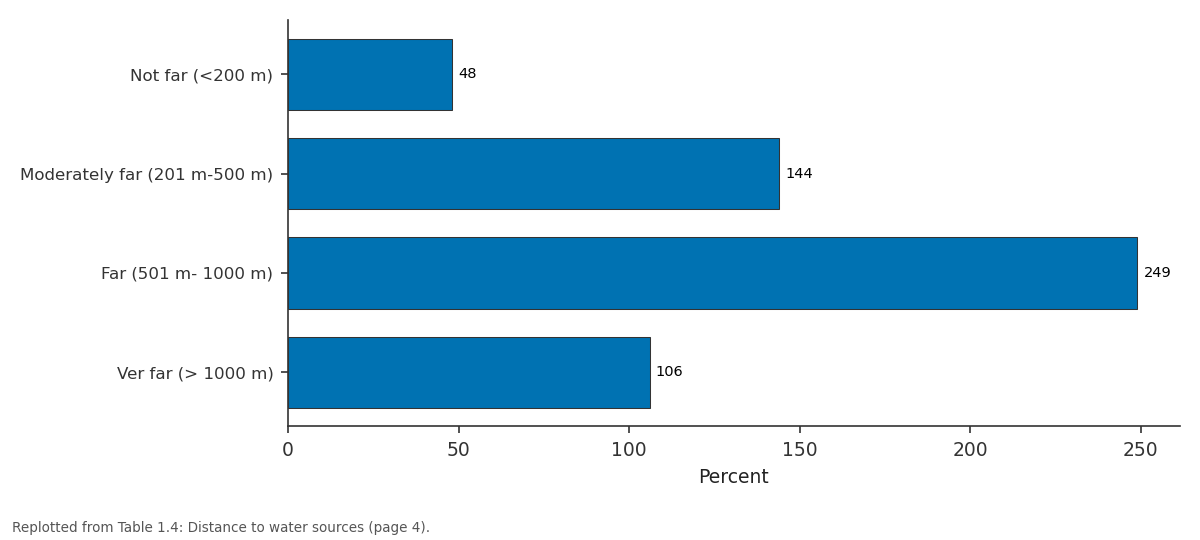
Frequency: Not far (<200 m) vs Moderately far (201... vs Far (501 m- 1000 m) vs Ver far (> 1000 m)
Replotted from Table 1 (page 4) of the original paper. Every bar is the paper's own table value.
View source evidence ↗Figures & tables
From the original paper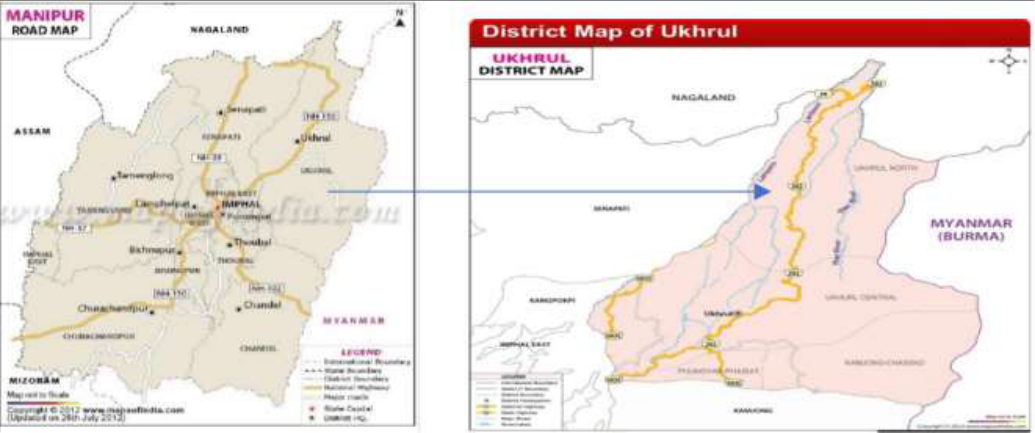 Figure 1
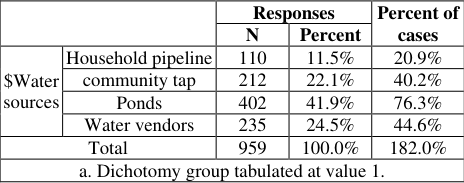 Table 1
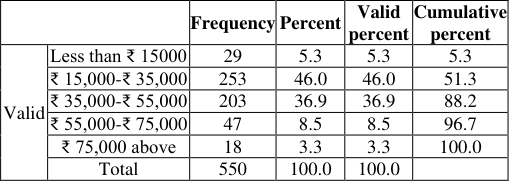 Table 1
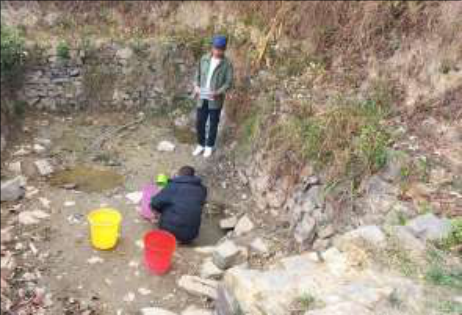 Figure 3
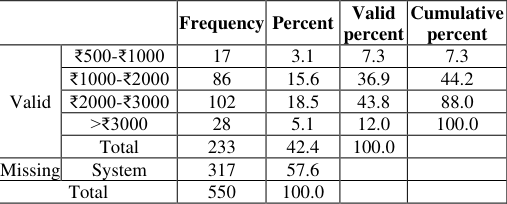 Table 1
 Table 1
 Table 1
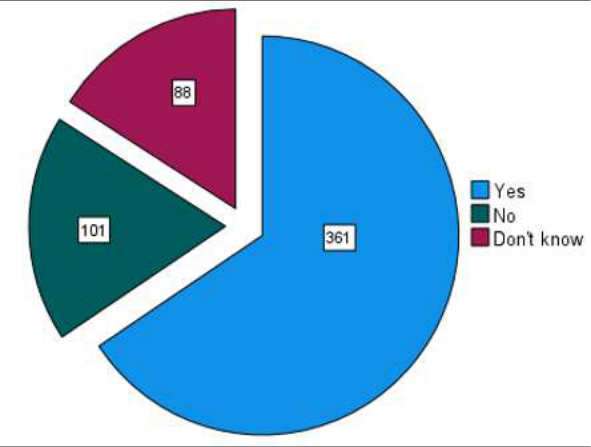 Figure 3
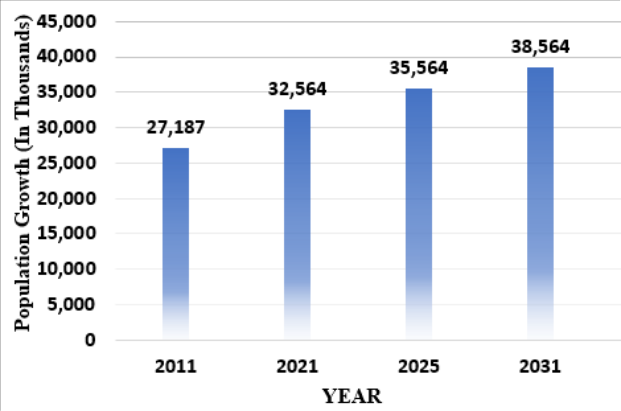 Figure 3
 Table 1
Introduction
Water is one of the most indispensable resources and the bloodstream of the biosphere, the base for socioeconomic growth and vital to sustaining human wellbeing [1] . When the annual water availability per person is less than 1700 m 3 , a nation is considered water-stressed. Approximately 2.8 billion people worldwide are estimated to experience water scarcity for at least one month out of the year [2] and by 2050, almost half of the population (57%) would undoubtedly reside in places where there is at least one month of water scarcity annually [3] . According to the study, by 2030 half of the population in India will have no access to drinking water [4] .
Physical and economic water scarcity
Water scarcity can be broadly classified into two types: physical and economic water scarcity. Physical scarcity arises when a region's demand exceeds its available water resources. Around 1.2 billion people, mostly in arid and semi-arid countries, live under physical scarcity, according to the Food and Agricultural Organisation (FAO) of the United Nations. It can be seasonal, and the number of people affected by this is expected to grow with time. Declining ground water levels and environmental deterioration all exacerbate the physical water scarcity that leads to pollution and negatively impacts ecosystems. Economic water scarcity is due to the lack of water infrastructure or poor management of water resources where infrastructure is in place. According to FAO estimates, over 1.6 billion people suffer from economic water scarcity [5] . Although the freshwater sources remain limited, the demand for water continues to rise due to population increase, urbanisation and industrialisation. 71% of the earth's surface is covered with water, of which 96.5% is salt water. Just 3% of the water on earth is potentially useful, with 2% of that amount frozen in ice-caps and glaciers. Preserving the environment while ensuring a sufficient and safe supply of water for human needs is the major global issue [6] . The situation of water scarcity is exacerbated by climate change, which results in erratic rainfall patterns and altered the replenishment of water sources and aquifers. The condition is further worsened by inadequate infrastructure and poor management. The scarcity of water has made children more susceptible, impacting their schooling to the point where, in certain areas, children skip school to collect water [7] . Currently, there are several obstacles standing in the way of the sustainable use of water resources, including population increase, a precarious economic environment, rising water demand, the need to provide food security, failing quality and ageing infrastructure set-up [8] . Water scarcity has been an ongoing challenges resident are facing every year for several months in spite of adequate rainfall in Ukhrul town, the headquarter of Ukhrul district. The water supply of Ukhrul town is obtain from two sources of Shirui village; Singuira kong and kokthi kong located 16 and 18 kms from the Treatment Plant Ukhrul. There are approximately 1500 houshold pipeline connectivity as per the data from the PHED, Ukhrul dated April 2022. The daily water demand stands at 17 lakh litres whereas, only 8-9 lakh litres are able to supply, twice in a week. This lapse in demand and supply of water has impacted the residents in many ways. Water scarcity becomes more evident in the dry months i.e., October to May, the residents of Ukhrul town experience acute water scarcity due to the drying up of springs and ponds. In addition, the pathetic condition is that people wake up before dawn every day to place the buckets up ahead to avoid long queue at the water supply point. Ukhrul town's water scarcity is largely caused by urbanisation, population growth, inadequate infrastructure, and deforestation. A lot of time and effort are expended, and sometimes a long search may not be obtained, thus the time available for other productive tasks is subsequently reduced. Most of the time, responsibilities of fetching water lie with women and children every day to gather water. The paper focusses on the current status and challenges of water scarcity faced by the people in Ukhrul town, Manipur.
Objectives of the study
The paper strives to achieve the following objectives To identify the major source of water available in the study area To assess some of the water scarcity challenges in the study area To recommend the potential future solutions strategies for addressing the shortage of water
Research design
The study was conducted using a combination of mixedmethods, quantitative and qualitative approaches, including a comprehensive study of the relevant literature and study design. The study further revealed that mixed-method research is a theoretical framework that provides direction on gathering and evaluating data from several sources in a single study [9] . The present study has been carried out in five localities at the micro level in the water scarcity regions of Ukhrul town.
The data for the present research was derived from the primary sources in the water scarcity localities-Hamleikhong, Phungreitang East, Greenland, Awontang and Ngashantang. The sites represent a diverse geographical coverage and suffers water scarcity.
The study employed purposeful sampling under nonprobability sampling was used to select the location of the study. The study was conducted with 550 respondents using simple random sampling method under probability sampling. 110 respondents are recorded each from the selected localities. The data collection was done during 2022-2023.
The key informants included the officials from the PHED, Government of Manipur, local community leaders and the respondents from the localities. Personal interviews were carried out with the locals, and the study incorporates personal field observation. Demographic variables are taken into consideration. The dependent variables are the sources of water, the challenges, the issues, the impact of water scarcity. Primary data on challenges of water scarcity were triangulated using secondary reviews. Secondary data includes journals, and relevant literatures. The secondary data concerning to the study have been collected from the Office of the Public Health Engineering Department, Ukhrul, Government of Manipur. SPSS version 27 was used to analyse the data.
Results and Discussion
Results and Discussion
Water sources in Ukhrul town
The major source of water for Ukhrul town is ponds, and the distribution system such as households pipeline connectivity from the PHE, community tap, and private water vendors are identified. The frequency table of the multiple response set (Table 1.1) shows that 76.3% and 44.6% are the most important source of water and distribution system for the residents, i.e., pond water and private water vendor. Ony 21% of the households has the pipeline connectivity, while, 40.2% are dependent on the community tap. As the frequency and duration of the time of the water supply remains unclear, majority of the households depended on the pond water owned either by the community or the individual.
| — | — | Frequency | Percent | Valid percent | Cumulative percent |
|---|---|---|---|---|---|
| Valid | Yes | 361 | 65.6 | 65.6 | 65.6 |
| No | 101 | 18.4 | 18.4 | 84.0 | |
| Don't know | 88 | 16.0 | 16.0 | 100.0 | |
| Total | 550 | 100.0 | 100.0 |
Table text extracted from the original PDF; superscript letters are shown inline. The original table image is below.
View original table image
| — | — | Frequency | Percent | Valid percent | Cumulative percent |
|---|---|---|---|---|---|
| Valid | Not far (<200 m) | 48 | 8.7 | 8.8 | 8.8 |
| Moderately far (201 m-500 m) | 144 | 26.2 | 26.3 | 35.1 | |
| Far (501 m- 1000 m) | 249 | 45.3 | 45.5 | 80.6 | |
| Ver far (> 1000 m) | 106 | 19.3 | 19.4 | 100.0 | |
| Total | 547 | 99.5 | 100.0 | ||
| Missing | System | 3 | .5 | ||
| Total | 550 | 100.0 |
Table text extracted from the original PDF; superscript letters are shown inline. The original table image is below.
View original table image
| — | — | Frequency | Percent | Valid percent | Cumulative percent |
|---|---|---|---|---|---|
| Valid | ₹500-₹1000 | 17 | 3.1 | 7.3 | 7.3 |
| ₹1000-₹2000 | 86 | 15.6 | 36.9 | 44.2 | |
| ₹2000-₹3000 | 102 | 18.5 | 43.8 | 88.0 | |
| >₹3000 | 28 | 5.1 | 12.0 | 100.0 | |
| Total | 233 | 42.4 | 100.0 | ||
| Missing | System | 317 | 57.6 | ||
| Total | 550 | 100.0 |
Table text extracted from the original PDF; superscript letters are shown inline. The original table image is below.
View original table image
| — | — | Frequency | Percent | Valid percent | Cumulative percent |
|---|---|---|---|---|---|
| Valid | Less than ₹ 15000 | 29 | 5.3 | 5.3 | 5.3 |
| ₹ 15,000-₹ 35,000 | 253 | 46.0 | 46.0 | 51.3 | |
| ₹ 35,000-₹ 55,000 | 203 | 36.9 | 36.9 | 88.2 | |
| ₹ 55,000-₹ 75,000 | 47 | 8.5 | 8.5 | 96.7 | |
| ₹ 75,000 above | 18 | 3.3 | 3.3 | 100.0 | |
| Total | 550 | 100.0 | 100.0 |
Table text extracted from the original PDF; superscript letters are shown inline. The original table image is below.
View original table image
| — | — | Responses | — | Percent of cases |
|---|---|---|---|---|
| N | Percent | |||
| $Water sources | Household pipeline | 110 | 11.5% | 20.9% |
| community tap | 212 | 22.1% | 40.2% | |
| Ponds | 402 | 41.9% | 76.3% | |
| Water vendors | 235 | 24.5% | 44.6% | |
| Total | 959 | 100.0% | 182.0% | |
| a. Dichotomy group tabulated at value 1. |
Table text extracted from the original PDF; superscript letters are shown inline. The original table image is below.
View original table image
Distribution of respondents with regard to their monthly income
Water scarcity in Ukhrul is largely pronounced in the localities of the selected areas which has led to the strain in women and children having the task of searching for water especially for domestic use. Over the years, Ukhrul town has faced many challenges related to water scarcity and management. Water scarcity affects people in many ways, and one area of their lives that is affected is their means of livelihood. It is evident from the Table 1.2; majority of the household's income falls below middle low income. Higher household income has better access to clean and freshwater, because they could purchase water from the water vendors frequently. On the other hand, households having low income could not afford the cost of clean drinking water, compelling them to depend on water ponds despite the challenges they faced while procuring water. It has been revealed that although access to water is a challenge for the entire population, households with lower incomes are particularly affected and are linked to water insecurity [10] . Household income is an important determinant to have an information about the socio-economic status of the household. Data regarding the income level of the sampled household is presented in Table 1.2. 5.3% of the sampled households had their monthly income below ₹15,000 (very low), while 46% of the household had a monthly income between ₹15,000-₹34,000 (low) and 37% of the respondents had a monthly income of ₹35,000-₹55,000(middle low) and 8.5% of the sampled household had their monthly income of ₹ 55,000-₹75,000 (middle high). Households having monthly income more than ₹75,000 (high) and above accounts for 3.3% of the sampled households. Sampled households had at least one earning member and some households had more than two earning members. The study found that households in Ukhrul town spend a certain amount of money on water procurement, The cost of water from private tankers is increasing, and residents are struggling with the shortage of water. The private water distributor in Ukhrul town appears to charge ₹900 for 1500 litres on average. Water rates are rising up even further as a result of suppliers having to pay taxes for some water sources. The distributor charged ₹1200-₹1500 for 1500 litres of water in Ukhrul town depending on the location where they obtain the water. Since this is practically expensive, water has become a scarce resource that most people find difficult to access. As presented in table 1.3, 7.3% of the households responded to spend ₹500-₹1000 for procuring water and 37% of households spend ₹1000-₹ 2000 for procuring water While, 43.8% of household responded to spend ₹2000-₹3000 for procuring water and 12% of household responded to spend more than Rs. ₹3000 in procuring the water in a month.
The majority of respondents offered similar justifications, arguing that low-income households have restricted access to clean water and that higher educational attainment improves one's prospects of finding well-paying employment and having sufficient resources to pay for improved access to clean, safe water [11,12] .
Distance and accessibility of the water sources
Access to water source is the basic human right. According to WHO, the water source must be within 1000 metres and the time for collection should not exceed 30 minutes [13] and each person requires 100 litres per day and each household's requirement is 400-600 litres of water to ensure the most basic needs for a healthy existence [14] . The distance between the houses to water sources pose significant challenges for the residents of Ukhrul town. The longer the distance to water sources, people may have limited access to clean water for drinking and other household purposes [15] . From the study, a lot of time and energy are spent in the collection of water. Table 1.4 shows most of the residents 45.5% travelled within 500-1000 m to access to the water sources, 26.3% of the residents walked 201 m to 500 m to fetch water, 19.4% of the residents quoted very far i.e., they travelled >1000 m to gather the water from the sources and 8.8% stated 'not far' i.e., <200 m from their residents.
Water fetching is a time-consuming and challenging task which may reduce the amount of time available for other activities. The respondents argued that the during the dry months they spent 3-4 hours in fetching water which is a challenging task for them. In addition to that, the interviews with the respondents revealed that accessing to water especially during the dry months from November to May the residents are compelled to walk for several distances in scorching heat to fetch water for their daily use and spent their valuable time, forming queues before sunrise for their turn to get few buckets of water. These findings shared similar view that in addition to child care, wage work, and economic pursuits, the time saved by not having to bring water from farther away sources can be put to many other beneficial uses [16,17] .
Water access by seasons (Monsoon and Dry Seasons)
The rainfall in monsoon was comparatively higher than other seasons such as autumn, winter, spring (October-May) in the region. Ukhrul town, Ukhrul district had a bimodal rainfall pattern, occurring from June-September, (Monsoon months) and October-May (dry months) when the rainfall is less. In line with this result, studies reported that there is seasonal rainfall pattern and variability with peak rainfall in the months of May-June and short rainfall cycle from October-November [18] . The existence of two distinct rainfall season is widely believed to have caused by the Inter-Tropical Convergence Zone and associated atmospheric circulations [19,20] . These seasonal differences in the rainfall pattern make water available in water bodies such as springs, streams, and ponds during the monsoon season. From the field survey conducted in all the study localities, the residents are relying heavily on pond and spring water. Based on the respondent's interview, the residents of the study areas, practices direct collection of rainwater in barrels, tanks and jerrycans and used for cleaning, washing and various household activities. Water collection from the springs and ponds for drinking water was considered problematic due to heavy rains and mudflows and becomes polluted. Further during the dry months, acute water scarcity was noted, there were notable signs of dried water sources, and no rainfall or rainwater available for the households. Thus, the availability of water in different water sources varies and influence with seasons [21] .
Respondents on impact on children
According to the survey, 66% of participants believed that children's academic performance is impacted by water scarcity. 18% said "no," indicating the absence of participation from their children in the water gathering process, and 16% said they were unsure. When students engaged in collection of water, they would find it difficult to concentrate and perform their academic duties as they are distracted by their adverse emotions. Additionally, they are more likely to skip class, which hinders the educational process. Every day, children spend 200 million hours spent collecting water. That is an enormous amount of time that could have been used for academic purposes. As a result, the student loses out on important chances to learn and interact socially with their peers in the classroom. This eventually has an impact on their academic performance, and if nothing is done to address it, it can have an impact on their careers in the future [22] . Children who live in communities without adequate access to water sources are more likely to have cognitive deficits and to be wasted, anaemic, and stunted. Families without access to water have a higher risk of exposing their children to unhealthful living conditions [23] . The increase in the population in the recent decades has exerted severe pressure on the topographical aspects and water resources in Ukhrul town. Ukhrul town had a population of 27,187 in the 2011 census and it was estimated to be around 32,564 in 2021 (Figure 3). It is evident that the total population in Ukhrul town increased steadily over all the decades with the varying growth rate from one decade to the other. The shifting of people from the villages to Ukhrul town in search of better opportunities and a means of livelihood is one reason contributing to the population growth. A per the data received form the PHED, Ukhrul the water demand in Ukhrul was 17 lakh litres per day, the discharge during dry season was 7 lakh litres and 17 lakh litres in the monsoon season in 2021 (Table 1.6) and it is believed that the demand for water will increase as the population increases in the coming years. Despite having abundant rainfall during the monsoon season in the region, there is lack of water in the region.
Local water governance: The challenges encountered
One of the most important areas in control of the water resources and services is the local water governance. Effective water governance is necessary to manage water resources in an integrated and successful manner which offers an administrative, economic, and legal framework [24] . Under the administrative supervision of the State government, the PHE Department manages the Ukhrul district's water supply and implements water supply projects mostly through PHED. Planning and implementing water related projects at the local level is the primary responsibility and to initiate various schemes that are helpful in replenishing water resources. From the interviews with the officials of the PHED, several difficulties encountered by the PHED were stated. Generally, the tribals settled in the hilly regions and these topographical features being one reason the department finds it challenging to utilise the lost natural momentum and distribute water evenly in Ukhrul town. Additionally, the department is short of the manpower to handle public demands and operate effectively which faces significant challenges in providing enough water to the public because of the limited availability of water at the sources. It is beyond the department's capabilities without appropriate development or the assistance of new water sources. Furthermore, springs have turned into parches and aquifers, and water bodies are drying up as a result of acres of forest burned and resources exploited without control or restoration practices. This continual deforestation has resulted in the declining water capacity of an area; as a result, the water seeping underground that comes as spring water reduces. The engineers and officials are working to do field investigation, preparation and maintenance and to ensure that the residents get adequate water, identification of prominent water resources and ensure that the present water supply is adequate.
Recommendations and the way forward
In order to address water scarcity and significantly lower the number of people affected by it, the Sustainable Development Goal 6 outlines how water use and scarcity should be addressed by 2030, substantially increasing wateruse efficiency across all sectors and ensuring the sustainable withdrawals and supply of fresh water [25] . A multifaceted approach is needed to address the water scarcity. Adopting effective water management techniques, such as managing watersheds and practising rainwater harvesting can help replenish water sources. The method of rain water harvesting system being environment friendly and effective can be widely used to solve or minimize the issue of water scarcity. This allows to reduce scarcity and minimize pressure on groundwater and other natural water sources. In light of the growing demand of water, it is imperative to construct water reservoir/tanks at the respective localities is required in Ukhrul town. During the monsoon months, the rain water can be preserved for use in dry months. There is a need for improved system of water such as pipeline connectivity, to each and every household. Water recycling and reuse of water are some of the reliable techniques which have been recognized as adaptive solutions to water scarcity, one primary method of water reuse is the grey water recycling. Awareness on education and judicious use of water is essential. Education is the key to addressing the water crisis. In order to cope with the future water crisis, it is essential to have significant changes in all types of consumption to deal with future water scarcity, from individual use to the supply chains of huge corporations. Afforestation policy must be implemented as it helps in improving groundwater quality. Afforestation in river catchment areas contributes to water conservation, soil erosion control, decreased flood intensity, and river flow regulation. It is imperative that residents, organisations and government all take proactive approach to the sustainable development and management of water resources. Preserving and restoring water catchment areas, together with strategically investing on additional dams are essential to increasing the availability of a sustainable water supply.
Conclusion
The present paper attempted to explore the challenges faced by the people as a result water scarcity in Ukhrul town. A key concern for the majority of people in Ukhrul is access to safe drinking water and clean water. Water scarcity presents intricate challenges that are having significant impacts on individuals and communities. Growing water demand exceeds the available water supply have turned into a prominent challenge to livelihood in several parts of the Ukhrul town. In addition, social tensions and individual conflicts might arise from competition for the limited resources. Furthermore, the pressure on the children can affect their education in their daily life can hinder their academic performance. Improved water management, developing community-based solutions, and making infrastructure investments are essentially required to address these challenges. Effective solutions must be adapted to local contexts and must be inclusive of all stakeholders to ensure equitable access to vital resources.
Acknowledgement
AcknowledgementsThe authors would like to thank the respondents for their useful information and suggestions. The authors also thank the Executive Engineer, Assistant Engineer and the staffs of the Water Supply, PHED Ukhrul, Government of Manipur for their valuable information and support.
Figures and tables from the paper
References
22 in the original paper- Falkenmark M. Growing water scarcity in agriculture: Future challenge to global water security. Philos Trans A Math Phys Eng Sci. 2003;358:1917-1920. DOI:10.1098/rsta.2012.0410.
- Nivithra S, Sreeya B. Public opinion on water scarcity with special reference to Chennai. Int J Innov Technol Explor Eng. 2019;8(11):3184-3187. DOI:10.35940/ijitee.K2513.0981119.
- Boretti A, Rosa L. Reassessing the projections of the World Water Development Report. NPJ Clean Water. 2019;2(1). DOI:10.1038/s41545-019-0039-9.
- Nivala J, Murphy C, Troesch S, Wallace S, Esser D. Intensified and modified wetland designs. Sustain Sanit Pract. 2014;(18):15-20. Available from: https://www.researchgate.net/publication/303149110.
- Petruzzello M. Water Scarcity. Encyclopedia Britannica. Published May 28, 2023.
- Chopra A, Ramachandran P. Mapping water scarcity across major states of India. Econ Polit Wkly. 2023;58(32):46-53.
- Mulwa F, Li Z, Fangninou FF. Water scarcity in Kenya: Current status, challenges and future solutions. Open Access Lib J. 2021;8(1):1-15. DOI:10.4236/oalib.1107096.
- Angelakis AN, Voudouris KS, Tchobanoglous G. Evolution of water supplies in the Hellenic world focusing on water treatment and modern parallels. Water Supply. 2020;20(3):773-786. DOI:10.2166/ws.2020.032.
- Adom RK, Simatele MD, Reid M. Assessing the social and economic implications on water security in the Nelson Mandela Bay Metropolitan Municipality, Eastern Cape of South Africa. J Water Health. 2023;21(7):939-955. DOI:10.2166/wh.2023.078.
- Deck J, Roy S. Poorer people pay more for clean water, UNESCO report finds. Global Citizen. Published March 23, 2019.
- Muazzinah M, Majid MSAbd, Syathi PB. What determines households' willingness to pay for clean water? Econ Dev Anal J. 2020;9(4):402-413. DOI:10.15294/edaj.v9i4.39988.
- UNDESA. International Decade for Action "Water for Life" 2005-2015. 2010.
- Ki-moon B. The human right to water and sanitation. 2005. Accessed April 5, 2024. Available from: www.un.org/waterforlifedecade.
- Nygren BL, O'Reilly CE, Rajasingham A, et al. The relationship between distance to water source and moderate-to-severe diarrhea in the global enterics multi-center study in Kenya, 2008-2011. Am J Trop Med Hyg. 2016;94(5):1143-1149. DOI:10.4269/ajtmh.15-0393.
- Abanyie SK, Ampadu B, Frimpong NA, Yahans Amuah EE. Impact of improved water supply on livelihood and health: Emphasis on Doba and Nayagnia, Ghana. Innov Green Dev. 2023;2(1):1-9. DOI:10.1016/j.igd.2023.100033.
- Whittington D, Mu X, Roche R. Calculating the value of time spent collecting water: Some estimates for Ukunda, Kenya. World Dev. 1990;18(2):269-280.
- Habte A, Worku W, Mamo G, Ayalew D, Gayler S. Rainfall variability and its seasonal events with associated risks for rainfed crop production in Southwest Ethiopia. Cogent Food Agric. 2023;9(1):120. DOI:10.1080/23311932.2023.2231693.
- Dunning CM, Black ECL, Allan RP. The onset and cessation of seasonal rainfall over Africa. J Geophys Res Atmos. 2016;121(11):11405-11424. DOI:10.1002/2016JD025428.
- Mera GA. Drought and its impacts in Ethiopia. Weather Clim Extrem. 2018;22:24-35. DOI:10.1016/j.wace.2018.10.002.
- Chakma S, Hossain MN, Islam MK, Hossain MM, Sarker MNI. Water scarcity, seasonal variation and social conflict in mountain regions of Bangladesh. Grassroots J Nat Resour. 2021;4(1):62-79. DOI:10.33002/nr2581.6853.040105.
- Bagayas M. Water scarcity affects education - International Education Day. Kraken Sense. Published January 23, 2024.
- Frimpong J, Adamtey R, Pedersen AB, et al. A review of the design and implementation of Ghana's National Water Policy (2007). Water Policy. 2021;23(5):11701188. DOI:10.2166/wp.2021.042.