
Research article · 2024 · Full text
International Journal of Advanced Chemistry ResearchTD-DFT study of palladium (II) complexes with 1-(2′-hydroxy-1′-naphthylazo)-2-hydroxynaphthalene ligand
Volume 6(2) · Pages 181–187 · DOI: 10.33545/26646781.2024.v6.i2c.242 ↗
Research areasMetal complexes synthesis and propertiesMagnetism in coordination complexesLanthanide and Transition Metal Complexes
Abstract
Author-writtenThe electronic structures of the palladium (II) complexes with 1-(2′-hydroxy-1′-naphthylazo)-2-hydroxynaphthalene ligand have been calculated using a TD-DFT (time-dependent density functional theory) model and the simulated spectra of the palladium (II) complexes are in close agreement with the experimental spectra.
Summary
Source-checkedPlain-language reading of the full paper, prepared with AI and checked against the text. Each point links to the authors' own words.
The question
- The study aims to use time-dependent density functional theory (TD-DFT) calculations to better understand the electronic structure and the nature of spectral transitions in these palladium (II) complexes. View evidence ↗
What they did
- The researchers performed calculations using the TD-DFT formalism as implemented in the ADF2007 software. View evidence ↗
- The computational method employed LDA with VWN parametrization for the SCF step, Becke and Perdew-Wang gradient corrections for exchange and correlation, and ALDA for the XC kernel in the post-SCF step. View evidence ↗
- An uncontracted triple-STO basis set with a polarization function was used for all atoms in the TD-DFT calculations. View evidence ↗
- The optical spectra calculations considered the 70 lowest spin-allowed singlet-singlet transitions. View evidence ↗
- The effects of the solvent were modeled using the Conductor-Like Screening Model (COSMO) within the ADF software. View evidence ↗
What they found
- The computed HOMO-LUMO energy gaps were 1.806 eV for complex 1a and 1.971 eV for complex 1b. View evidence ↗
- The highest occupied molecular orbitals (HOMOs) for both complexes (80a for 1a and 108a for 1b) are primarily based on the naphtholato fragment of the ligand. View evidence ↗
- The lowest unoccupied molecular orbitals (LUMOs) for 1a (81a) and 1b (109a) are mostly concentrated on the naphthaloto fragment of the ligand, showing minimal contribution from palladium d-orbitals. View evidence ↗
- For complex 1b, the low-lying absorption band at 508 nm corresponds to a HOMO-to-LUMO transition and is dominated by ILCT character. View evidence ↗
- The TD-DFT simulated absorption spectra for both complexes in dichloromethane showed a good correlation with the experimentally observed spectra. View evidence ↗
What it means
- The authors conclude that low-energy absorptions in these complexes result from ILCT transitions with MLCT admixtures, while high-energy absorptions are caused by MLCT and ligand-to-ligand charge transfer (LLCT) transitions. View evidence ↗
Figures & tables
From the original paper Table 1
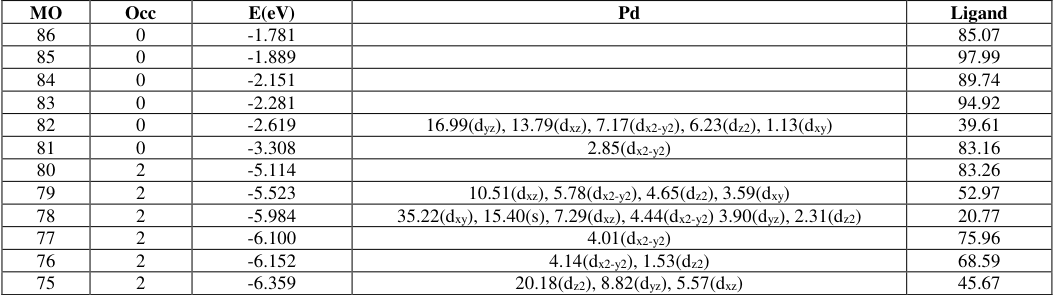 Table 2
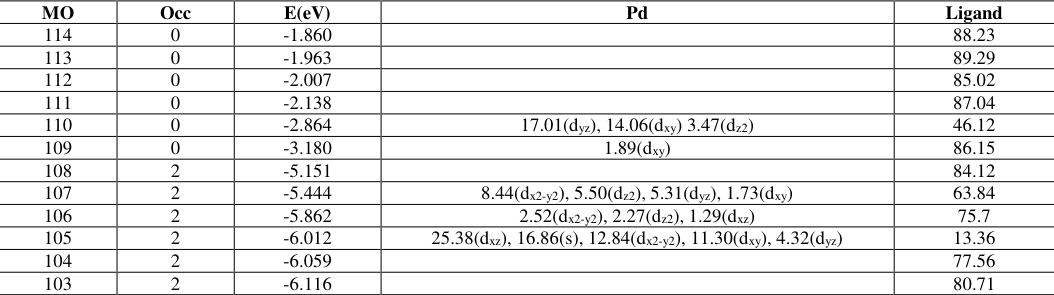 Table 3
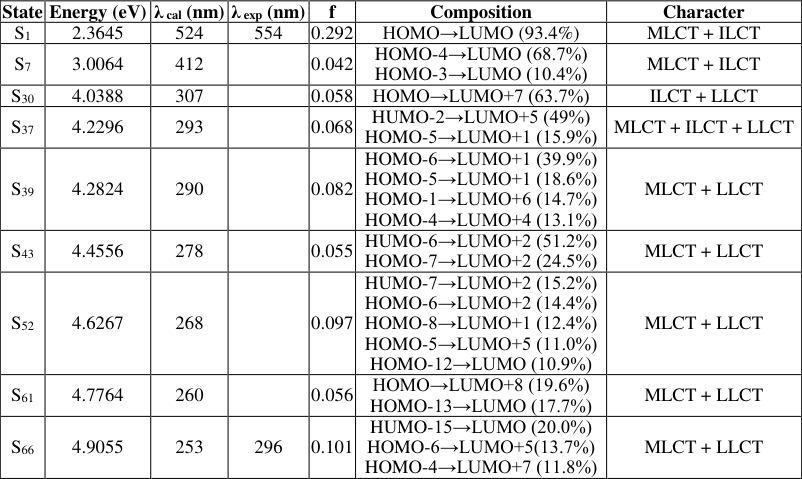 Table 4
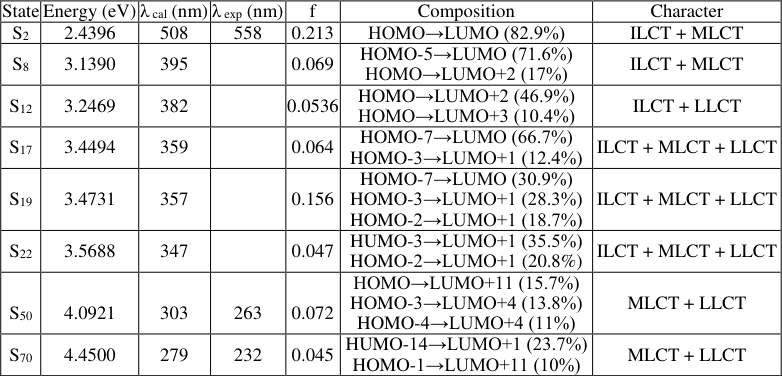 Table 5
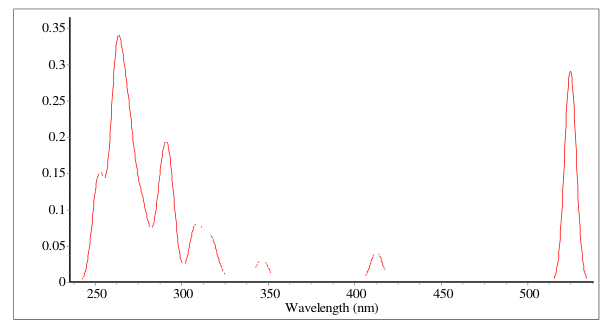 Figure 1
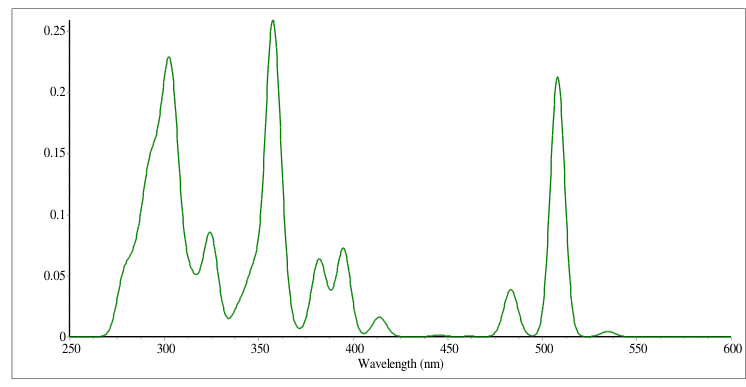 Figure 2
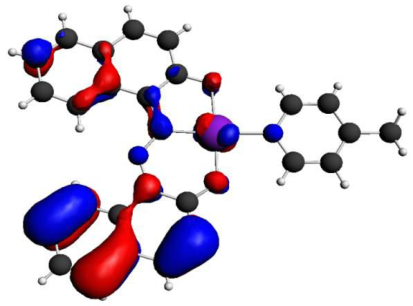 Figure 3
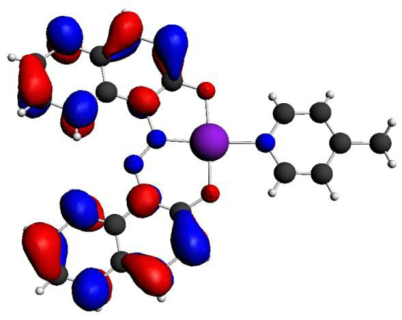 Figure 3
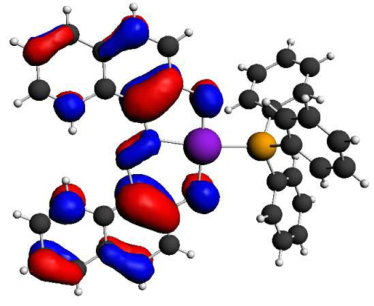 Figure 3
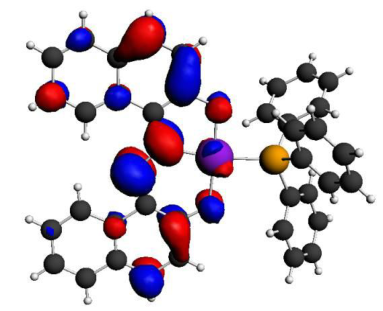 Figure 3
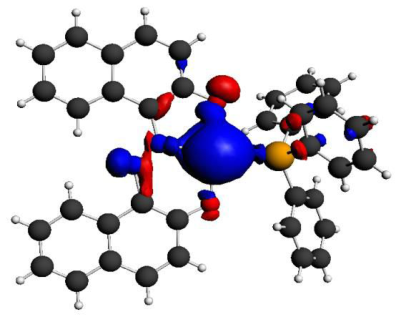 Figure 4
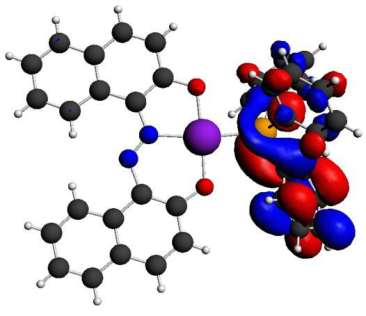 Figure 4
Introduction
We have already reported the synthesis and characterization of palladium (II) complexes with 1-(2′-hydroxy-1′-naphthylazo)-2-hydroxynaphthalene (H2L) ligand, [Pd(L)(D)], 1a and 1b, in presence of neutral Lewis base, D (D = 4-picoline and PPh3 respectively) [1] . The crystal structure of the cyclopalladates has revealed that diazene ligand H2L bind to the metal ion as dianionic tridentate O,N,O donors and the fourth coordination position is occupied by N of donor 4-picoline (1a) or P of triphenylphosphine (1b) [2] . The tetra co-ordination around Pd (II) is almost planar. In continuation of our previous work, herein we wish to report the TD-DFT calculation for better understanding of the electronic structure of palladium (II) complexes and the nature of spectral transitions.
Method and computational details
The calculations have been performed within the TD-DFT formalism as implemented in ADF2007 [3][4][5][6][7][8] . Two approximations are generally made: one for the XC potential, and one for the XC kernel, which is the functional derivative of the time-dependent XC potential with respect to density. We used LDA (local density approximation) including the VWN parametrization [9] in the SCF step and Becke [10] and Perdew-Wang [11] gradient corrections to the exchange and correlation respectively and Adiabatic Local Density Approximation (ALDA) for the XC kernel, in the post-SCF step. TD-DFT calculations have been performed with the uncontracted triple-STO basis set with a polarization function for all atoms. In the calculation of the optical spectra, 70 lowest spin-allowed singlet-singlet transitions have been taken into account. Transition energies and oscillator strengths have been interpolated by a Gaussian convolution with a s of 0.2 eV. Solvent effects were modelled by the "Conductor-Like Screening Model" (COSMO) [12][13] of solvation as implemented in ADF.
Results and Discussion
The palladium (II) complexes 1a and 1b (Scheme 1) are soluble in common organic solvents and produce pink solution in dichloromethane. The spectral data of the palladium cyclometallates are given in Table 1 [1] . The cyclopalladates (1a and 1b) show several absorptions in the ultraviolet and visible region. The bands appearing in the ultraviolet region with high molar extinction coefficient are generally thought to be arisen from intraligand charge transfer transition whereas absorptions in the visible region are attributed to the metal-to-ligand charge transfer transition [14] . In order to gain further insight into the nature of the absorptions, TD-DFT calculations of both the cyclopalladates have been done. The coordinates of these cyclopalladates are directly imported from their crystal data. The frontier molecular orbital compositions, excitation energies and oscillator strengths for the various absorption bands have been presented in Table 2-5, together with the composition of the solution vectors in terms of most relevant transitions.
| MO | Occ | E(eV) | Pd | Ligand |
|---|---|---|---|---|
| 86 | 0 | -1.781 | 85.07 | |
| 85 | 0 | -1.889 | 97.99 | |
| 84 | 0 | -2.151 | 89.74 | |
| 83 | 0 | -2.281 | 94.92 | |
| 82 | 0 | -2.619 | 16.99(dyz), 13.79(dxz), 7.17(dx2-y2), 6.23(dz2), 1.13(dxy) | 39.61 |
| 81 | 0 | -3.308 | 2.85(dx2-y2) | 83.16 |
| 80 | 2 | -5.114 | 83.26 | |
| 79 | 2 | -5.523 | 10.51(dxz), 5.78(dx2-y2), 4.65(dz2), 3.59(dxy) | 52.97 |
| 78 | 2 | -5.984 | 35.22(dxy), 15.40(s), 7.29(dxz), 4.44(dx2-y2) 3.90(dyz), 2.31(dz2) | 20.77 |
| 77 | 2 | -6.100 | 4.01(dx2-y2) | 75.96 |
| 76 | 2 | -6.152 | 4.14(dx2-y2), 1.53(dz2) | 68.59 |
| 75 | 2 | -6.359 | 20.18(dz2), 8.82(dyz), 5.57(dxz) | 45.67 |
Table text extracted from the original PDF; superscript letters are shown inline. The original table image is below.
View original table image
| Compound | λmax/nm (ε / M-1 cm-1) |
|---|---|
| 1a | 296 (11,200), 520 (4,550), 554 (7,050) |
| 1b | 232 (57,450), 263 (24,860), 523 (7,630), 558 (10,720) |
Table text extracted from the original PDF; superscript letters are shown inline. The original table image is below.
View original table image
International Journal of Advanced
Orbital analysis: Both the palladium (II) complexes have been found to have similar molecular orbitals. A detailed analysis of the highest occupied and lowest unoccupied molecular orbitals of 1a and 1b are presented in Table 2 and 3 respectively, where orbital energies and composition in terms of atomic contributions are reported. The highest occupied molecular orbitals (HOMOs) of 1a (80a) and 1b (108a) are mostly based on the naphtholato fragment of the ligand, resulting from the combination of the carbon and nitrogen p orbitals. In HOMO-1, substantial amount of Pd-d character (25% for 1a and 21% for 1b) contribution has been noted for both the complexes. For the complex 1a, HOMO-2 (78a) is localized mostly on palladium (69%) whereas in 1b, HOMO-3 (105a) is mostly palladium based (71% d character). The next three lowest highest occupied molecular orbitals of 1a (77a, 76a and 75a) have 4%, 6% and 35% metal character respectively. The calculations show that the lowest unoccupied molecular orbital of both the cyclopalladates 1a and 1b (81a and 109a respectively) are mostly concentrated on the naphthaloto fragment of the ligand, with very little contribution from the d(Pd) orbitals. The LUMO+1 of the cycolpalladates has substantial metal d character (45% for 1a and 35% for 1b). LUMO+2 (83a) and LUMO+4 (85a) of 1a molecular orbitals are mostly concentrated on the Lewis base, 4-picoline resulting from the combination of the p-orbitals of carbon and nitrogen which mix in an antibonding fashion whereas LUMO+2 (111a) and LUMO+3 (112a) of 1b are largely based on the donor molecule, triphenylphosphine. The other LUMO's have predominant ligand character (Table 2 and3). The HOMO-LUMO gaps in 1a and 1b have been computed to be 1.806 and 1.971 eV respectively. The absorption spectra of cyclopalladates obtained using TD-DFT procedure showed a number of transitions within the visible and ultraviolet region and good correlation with the experimentally observed spectra of 1a and 1b in dichloromethane are observed (Table 4-5 and Fig. 12). As shown in Table 4, the first absorption band at ca. 524 nm involves excitation from the highest occupied to the lowest unoccupied molecular orbital and has mixed character of ILCT and MLCT transition. The most intense transition observed in 1a in ultraviolet region (ca. 253 nm) involves multi excitations from 65a (HOMO-15), 74a (HOMO-6) and 76a (HOMO-4) to 81a (LUMO), 86a (LUMO+5) and 88a (LUMO+7) respectively. These transitions have a mixed character of MLCT and LLCT. The assignment of the characters of all other excited states is presented in Table 4. The simulated electronic spectrum and isodensity surface plot of the relevant MO's of 1a is presented in Fig. 1 and3 respectively.
| State | Energy (eV) | λ cal (nm) | λ exp (nm) | f | Composition | Character |
|---|---|---|---|---|---|---|
| S1 | 2.3645 | 524 | 554 | 0.292 | HOMO→LUMO (93.4%) | MLCT + ILCT |
| S7 | 3.0064 | 412 | 0.042 | HOMO-4→LUMO (68.7%) HOMO-3→LUMO (10.4%) | MLCT + ILCT | |
| S30 | 4.0388 | 307 | 0.058 | HOMO→LUMO+7 (63.7%) | ILCT + LLCT | |
| S37 | 4.2296 | 293 | 0.068 | HUMO-2→LUMO+5 (49%) HOMO-5→LUMO+1 (15.9%) | MLCT + ILCT + LLCT | |
| S39 | 4.2824 | 290 | 0.082 | HOMO-6→LUMO+1 (39.9%) HOMO-5→LUMO+1 (18.6%) HOMO-1→LUMO+6 (14.7%) HOMO-4→LUMO+4 (13.1%) | MLCT + LLCT | |
| S43 | 4.4556 | 278 | 0.055 | HUMO-6→LUMO+2 (51.2%) HOMO-7→LUMO+2 (24.5%) | MLCT + LLCT | |
| S52 | 4.6267 | 268 | 0.097 | HUMO-7→LUMO+2 (15.2%) HOMO-6→LUMO+2 (14.4%) HOMO-8→LUMO+1 (12.4%) HOMO-5→LUMO+5 (11.0%) HOMO-12→LUMO (10.9%) | MLCT + LLCT | |
| S61 | 4.7764 | 260 | 0.056 | HOMO→LUMO+8 (19.6%) HOMO-13→LUMO (17.7%) | MLCT + LLCT | |
| S66 | 4.9055 | 253 | 296 | 0.101 | HUMO-15→LUMO (20.0%) HOMO-6→LUMO+5(13.7%) HOMO-4→LUMO+7 (11.8%) | MLCT + LLCT |
Table text extracted from the original PDF; superscript letters are shown inline. The original table image is below.
View original table image
Fig 2: Spectrum of 1b computed in dichloromethane
On the other hand, the low-lying absorption band at 508 nm for 1b corresponds to the electronic transition from HOMO to LUMO and has dominant ILCT character (Table 5). The calculated most intense transition observed in 1b at 303 nm involves multiexcitation from HOMO (108a) to LUMO+11 (120a), HOMO-3 (105a) to LUMO+4 (113a) and HOMO-4 (104a) to LUMO+4 (113a) with MLCT and LLCT character. The simulated electronic spectrum and isodensity surface plot of the relevant MO's of 1b is shown in Fig. 2 and 4 respectively.
| State | Energy (eV) | λ cal (nm) | λ exp (nm) | f | Composition | Character |
|---|---|---|---|---|---|---|
| S2 | 2.4396 | 508 | 558 | 0.213 | HOMO→LUMO (82.9%) | ILCT + MLCT |
| S8 | 3.1390 | 395 | 0.069 | HOMO-5→LUMO (71.6%) HOMO→LUMO+2 (17%) | ILCT + MLCT | |
| S12 | 3.2469 | 382 | 0.0536 | HOMO→LUMO+2 (46.9%) HOMO→LUMO+3 (10.4%) | ILCT + LLCT | |
| S17 | 3.4494 | 359 | 0.064 | HOMO-7→LUMO (66.7%) HOMO-3→LUMO+1 (12.4%) | ILCT + MLCT + LLCT | |
| S19 | 3.4731 | 357 | 0.156 | HOMO-7→LUMO (30.9%) HOMO-3→LUMO+1 (28.3%) HOMO-2→LUMO+1 (18.7%) | ILCT + MLCT + LLCT | |
| S22 | 3.5688 | 347 | 0.047 | HUMO-3→LUMO+1 (35.5%) HOMO-2→LUMO+1 (20.8%) | ILCT + MLCT + LLCT | |
| S50 | 4.0921 | 303 | 263 | 0.072 | HOMO→LUMO+11 (15.7%) HOMO-3→LUMO+4 (13.8%) HOMO-4→LUMO+4 (11%) | MLCT + LLCT |
| S70 | 4.4500 | 279 | 232 | 0.045 | HUMO-14→LUMO+1 (23.7%) HOMO-1→LUMO+11 (10%) | MLCT + LLCT |
Table text extracted from the original PDF; superscript letters are shown inline. The original table image is below.
View original table image
Acknowledgement
Acknowledgements
Figures and tables from the paper
| MO | Occ | E(eV) | Pd | Ligand |
|---|---|---|---|---|
| 114 | 0 | -1.860 | 88.23 | |
| 113 | 0 | -1.963 | 89.29 | |
| 112 | 0 | -2.007 | 85.02 | |
| 111 | 0 | -2.138 | 87.04 | |
| 110 | 0 | -2.864 | 17.01(dyz), 14.06(dxy) 3.47(dz2) | 46.12 |
| 109 | 0 | -3.180 | 1.89(dxy) | 86.15 |
| 108 | 2 | -5.151 | 84.12 | |
| 107 | 2 | -5.444 | 8.44(dx2-y2), 5.50(dz2), 5.31(dyz), 1.73(dxy) | 63.84 |
| 106 | 2 | -5.862 | 2.52(dx2-y2), 2.27(dz2), 1.29(dxz) | 75.7 |
| 105 | 2 | -6.012 | 25.38(dxz), 16.86(s), 12.84(dx2-y2), 11.30(dxy), 4.32(dyz) | 13.36 |
| 104 | 2 | -6.059 | 77.56 | |
| 103 | 2 | -6.116 | 80.71 |
Table text extracted from the original PDF; superscript letters are shown inline. The original table image is below.
View original table image
References
7 in the original paper- equations. Journal of Computer Physics Communications. 1999;118(2-3):119-138.
- Vosco SH, Wilk L, Nusair M. Accurate spindependent electron liquid correlation energies for local spin density calculations: a critical analysis. Canadian Journal of Physics. 1980;58(8):1200-1211.
- Becke AD. Density-functional exchange-energy approximation with correct asymptotic behavior. Physical Review A. 1988;38(6):3098-3100.
- Perdew JP, Wang Y. Accurate and simple analytic representation of the electron-gas correlation energy. Physical Review B. 1992;45(23):13244-13249.
- Klamt A, Schüürmann GJ, COSMO: a new approach to dielectric screening in solvents with explicit expressions for the screening energy and its gradient. Journal of the Chemical Society, Perkin Transactions 2. 1993;799-805.
- Klamt A, Jonas V. Treatment of the outlying charge in continuum solvation models. Journal of Chemical Physics. 1996;105(22):9972-9981.
- Dutta S, Peng S, Bhattacharya S. Synthesis, structure and redox properties of some 2-(arylazo)phenolate complexes of rhodium(III). Journal of the Chemical Society, Dalton Transactions. 2000;4623-4627.