
Research article · 2024 · Full text
International Journal of Veterinary Sciences and Animal HusbandryTylosin can alter the disposition kinetics of Sulphadimidine in goats
Volume 9(6) · Pages 428–431 · DOI: 10.22271/veterinary.2024.v9.i6g.1909 ↗
Research areasAntibiotics Pharmacokinetics and Efficacy
Abstract
Author-writtenThe effect of Tylosin on the pharmacokinetics of sulphadimidine was evaluated using West African Dwarf (WAD) goats. In the experiment, eight (8) WAD goats comprising 4 males and 4 females, aged 1-2 years were used for the study. We administered sulphadimidine at a dose of 100 mg/kg body weight to goats in group one on the left gluteal muscle, while the goats in group two received sulphadimidine at a dose of 100mg/kg and tylosin at a dose of 10mg/kg on the right gluteal muscle. Blood samples were collected in all the experiments for a period of 48 h. Plasma samples obtained were analysed using spectrophotometer. Tylosin resulted in significant changes in the kinetics of sulphadimidine in WAD goats. The study concludes that sulphadimidine should be combined with tylosin in the treatment of bacterial diseases both of the gastrointestinal tract and the respiratory tract due to the synergistic interaction between the two drugs.
Summary
Source-checkedPlain-language reading of the full paper, prepared with AI and checked against the text. Each point links to the authors' own words.
Why it matters
- Sulphadimidine is a common veterinary antibacterial agent valued for its low cost and effectiveness against various bacterial and protozoan diseases. View evidence ↗
- Tylosin is a macrolide antibiotic used in farm animals to treat conditions like mastitis, dysentery, and respiratory diseases. View evidence ↗
- There is currently limited information regarding how sulphadimidine affects the pharmacokinetics of tylosin in goats. View evidence ↗
The question
- The study aimed to investigate how the administration of tylosin affects the pharmacokinetics of sulphadimidine in West African Dwarf (WAD) goats. View evidence ↗
What they did
- The study used eight West African Dwarf goats (4 males, 4 females), aged 1-2 years, weighing approximately 13 to 13.5 kg. View evidence ↗
- Group A received 100 mg/kg of sulphadimidine alone, while Group B received 100 mg/kg of sulphadimidine and 10 mg/kg of tylosin. View evidence ↗
- Blood samples were collected at baseline and at specific intervals up to 48 hours post-administration. View evidence ↗
- Sulphadimidine plasma concentrations were measured using a modified chemical assay and analyzed with PC Modfit V7.8 software. View evidence ↗
What they found
- The peak plasma concentration of sulphadimidine at 1.5 hours was higher in goats receiving the drug alone (101.6±2.93 µg/ml) than in those receiving it with tylosin (87.08±1.30 µg/ml). View evidence ↗
- Significant differences in sulphadimidine plasma concentrations between the two groups were observed at 1.5, 2, and 24 hours. View evidence ↗
- Total body clearance of sulphadimidine was significantly lower when combined with tylosin (1.00 ± 0.02 L/kg/h) compared to sulphadimidine alone (1.60 ± 0.95 L/kg/h). View evidence ↗
- The Area Under the Curve (AUC), representing total drug exposure, was significantly higher in the combination group (1390.40±27.89 µg/mL.h) than in the alone group (854.20 ± 158.35 µg/mL.h). View evidence ↗
- The Mean Residence Time (MRT) was longer for the combination group (10.40±0.17 h) compared to the group receiving sulphadimidine alone (6.90±1.1 h). View evidence ↗
- The volume of distribution was significantly lower in the combination group (8.20 ± 0.4 L/kg) than in the group receiving sulphadimidine alone (13.9 ± 1.5 L/kg). View evidence ↗
What it means
- The authors conclude that combining sulphadimidine with tylosin increases the duration of plasma concentration, suggesting a synergistic interaction. View evidence ↗
- The authors recommend the combination of these two drugs for treating bacterial diseases of the respiratory and gastrointestinal tracts. View evidence ↗
Visual summary
3 visualsIllustrations explain the paper; charts are replotted from the paper's own table values.
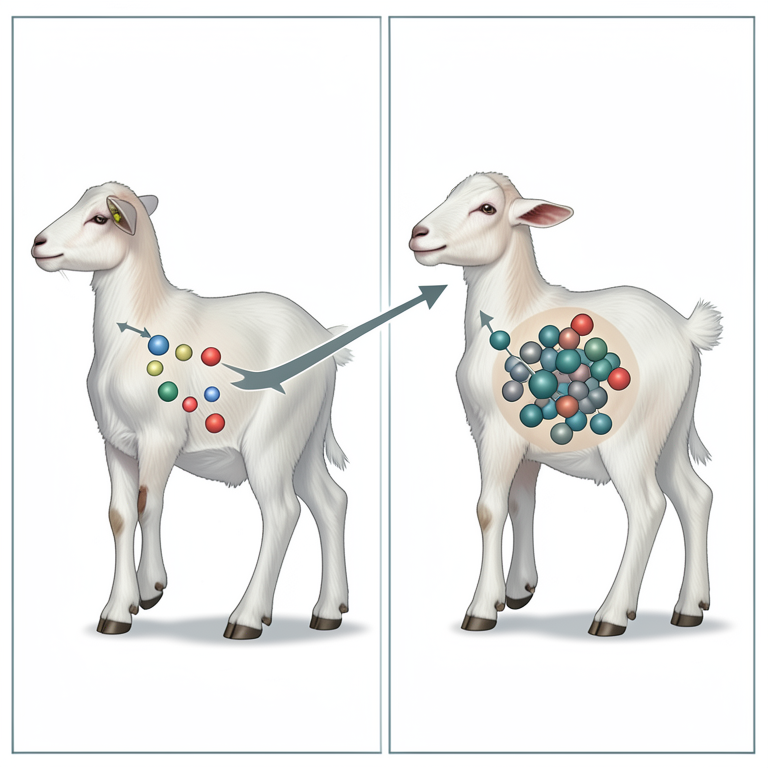
Drug Disposition Comparison
AI-generated conceptual illustration (goat kids). It explains the idea and does not show study data.
View source evidence ↗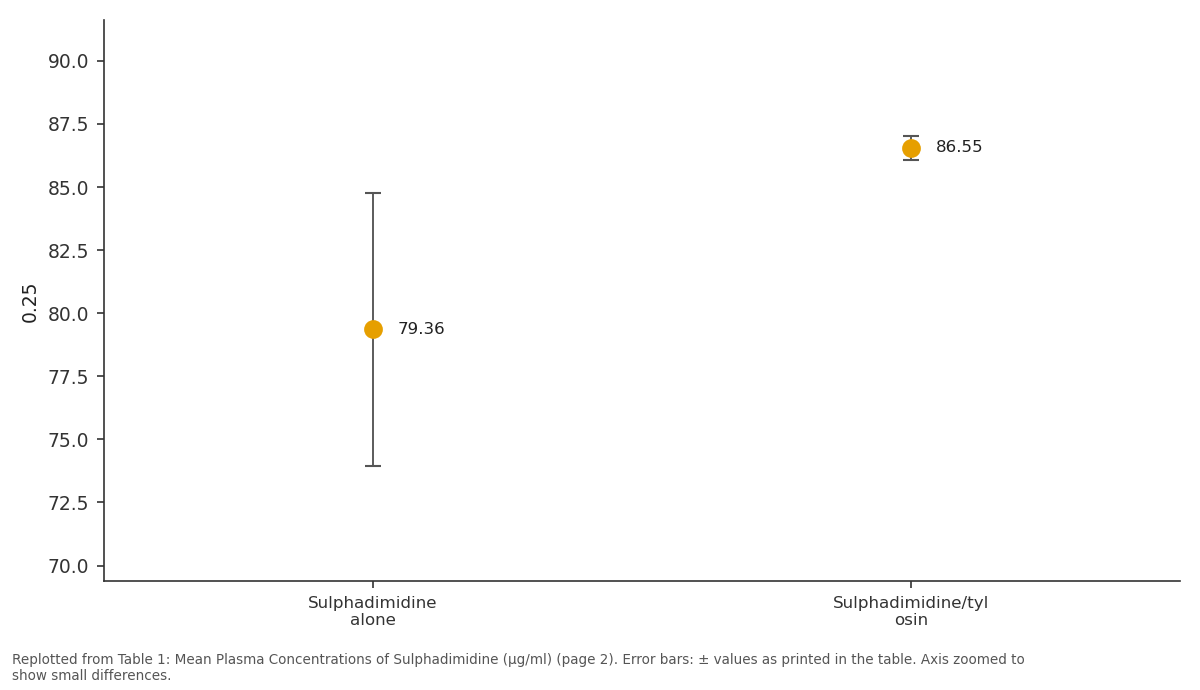
0.25: Sulphadimidine alone vs Sulphadimidine/tylosin
Replotted from Table 1 (page 2) of the original paper. Every bar is the paper's own table value.
View source evidence ↗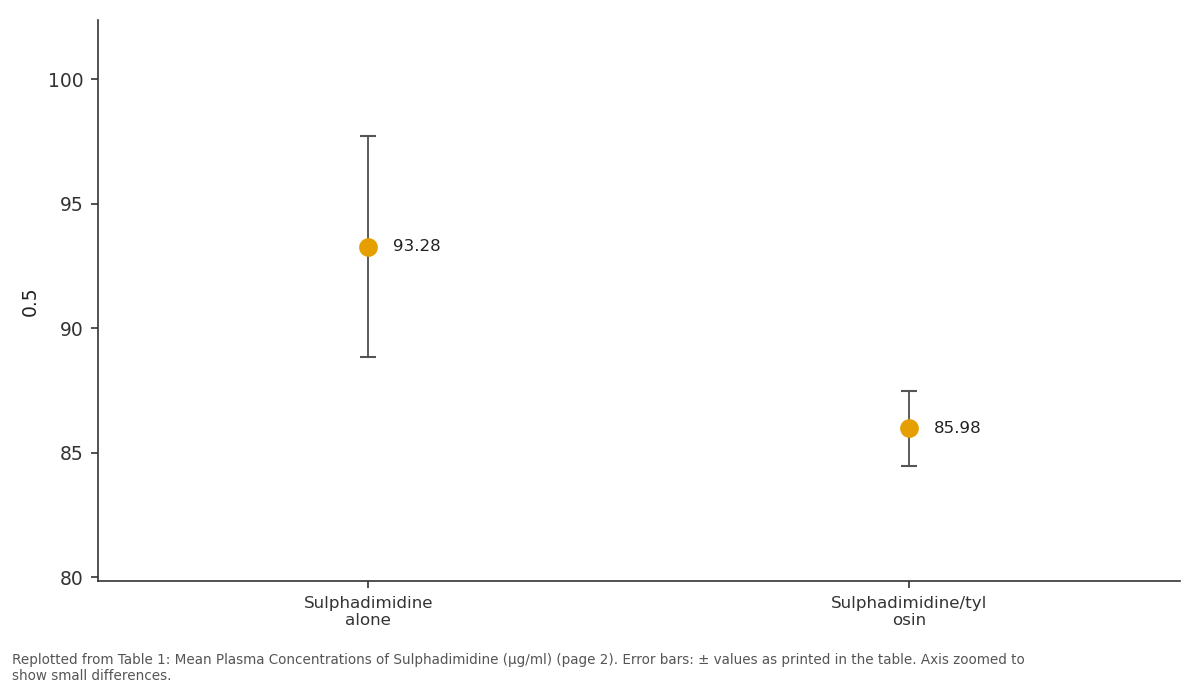
0.5: Sulphadimidine alone vs Sulphadimidine/tylosin
Replotted from Table 1 (page 2) of the original paper. Every bar is the paper's own table value.
View source evidence ↗Figures & tables
From the original paper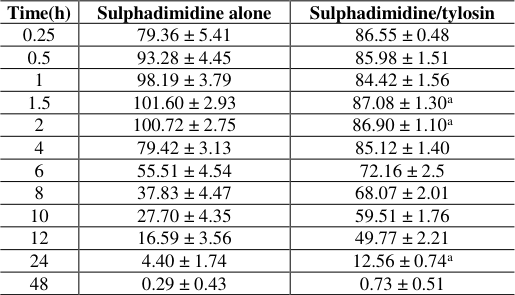 Table 1
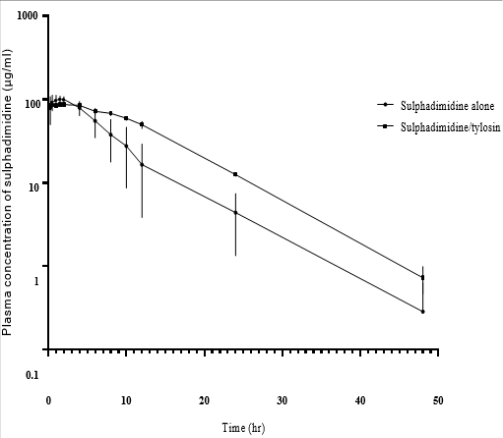 Figure 1
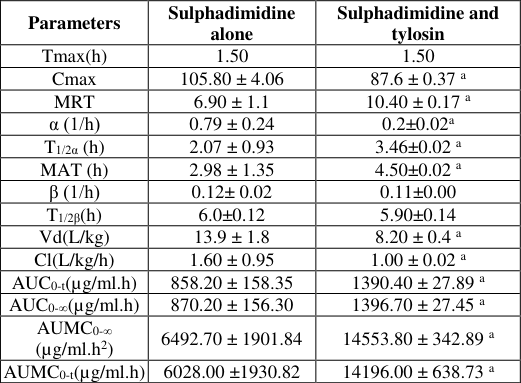 Table 2
Introduction
Sulphadimidine is one of the most widely used antibacterial agent in veterinary medicine, due to their low cost and relative efficacy in some bacterial and protozoan diseases (Agbo et al., 2023) [1] . It is useful against gram positive and negative bacteria, toxoplasma and coccidia species (Barragry, 1994; Prescott, 2000) [2,3] . The kinetics of sulphadimidine has been done in broilers (Onyeyili et al., 2000) [4] , dogs (Saganuwan et al., 2003) [5] , turkeys (Agbo et al., 2016) [6] and goat (Agbo et al., 2023, Akogwu et al., 2017) [1,7] . Sulphadimidine works by interfering with the synthesis of folic acid in bacteria. Folic acid is essential for bacteria to produce DNA and proteins necessary for their growth and survival. By blocking the enzymes involved in folic acid synthesis, sulphadimidine effectively inhibits the growth and multiplication of susceptible bacteria (Spoo and Reviere, 2001) [8] . Tylosin is a macrolide antibiotic with good activity against mycoplasma and gram positive organisms (Giguere, 2006) [9] and it is used in veterinary medicine to control respiratory diseases, mastitis, and dysentery in cattle and other farm animals (Kowalski et al., 2002) [10] . Tylosin works by inhibiting bacterial protein synthesis. It binds to the bacterial ribosome, preventing the formation of functional proteins necessary for bacterial growth and reproduction (Gaynor and Mankin, 2005) [11] . There is little information on the effects of sulphadimidine on the pharmacokinetic of tylosin in goats. These studies will provide basis for recommending adjustments in dosage regimen and guide when co-administering sulphadimidine and tylosin.
Materials and Methods
Materials and Methods
Experimental animals
Eight (8) goats were obtained from local breeders in Wadata, Makurdi Local Government Area. They were housed in the goat pen at the Veterinary Teaching Hospital Joseph Sarwuan Tarka University Makurdi. The animals were stabilized for two weeks prior to experimentation. The animals were well fed and water was provided ad libitum. All the animals were handled according to ethical standards [12] .
Reagents
Reagents
Experimental design
Eight goats were used for the study. They were 1 year old and weighed approximately 13 to 13.5 kg. They were randomly separated into groups A and B consisting of 4 goats each. The goats in group A weighed 13.13±1.44 kg and goats in group B weighed 13.50±0.41 kg. Goats in group A received only sulphadimidine sodium on the left gluteal muscle at a dose of 100 mg/kg body weight. Goats in group B were given sulphadimidine sodium on the right gluteal muscle using 100 mg/kg as the dosage and tylosin was administered into the left gluteal muscle using 10 mg/kg as the dosage.
Blood sample collection
Basal blood sampling (2 ml) before medication was performed in each goat with further sampling at fixed times: 15, 30, 45 min and 1, 2, 4, 6, 8, 10, 12, 24, 48 h after dosing of the drug preparation. Blood samples were immediately centrifuged at 3,000 × g for 10 min, after which the plasma was recovered, identified, frozen and stored at -20 °C until analysed.
Determination of Sulphadimidine in Plasma
Plasma concentration of sulphadimidine was determined by a modified chemical assay method described by Nagaraja et al., (2007) [13] .
Pharmacokinetic analysis
The pharmacokinetic analysis of the plasma concentrations obtained was done by pharmacokinetic software 'PC Modfit V7.8'.
Statistical Analysis
Student's t-Test paired using Graph Pad Prism 5.03 for Windows at 5% level of significance.
Results
The mean plasma concentration of sulphadimidine in the goats administered sulphadimidine alone and sulphadimidine combined with tylosin is presented in table 1. Sulphadimidine concentration of 79.36±5.41 µg/ml was obtained in the goats administered sulphadimidine alone while a concentration of 86.5±1.51 µg/ml was obtained in the goats administered sulphadimidine and tylosin concurrently at 0.25h. The plasma concentration of sulphadimidine increased until a peak concentration of 101.6±2.93 µg/ml and 87.08±1.30 µg/ml was reached at 1.5h in goat administered sulphadimidine alone and goats administered sulphadimidine and tylosin respectively. The peak plasma concentration subsequently decreased and at 48h post administration, plasma concentration were 0.29±0.43 µg/ml and 0.73±0.51 µg/ml in goat administered sulphadimidine alone and goats administered sulphadimidine and tylosin respectively. There was significant (p<0.05) differences in the plasma concentration of sulphadimidine between the two groups of goats at 1.5, 2 and 24 hours post sulphadimidine administration. The pharmacokinetic parameters of sulphadimidine in WAD goats administered sulphadimidine alone and those administered sulphadimidine and tylosin concurrently are shown in table 2. Tylosin (10 mg/kg) significantly (p<0.05) increased all the pharmacokinetic parameters with exception of Tmax (h), β (1/h) and T1/2β (h).
| Parameters | Sulphadimidine alone | Sulphadimidine and tylosin |
|---|---|---|
| Tmax(h) | 1.50 | 1.50 |
| Cmax | 105.80 ± 4.06 | 87.6 ± 0.37 a |
| MRT | 6.90 ± 1.1 | 10.40 ± 0.17 a |
| α (1/h) | 0.79 ± 0.24 | 0.2±0.02a |
| T1/2α (h) | 2.07 ± 0.93 | 3.46±0.02 a |
| MAT (h) | 2.98 ± 1.35 | 4.50±0.02 a |
| β (1/h) | 0.12± 0.02 | 0.11±0.00 |
| T1/2β(h) | 6.0±0.12 | 5.90±0.14 |
| Vd(L/kg) | 13.9 ± 1.8 | 8.20 ± 0.4 a |
| Cl(L/kg/h) | 1.60 ± 0.95 | 1.00 ± 0.02 a |
| AUC0-t(µg/ml.h) | 858.20 ± 158.35 | 1390.40 ± 27.89 a |
| AUC0-∞(µg/ml.h) | 870.20 ± 156.30 | 1396.70 ± 27.45 a |
| AUMC0-∞ (µg/ml.h2) | 6492.70 ± 1901.84 | 14553.80 ± 342.89 a |
| AUMC0-t(µg/ml.h) | 6028.00 ±1930.82 | 14196.00 ± 638.73 a |
Table text extracted from the original PDF; superscript letters are shown inline. The original table image is below.
View original table image
| Time(h) | Sulphadimidine alone | Sulphadimidine/tylosin |
|---|---|---|
| 0.25 | 79.36 ± 5.41 | 86.55 ± 0.48 |
| 0.5 | 93.28 ± 4.45 | 85.98 ± 1.51 |
| 1 | 98.19 ± 3.79 | 84.42 ± 1.56 |
| 1.5 | 101.60 ± 2.93 | 87.08 ± 1.30a |
| 2 | 100.72 ± 2.75 | 86.90 ± 1.10a |
| 4 | 79.42 ± 3.13 | 85.12 ± 1.40 |
| 6 | 55.51 ± 4.54 | 72.16 ± 2.5 |
| 8 | 37.83 ± 4.47 | 68.07 ± 2.01 |
| 10 | 27.70 ± 4.35 | 59.51 ± 1.76 |
| 12 | 16.59 ± 3.56 | 49.77 ± 2.21 |
| 24 | 4.40 ± 1.74 | 12.56 ± 0.74a |
| 48 | 0.29 ± 0.43 | 0.73 ± 0.51 |
Table text extracted from the original PDF; superscript letters are shown inline. The original table image is below.
View original table image
Discussion
The aim of this study was to investigate the effect of tylosin in the pharmacokinetic of sulphadimidine in West African dwarf goats. The combination is been used clinically in the management of Peste des Petits Ruminants (PPR) in goat mainly against secondary bacteria infection, protozoan infection of the gastrointestinal tract and respiratory tract. Plasma concentration of sulphadimidine were observed for 48 hours (Table 1). Sulphadimidine combination with tylosin presented a two compartment open model (Fig 1). This is in agreement with the report of Agbo et al., 2016 [6] in starved and non-starved domestic grower turkey, Akogwu et al., 2017 [7] in WAD goats, Agbo et al., 2019 [14] , 2023 [5] in WAD goats. These findings are at variance with report of Argaw and Brugere, 1990 [15] in sheep and goat, Onyeyili et al., 1997 [16] in guinea fowl, domestic chicken and duck where sulphadimidine was eliminated by a single compartment model. This could be due to specie or breed variation and differences in the site of administration. The volume of distribution is the volume that would be required to contain the amount of drug present in the body at the same concentration as in the plasma or a factor that relates the amount of drug in the body to the concentration of drug in the plasma (Gustafson and Bradshaw pierce, 2011) [17] . This gives information on the drugs distribution in the body. In the present study the group of WAD goats treated with sulphadimidine alone had a significantly (p<0.05) high volume of distribution of 13.9 ± 1.5 L/kg as against 8.20 ± 0.4 L/kg for the WAD goat treated with sulphadimidine and tylosin concurrently. This high volume of distribution in the group administered sulphadimidine alone is an indication of a more extensive penetration into the body fluids and tissue of the body. The volume of distribution may vary widely depending on the relative degree of its binding to plasma and tissue proteins. This indicated significant binding of sulphadimidine to plasma and tissue proteins when combined with tylosin. The total body clearance reflects the elimination of the drug from the body (Agbo et al., 2023) [1] . The higher the drug concentration in plasma the more the drug is presented for elimination. Therefore, clearance is the coefficient of proportionality between plasma drug concentration and elimination (Bourne, 2010) [18] .
The total body clearance of sulphadimidine in the goats administered sulphadimidine alone was significantly ((p<0.05) higher (1.60 ± 0.95 L/kg/h) as against that of the goats administered sulphadimidine and tylosin concurrently (1.00 ±0.02 L/kg/h). this suggest that less sulphadimidine is presented to the metabolic and excretory organs when combined with tylosin. The Area under the concentration-time curve (AUC) is the integral of the plasma drug concentration time curve (Bourre, 2010) [18] . The AUC reflects the actual exposure of the drug after administration of a dose of the drug. It is dependent on the rate of elimination and the dose administered and inversely proportional to the drug clearance (Bourne, 2010) [18] . In the present study, the WAD goats treated with sulphadimidine combination with tylosin has a significantly (p<0.05) increased AUC (1390.40±27.89 µg/mL.h) compared to the WAD goats treated with sulphadimidine alone (854.20 ± 158.35 µg/mL.h). This indicates that the body exposure to the drug is longer in the goats treated with sulphadimidine and tylosin more than those treated with sulphadimidine alone. The longer body exposure to sulphadimidine in WAD goats treated with sulphadimidine and tylosin combination is possible because of the lower total body clearance and slower decline in the plasma drug concentration. This is also reflected in the MRT parameter, where the goats treated with sulphadimidine alone had a significantly (p>0.05) lower MRT (6.90±1.1 h) when compared to the goats treated with sulphadimidine and tylosin combination (10.40±0.17 h).
Conclusion
Sulphadimidine combination with tylosin has increased the plasma concentration of sulphadimidine for longer period of time. This implies synergistic interaction between the two drugs.
Conflict of
Conflict of
References
10 in the original paper- Spoo JW, Riviere JE. Sulfonamides. In: Adams HR, editor. Veterinary pharmacology and therapeutics. 8th ed. Ames, Iowa: Blackwell Publishing; 2001. p. 796-817.
- Kowalski C, Rolinski Z, Zan R, Wawron W. Pharmacokinetics of tylosin in broiler chickens. Pol J Vet Sci. 2002;5:127-130.
- Gaynor M, Mankin AS. Macrolide antibiotics: Binding site, mechanism of action, resistance. Front Med Chem. 2005;2:21-35.
- ICLAS, CIOMS. International guiding principles for biomedical research involving animals. Available from: https://olaw.nih.gov/sites/default/files/Guiding_Principles _2012.pdf. Accessed 12 Dec 2023.
- Nagaraja P, Naik SD, Shestha AK, et al. A sensitive spectrophotometric method for the determination of sulfonamides in pharmaceutical preparations. Acta Pharm. 2007;57:333-342.
- Agbo JO, Onyeyili PA, Saganuwan SA, Bosha JA. Effect of age on the pharmacokinetics of sulphadimidine in West African Dwarf goats following a single intramuscular administration. GSC Bio Pharm Sci. 2019;9(2):44-49.
- Argaw T, Brugere H. Changes in disposition kinetics of sulphadimidine in response to acute regional liver damage in sheep. J Vet Med Series A. 1990;37:787-794.
- Onyeyili PA, Egwu GO, Apampa OA, Ameh J. Elimination of sulphadimidine from edible tissues and blood of guinea fowl, domestic chickens and ducks. Bull Afr Ani Heal Prod. 1997;45:225-229.
- Gustafson DL, Bradshaw-Pierce EL. Fundamental concepts in clinical pharmacology. 2011. Available from: http://www.springer.com/978-1-4419-7357-3.
- Bourne DWA. Method of residuals; c2010. Available from: https://www.boomer.org/boomer/BoomerManual.pdf. Accessed 4 Jun 2023.
Cited by 1
From OpenAlex, OpenCitations and reference lists read by Scinovex
- Effect of Meloxicam on the Kinetic Profile of Sulphadimidine in West African Dwarf (WAD) Goats ↗
Agbo Odeh Joseph, Orsterga Sewuese Esther, Henry Chuwkuebuk NWANKWO, Chichi Peter Bem · International Journal of Pharmacology and Clinical Research · 2025
The use of antibiotics and non-steroidal anti-inflammatory drugs in the management of disease conditions in animals is widespread. This study aims to determine the effect of meloxicam at a single dose of 0.5 mg/kg body weight on the kinetic profile of sulphadimidine administered at a single dose of 100 mg/kg body weight in West African Dwarf (WAD) goats. Four healthy…
❝ 0PDF