
Research article · 2024 · Full text
International Journal of Agriculture and Food ScienceMorphological and biochemical characterization of some chickpea (Cicer arietinum L.) genotypes in Bangladesh
Volume 6(2) · Pages 80–86 · DOI: 10.33545/2664844x.2024.v6.i2b.206 ↗
Research areasGenetic and Environmental Crop StudiesAgricultural pest management studiesBotanical Research and Chemistry
Abstract
Author-writtenA significant legume crop that is farmed all over the world is the chickpea (Cicer arietinum L.). In order to choose the promising lines, eleven chickpea advanced genotypes were assessed for yield, yield contributing features, and biochemical properties. Biochemical examination was carried out at the Bangladesh Institute of Nuclear Agriculture's Soil Science Division Laboratory, and the field experiment was carried out at the BINA sub-station, Ishwardi experimental field, during the Rabi season in 2022. Three replications of a randomized fully block design (RCBD) were used to conduct the field experiment. Ten randomly chosen plants from each plot were used to collect data on the following: number of primary branches, number of seed pods per plant, number of days to maturity, plant height, days of blooming, seed yield (tha-1), and 100 seed weight (g). The seeds' protein percentage, nitrogen percentage, P, K, Na, Mg, Fe, Zn, Ca, and Ni contents were measured. The genotype BINA Sola-8 had the highest protein content (23.80%), whereas the genotypes CIEN-SSA 6-10 and CAT-29-38 had the lowest protein contents (11.89%). CIEN SSA-32-26 outperformed the control variety Binasola-8 and BARI sola-7, as well as other genotypes, in terms of seed yield (1.90 tha-1) and pods plant-1 (98.58) at the BINA sub-station location in Ishwardi. In addition, out of all the genotypes, CIEN SSA-32-26 had the earliest maturity recorded (124 days). Additionally, the CIEN SSA-32-26 genotypes were enriched in Fe (200 ppm) and protein (17.62). The chickpea genotypes were quantified using both morphological and biochemical data, and the utilization of elite genotypes in breeding programs targeted at improving yield and nutritional quality may prove beneficial. In the upcoming season, more assessment will be carried out at various chickpea-growing region
Summary
Source-checkedPlain-language reading of the full paper, prepared with AI and checked against the text. Each point links to the authors' own words.
Why it matters
- Chickpea is a globally cultivated annual legume and ranks as the third most important food legume. View evidence ↗
- In developing nations such as Bangladesh, pulses are vital for improving the nutritional quality of cereal-based diets. View evidence ↗
- Chickpeas generally have lower yields than cereals due to their high susceptibility to weather-related factors like drought and humidity. View evidence ↗
The question
- The study aims to identify a high-yielding and nutritious chickpea variety by analyzing various agronomic and biochemical properties. View evidence ↗
What they did
- The researchers evaluated eleven chickpea genotypes, consisting of nine advanced genotypes and two check varieties (Binasola-8 and BARI sola-7). View evidence ↗
- The field experiment was conducted during the 2022 Rabi season at the BINA sub-station in Ishwardi using a Randomized Fully Block Design with three replications. View evidence ↗
- Agronomic data, including plant height, seed yield, and pod count, were collected from ten randomly selected plants per plot. View evidence ↗
- Biochemical analysis involved using an Atomic Absorption Spectrophotometer for mineral content and a conversion factor of 6.25 to estimate protein from nitrogen levels. View evidence ↗
What they found
- The genotype CIEN SSA-32-26 achieved the highest seed yield at 1.90 tha-1, while CIEN-MED-32 had the lowest at 1.56 tha-1. View evidence ↗
- CIEN SSA-32-26 produced the most pods per plant (98.58), significantly outperforming CAT-11-28, which produced the fewest (62.66). View evidence ↗
- CIEN SSA-32-26 reached maturity the fastest at 124 days, whereas CAT-11-28 took the longest at 134 days. View evidence ↗
- BINA Sola-8 exhibited the highest protein content (23.80%), while CIEN-SSA 6-10 and CAT-29-38 had the lowest (11.89%). View evidence ↗
- Zinc concentrations varied from a high of 63.88 ppm in CAT-11-28 to a low of 25.86 ppm in CIEN-SA 33. View evidence ↗
- Iron levels ranged from 50 ppm in genotypes like CIEN-SSA 6-10 to 175 ppm in CAT-29-38 and CIEN-SA 15. View evidence ↗
- Seed yield was positively and significantly correlated with the number of main branches, pods per plant, and seeds per pod. View evidence ↗
What it means
- The authors conclude that CIEN SSA-32-26 is a superior genotype for seed production and maturity, recommending its use as a baseline for breeding programs to improve chickpea varieties in Bangladesh. View evidence ↗
- The authors state that the study is preliminary and requires further assessment across different chickpea-growing regions in Bangladesh. View evidence ↗
Visual summary
3 visualsIllustrations explain the paper; charts are replotted from the paper's own table values.
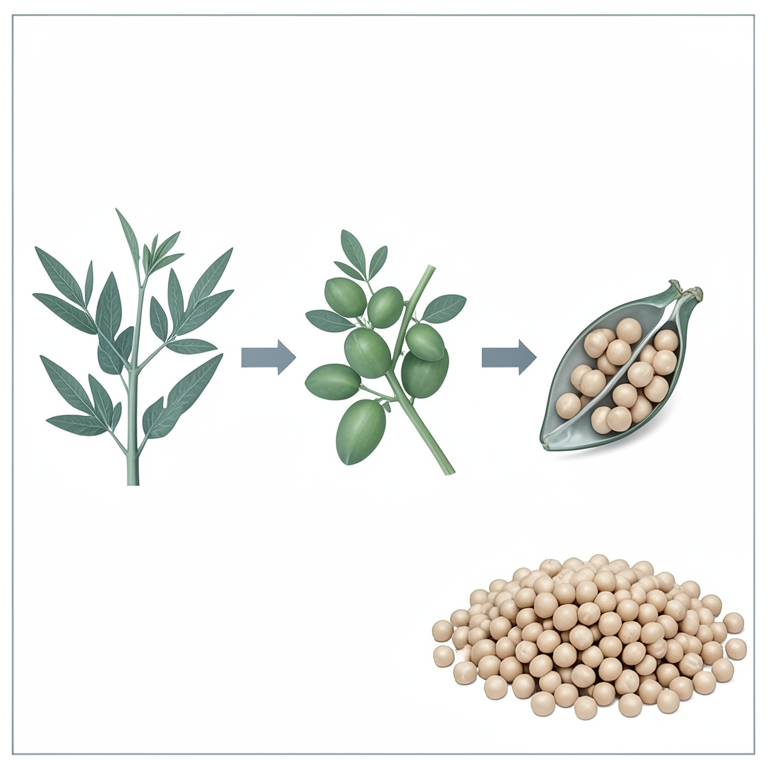
Yield Correlation Map
AI-generated conceptual illustration (chickpea plants (Cicer arietinum L.)). It explains the idea and does not show study data.
View source evidence ↗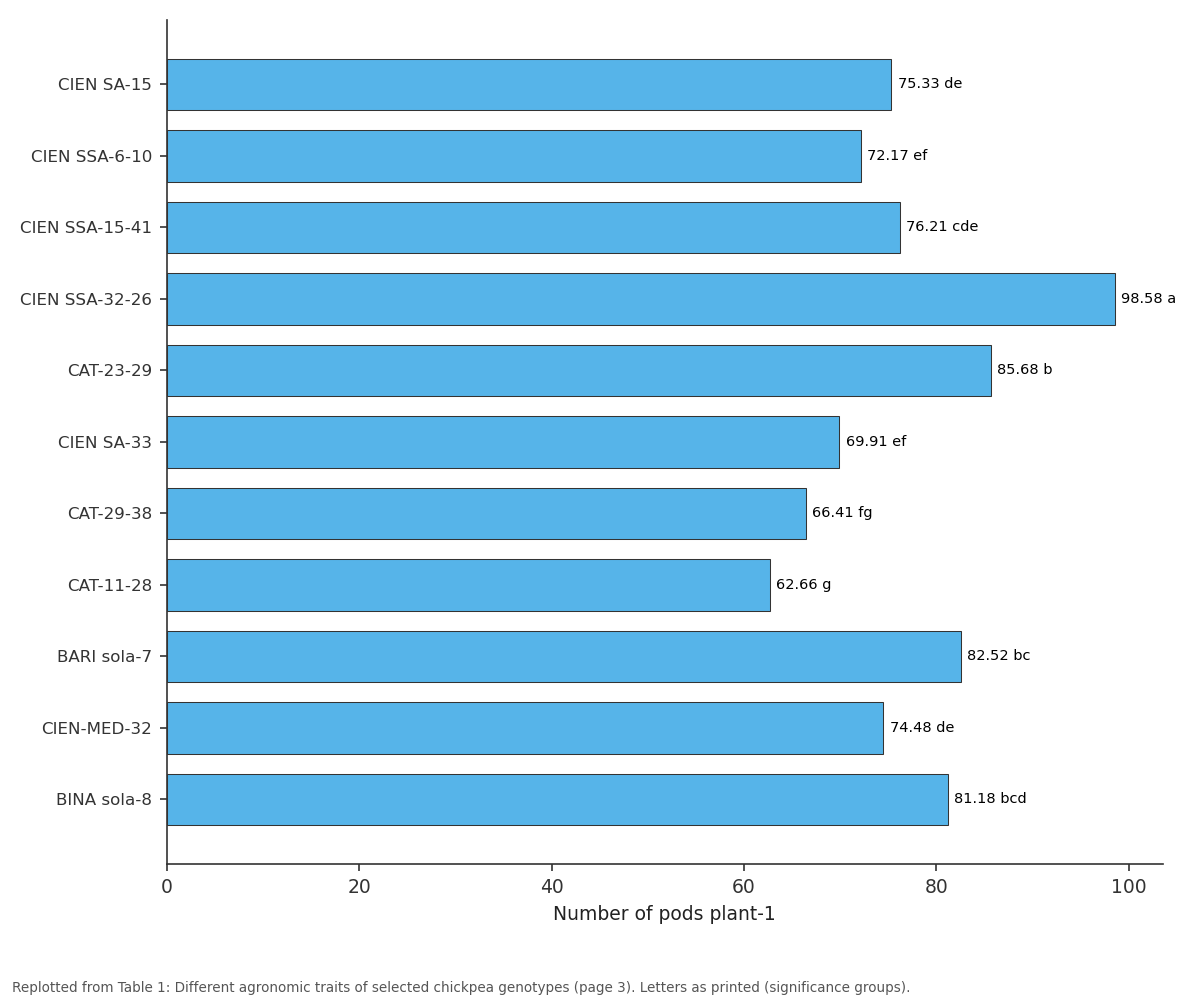
Number of pods plant-1: CIEN SA-15 vs CIEN SSA-6-10 vs CIEN SSA-15-41 vs CIEN SSA-32-26 vs CAT-23-29
Replotted from Table 1 (page 3) of the original paper. Every bar is the paper's own table value.
View source evidence ↗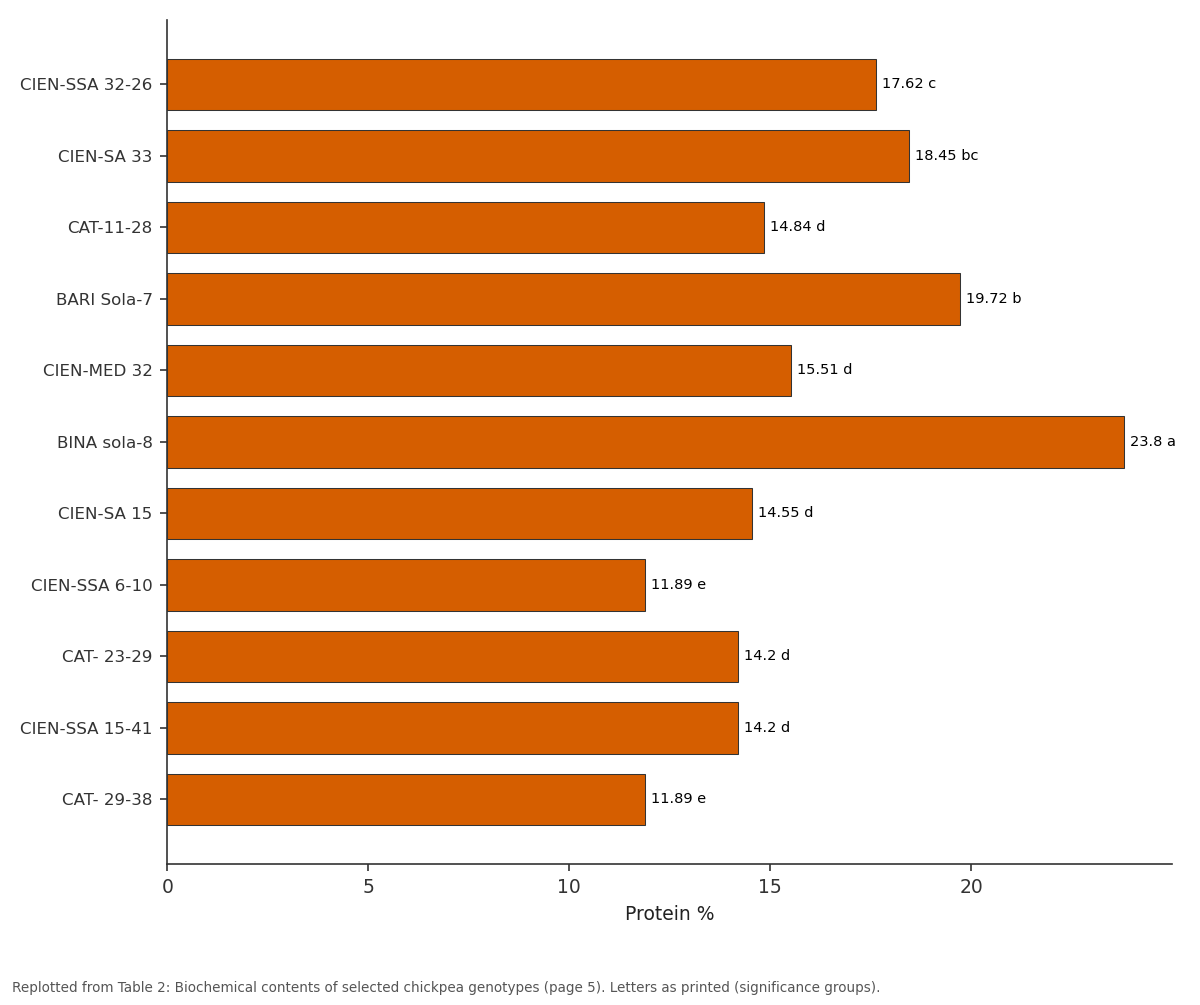
Protein %: CIEN-SSA 32-26 vs CIEN-SA 33 vs CAT-11-28 vs BARI Sola-7 vs CIEN-MED 32
Replotted from Table 2 (page 5) of the original paper. Every bar is the paper's own table value.
View source evidence ↗Figures & tables
From the original paper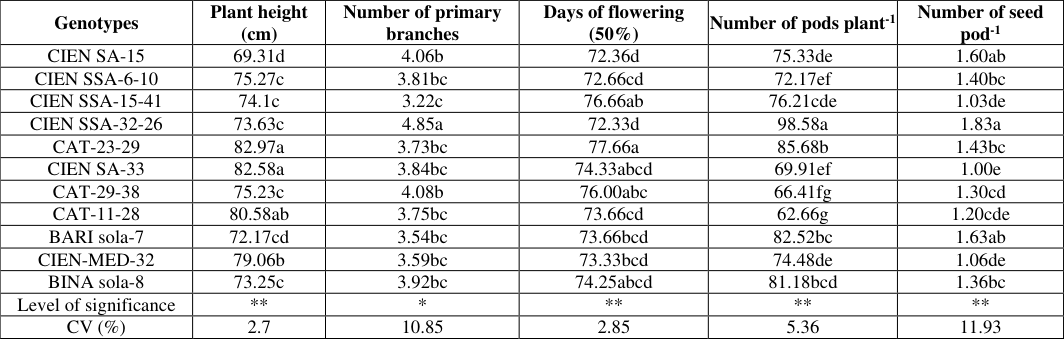 Table 1
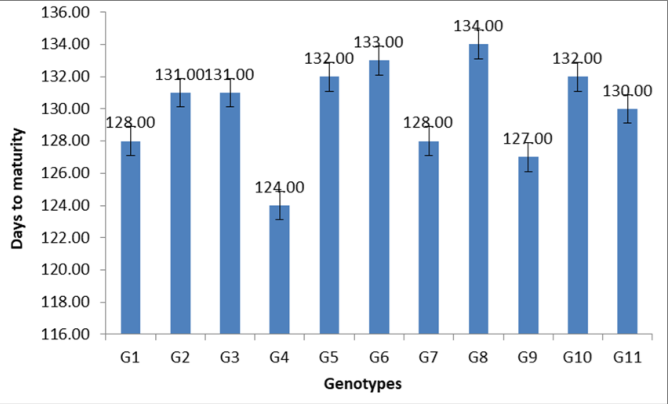 Figure 1
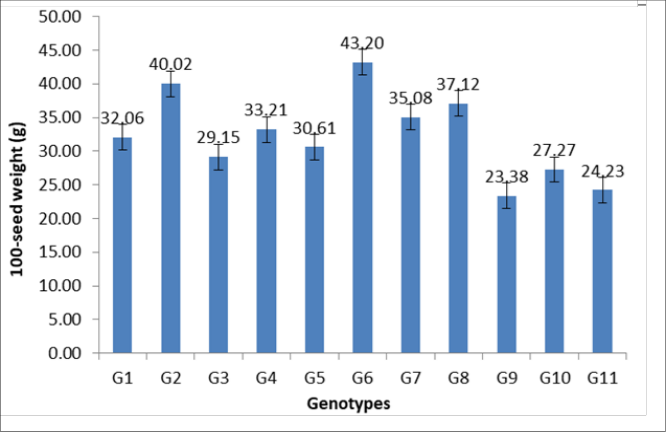 Figure 2
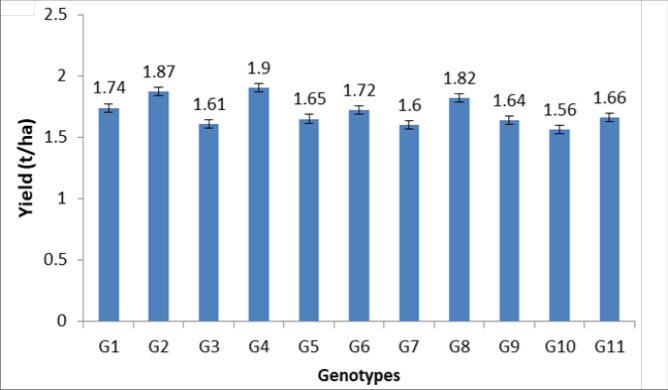 Figure 3
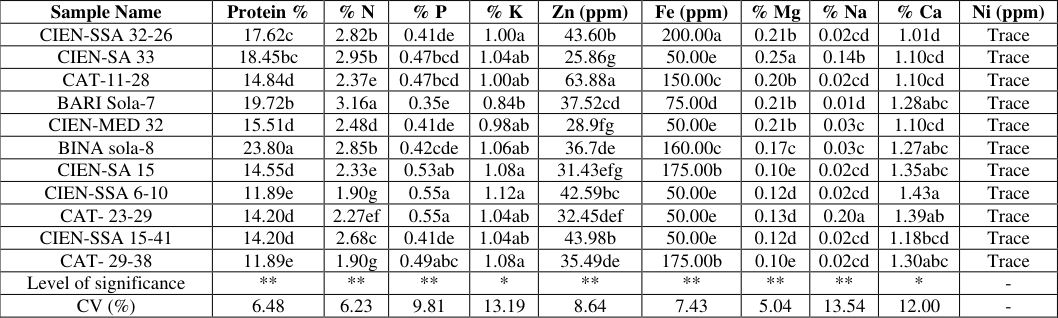 Table 2
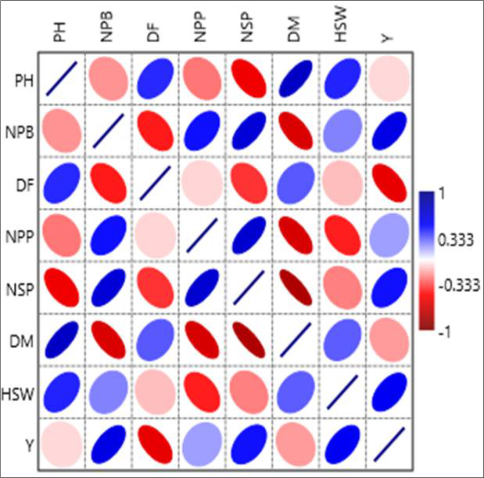 Figure 4
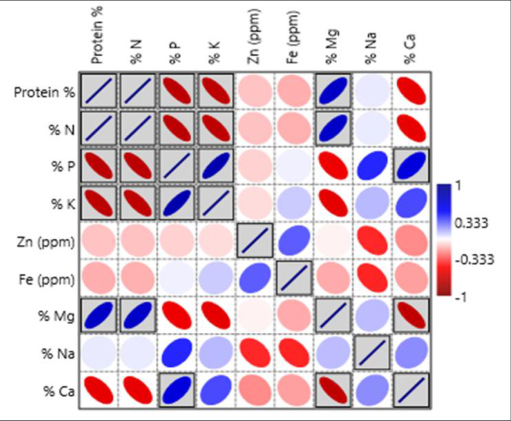 Figure 5
Introduction
Chickpea (Cicer arietinum) is an annual legume of the family Fabaceae, subfamily Faboideae and it is cultivated in more than 40 countries worldwide and is the third most significant food legume (Singh, V. et al., 2021) [21] . With a diploid chromosome number (2n = 2x = 16) and papilionaceous corolla, it is a self-pollinating crop. According to Wood and Grusak (2007) [23] , chickpeas are a rich source of calories, protein, minerals, vitamins, and fiber. They also include phytochemicals that may be good for your health. Chickpeas are grown on 12.7 million hectares of land in more than 54 countries worldwide, yielding 12 million tons annually (Devasirvatham, V., et al., 2018) [10] . About 12.55 thousand hectares of Bangladesh's 239.9 thousand hectares of pulse production are made up of chickpeas; with an average yield of about 766 kg ha -1 , chickpeas provide roughly 3.65% of the nation's total pulse production (Akter, M. 2019) [2] . Rainfed conditions have long been used in Bangladesh to cultivate chickpeas. Approximately 85% of the chickpea crop was planted in the districts of Jessore, Faridpur, Rajshahi, Kustia, Pabna, Chapai Nawabigonj, and Dinajpur (Abdur Rashid et al., 2014) [19] . The amount of land used for chickpea production has been rapidly decreasing due to the increased demand for staple crops including rice, maize, and wheat. In developing countries like Bangladesh, pulse can improve the overall nutritional value of a diet that is mostly composed of cereals. The average daily intake of pulses in Bangladesh is only 12 g head -1 , which is far less than the recommended 45 g head -1 (Bruinsma, J. 2017) [9] . [12] . Chickpea seed proteins have lately attracted attention due to their anticancer, antidiabetic, and anti-HIV -1 reverse transcriptase qualities (Bhagyawant et al., 2018) [6] . This situation is becoming worse every day as a result of pulses' low yield and low nutritional content when compared to cereals. Chickpeas are less productive than cereals and are more susceptible to weather-related factors such drought, high soil moisture and humidity, heavy fertilizer and water use, and rainfall. These are the primary causes of its low yield. Increasing seed yield by creating diversity in the existing germplasm and then using the appropriate selection procedure is the primary prerequisite for enhancing chickpea cultivars. Given the present chickpea cultivars, it is imperative to assess the morphological and biochemical traits of these genotypes.
The current study aims to generate a high-yielding, nutritious chickpea variety by investigating a number of biochemical and agronomic properties.
Materials and methods
Materials and methods
Experimental site
The field experiment was carried out at the BINA substation in Ishwardi during the 2022 Rabi season.
Experimental treatments and design
Three replications and a completely randomized block design were used to set up the experiment. Two check variations with nine genotypes. CIEN SA-15, CIEN SSA-6-10, CIEN SSA-15-41, CIEN SSA-32-26, CAT-23-29, CIEN SA-33, CAT-11-28, CIEN-MED 32, and CAT-29-38 were the single factor genotypes used in the experiment, together with two check varieties, Binasola-8 and BARI sola-7. Line sowing was used to plant the seeds two to three centimeters deep. The unit plot measured 12 m² (4 m × 3 m). The lineto-line distance was kept at 40 cm, and the space between seeds was 10 cm in a row. During the last stages of land preparation, 45, 120, 70, and 90 kg ha -1 of urea, TSP, MoP, and Gypsum fertilizer were applied, respectively. To ensure the healthy growth and development of chickpea plants, standard intercultural procedures such as weeding, thinning, and pesticide treatment were carried out.
Data collection
Visual observation was used to record the number of days till 50% flowering (DF) and 95% maturity (DM) from the time of seeding until 50% flowering and 95% maturity, respectively. In accordance with established practice, morphological and yield-related characteristics were documented. A meter rod was used to measure the height of the plant from the base to the tip of the highest leaf. At maturity, the number of Branches Per Plant (BPP) was manually counted. To record the grain yield, all genotypes were harvested at harvest maturity. Ten plants were chosen at random from each plot for this purpose, and the pods were threshed to determine the amount of seeds produced by each plant. To calculate seed production, which was adjusted to 12% moisture, all seeds (from ten plants) were weighed on an electric balance.
Determination of N, P, K, Na, Mg, Fe, Zn, Ca and Ni
Chickpea genotype seeds were ground into a fine powder for biochemical examination, which is then sieved and used for analysis.
Measurement of N
Johann Kjeldahl developed the Kjeldahl method in 1883 to determine the quantity of N. The three stages of the process are titration, distillation, and digesting. In this study, a machine called a "UKD 159 Automatic Distillation & Titration System" performed the distillation and titration processes, whereas the digestion process was carried out by hand. The UKD 159 Automatic Distillation & Titration System was used to measure the solution for every sample.
The UKD 159 Automatic Distillation & Titration System reading revealed the total N% in each sample.
Measurement of P, K, Na, Mg, Fe, Zn, Ca and Ni
To measure each element's quantity, use a pipette. 10 ml of Barton's solution was added to 50 ml volumetric flasks containing 2 ml of each sample's diluted filtrate. Distilled water was then added to the solution to create volume. They then used an Atomic Absorption Spectrophotometer (AAS) to measure the amounts of P, K, Na, Mg, Fe, Zn, Ca, and Ni.
Estimation of protein
Protein content was estimated by multiplying the percentage N by the conversion factor. A conversion factor (CF) of 6.25, or 0.16 g nitrogen per gram of protein, was employed to estimate the ratio of observed nitrogen concentration to protein concentration.
Analysis of data
The gathered data was statistically examined using the analysis of variance (ANOVA) approach. The statistical computer tool MSTAT-C was also used to calculate the simple correlation coefficient between significant characters and modify the mean differences using LSD.
In contrast to the genotypes, CIEN SA-15 had the shortest plants (69.31 cm), followed by BARI sola-7 (72.17 cm), while CAT-23-29 and CIEN SA-33 had the tallest plants (82.97 cm and 82.58 cm, respectively) (Table 1). Varietal variation is the main cause of variations in plant height between cultivars and varieties. Plant height and other agronomic characteristics may vary as a result of distinct genetic and morphologic factors, according to Singh and Verma (1999) [20] .
| Genotypes | Plant height (cm) | Number of primary branches | Days of flowering (50%) | Number of pods plant-1 | Number of seed pod-1 |
|---|---|---|---|---|---|
| CIEN SA-15 | 69.31d | 4.06b | 72.36d | 75.33de | 1.60ab |
| CIEN SSA-6-10 | 75.27c | 3.81bc | 72.66cd | 72.17ef | 1.40bc |
| CIEN SSA-15-41 | 74.1c | 3.22c | 76.66ab | 76.21cde | 1.03de |
| CIEN SSA-32-26 | 73.63c | 4.85a | 72.33d | 98.58a | 1.83a |
| CAT-23-29 | 82.97a | 3.73bc | 77.66a | 85.68b | 1.43bc |
| CIEN SA-33 | 82.58a | 3.84bc | 74.33abcd | 69.91ef | 1.00e |
| CAT-29-38 | 75.23c | 4.08b | 76.00abc | 66.41fg | 1.30cd |
| CAT-11-28 | 80.58ab | 3.75bc | 73.66cd | 62.66g | 1.20cde |
| BARI sola-7 | 72.17cd | 3.54bc | 73.66bcd | 82.52bc | 1.63ab |
| CIEN-MED-32 | 79.06b | 3.59bc | 73.33bcd | 74.48de | 1.06de |
| BINA sola-8 | 73.25c | 3.92bc | 74.25abcd | 81.18bcd | 1.36bc |
| Level of significance | ** | * | ** | ** | ** |
| CV (%) | 2.7 | 10.85 | 2.85 | 5.36 | 11.93 |
Table text extracted from the original PDF; superscript letters are shown inline. The original table image is below.
View original table image
Number of primary branches plant -1
The genotype CIEN SSA-15-41 (3.22) had the lowest primary branching frequency, whereas CAT-29-38, CAT-11-28, BARI sola-7, and CIEN-MED-32 had intermediates. The variety with the most primary branches plant-1 was CIEN SSA-32-26 (4.85) (Table 1). The maximum branching was discovered in CIEN SSA-32-26 because to its genetic composition and advantageous environmental conditions. The frequency of branching varied among genotypes that received the same treatment (Elobied, 2010) [11] .
The genotypes' flowering days varied significantly from one another. The genotype CAT-23-29 required the most days for flowering (77.66 days), while the genotype CIEN SSA-32-26 required the fewest days (72.33 days). Their genetic distinctiveness causes it to arise in the same agronomic setting. In chickpeas, germplasm from various parental sources with varying flowering times under identical agronomic conditions (Anon., 2006) [3] . Days to blooming were occasionally not important in certain variations of mungbean genotypes (Bhingarde and Dumbre, 1993) [7] .
Number of pods plant -1
In comparison to other chickpea genotypes, CIEN SSA-32-26 (98.58) had the most pods per plant, which was statistically significant. In contrast, CAT-11-28 (62.66) had the fewest pods per plant (Table 1). Due to the various genetic components of each genotype, pod number is a highly related gene-oriented feature that fluctuates. Variety had an effect on the quantity of pods that plants formed, according to Tahir et al., (2020) [22] . A germplasm's innate capacity to produce a certain number of pods per plant was noted by Özdemir and Karadavut (2003) [18] . Larger seeds produced a higher number of pods per plant, while smaller seeds produced fewer pods per plant, according to Bhingarde and Dumbre (1993) [7] .
Number of seeds pod -1
According to the findings, CIEN SA-33 had the fewest seeds (1.00) in a single pod, whereas CIEN SSA-32-26 had the most seeds (1.83), which was significant among the genotypes under study (Table 1). Because each variety has a distinct potential yield, the number of seeds in each pod varied. Larger seeds produced more seeds per pod, while smaller seeds produced fewer seeds per pod, according to Bhingarde and Dumbre (1993) [7] . According to Singh and Verma (1999) [20] , genotypes under the same growing facility differed greatly in the quantity of grains pod -1 .
Days to maturity
The duration of the maturity stage was 124-134 days (Fig. 1). At 124 days, CIEN SSA-32-26 had the earliest maturity ever recorded. It differed significantly at all other genotypes. In comparison to other genotypes, CAT-11-28 exhibited the longest maturity length (134 days), which was statistically distinct. A species' blooming and pod formation phases were triggered by the same agronomic procedures for different genotypes because of the effects on the genes responsible for those traits. Bakr et al., reported similar results (2002). For field crops, days to maturity are influenced by environmental conditions and genetic diversity, according to (Anon., 2006) [3] . [17] , which indicated that the genotype mostly controlled the 100 seed weight under optimal conditions. Bakr et al., (2002) [4] found that the seed weights of BARI Chola-5 ranged from 110 to 120 g, BARI Chola-6 from 140 to 150 g, and BARI Chola-8 from 250 to 260 g. Seed yield (tha -1 ) Details about the genotypes of chickpeas' seed output are shown in Fig. 3. The difference in the seed yields of the several grown varieties was statistically significant; CIEN SSA-32-26 (1.90 tha -1 ) had the largest seed yield, while CIEN-MED-32 (1.56 tha -1 ) had the lowest. Similar findings were made by Akondo et al., (2022) [1] . Although the number of branches has a substantial correlation with seed yield, the number of pods per plant and the number of seeds per pod have the greatest direct effects on seed yield (Lal et al., 2016) [16] . There were notable differences in the fresh weight of seed between cultivars (Jayaraj and Karivaratharaju, 1992) [13] . Correlations among agronomic traits There were positive and statistically significant correlations between seed yield and the number of main branches per plant (NPB), number of pods per plant (NPP), and number of seeds per pod (NSP) (Fig. 4). According to Khatun et al., (2009) [15] , there is a positive link between seed yield and other factors that contribute to yield. Kante et al., (2022) [14] . Found a good correlation between the seed production of various sesame genotypes and a number of agronomic characteristics. The correlation study supports the findings that days to maturity, 1000 seed weight, and branches per plant are important yield-related characteristics. Again, a positive and significant association was observed between the Number of Pods Per Plant (NPP) and the number of seeds per pod (NSP). Additionally, plant height and Days to Flowering (DF) were positively correlated (Fig. 4). But the number of major branches, the number of seeds per pod, and the yield were significantly correlated negatively with the number of days to maturity. Seed yield was somewhat inversely correlated with plant height.
Bio-chemical attributes
There was a significant biochemical difference between the genotypes. The genotype BINA Sola-
Correlation among the bio-chemical traits
The amount of protein and nitrogen are significantly positively correlated. Magnesium also has a positive association with protein concentration and nitrogen. Additionally, there is a strong positive association between phosphorus and calcium and potassium levels (Fig. 5). According to Bhagat et al., (2023) [5] , there is a positive link between micronutrients and the amount of nitrogen and protein found in plant components. On the other hand, there is a notable inverse relationship between nitrogen and protein concentration and potassium and phosphorus. Additionally, there is a strong inverse relationship between magnesium and calcium.
Conclusion
The genotypes of chickpeas studied in this study varied significantly, which could help choose those with the best chance of producing higher yields with higher nutritional value. According to the current study's findings, CIEN SSA-32-26 produced the most seeds and had the shortest duration of nutrient enrichment. To improve the chickpea varieties in Bangladesh, these genotypes could be used as a baseline and as a selection indicator for breeding programs. This study, however, is preliminary and requires additional assessment in Bangladesh's various chickpea-growing regions.
Acknowledgement
AcknowledgementThe Bangladesh Institute of Nuclear Agriculture's soil science section, Ishwardi, and BINA sub-station are acknowledged by the first author. Thank you also to all of the co-authors for their tremendous efforts in finishing the paper.
Figures and tables from the paper
| Sample Name | Protein % | % N | % P | % K | Zn (ppm) | Fe (ppm) | % Mg | % Na | % Ca | Ni (ppm) |
|---|---|---|---|---|---|---|---|---|---|---|
| CIEN-SSA 32-26 | 17.62c | 2.82b | 0.41de | 1.00a | 43.60b | 200.00a | 0.21b | 0.02cd | 1.01d | Trace |
| CIEN-SA 33 | 18.45bc | 2.95b | 0.47bcd | 1.04ab | 25.86g | 50.00e | 0.25a | 0.14b | 1.10cd | Trace |
| CAT-11-28 | 14.84d | 2.37e | 0.47bcd | 1.00ab | 63.88a | 150.00c | 0.20b | 0.02cd | 1.10cd | Trace |
| BARI Sola-7 | 19.72b | 3.16a | 0.35e | 0.84b | 37.52cd | 75.00d | 0.21b | 0.01d | 1.28abc | Trace |
| CIEN-MED 32 | 15.51d | 2.48d | 0.41de | 0.98ab | 28.9fg | 50.00e | 0.21b | 0.03c | 1.10cd | Trace |
| BINA sola-8 | 23.80a | 2.85b | 0.42cde | 1.06ab | 36.7de | 160.00c | 0.17c | 0.03c | 1.27abc | Trace |
| CIEN-SA 15 | 14.55d | 2.33e | 0.53ab | 1.08a | 31.43efg | 175.00b | 0.10e | 0.02cd | 1.35abc | Trace |
| CIEN-SSA 6-10 | 11.89e | 1.90g | 0.55a | 1.12a | 42.59bc | 50.00e | 0.12d | 0.02cd | 1.43a | Trace |
| CAT- 23-29 | 14.20d | 2.27ef | 0.55a | 1.04ab | 32.45def | 50.00e | 0.13d | 0.20a | 1.39ab | Trace |
| CIEN-SSA 15-41 | 14.20d | 2.68c | 0.41de | 1.04ab | 43.98b | 50.00e | 0.12d | 0.02cd | 1.18bcd | Trace |
| CAT- 29-38 | 11.89e | 1.90g | 0.49abc | 1.08a | 35.49de | 175.00b | 0.10e | 0.02cd | 1.30abc | Trace |
| Level of significance | ** | ** | ** | * | ** | ** | ** | ** | * | - |
| CV (%) | 6.48 | 6.23 | 9.81 | 13.19 | 8.64 | 7.43 | 5.04 | 13.54 | 12.00 | - |
Table text extracted from the original PDF; superscript letters are shown inline. The original table image is below.
View original table image
References
17 in the original paper- Akondo MRI, Uddin FJ, Islam MM, Adhikary S, Rana MS. Yield comparison of Bina developed four sesame varieties under the agro-ecological conditions of Gopalganj district of Bangladesh. Research in Agriculture, Livestock and Fisheries. 2022;9(3):247251.
- Bhagat S, Kumar S, Dogra S. Identification of induced mutants for morpho-physiological and biochemical traits of rajmash (Phaseolus vulgaris). The Indian Journal of Agricultural Sciences. 2023;93(7):63-68.
- Bhagyawant SS, Gupta N, Srivastava N. Biochemical analysis of chickpea accessions vis-a-vis zinc, iron, total protein, proline, and antioxidant activity. American Journal of Food Science and Technology. 2018;3(6):158-162.
- Bhingarde MT, Dumbre AD. Effect of seed size on growth and yield components in greengram (Vigna radiata L. Wilczek) under summer conditions. Seed Research. 1993;21(2):104-106.
- Borate DN, Dumbre AD, Bhingarde MT. Effect of seed size on growth, yield and seed quality of groundnut (Arachis hypogaea L.) under summer conditions. Seed Research. 1993;21(2):107-109.
- Bruinsma J. World agriculture: towards 2015/2030: an FAO study. Routledge; c2017.
- Devasirvatham V, Tan DK. Impact of high temperature and drought stresses on chickpea production. Agronomy. 2018;8(8):145.
- Elobied S. Effect of plant density on the performance of some sesame (Sesamum indicum L.) cultivars under rain-fed conditions. Research Journal of Agriculture and Biological Sciences. 2010;6(4):498-504.
- Gaur PM, Krishnamurthy L, Kashiwagi J. Improving drought-avoidance root traits in chickpea (Cicer arietinum L.) -current status of research at ICRISAT. Plant Production Science. 2008;11:3-11.
- Jayaraj T, Karivaratharaju TV. Influence of harvesting stage on seed vigour in groundnut cultivar. Seed Research. 1992;20(1):41-43.
- Kante S, Wadikar PB, Sargar PR, Patil SS. Correlation analysis for seed yield and its related attributes in genotypes of sesame (Sesamum indicum L.). International Journal of Plant and Environment. 2022;8(1):87-90.
- Khatun A, MAH B, MK H. Effect of seed collected from different parts of chickpea varieties on growth, yield and yield attributes of chickpea. Bulletin of the Institute of Tropical Agriculture, Kyushu University. 2009;32(1):9-16.
- Lal M, Dutta S, Saikia D, Bhau BS. Assessment of selection criteria in sesame by using correlation and path coefficient analysis under high moisture and acidic stress soil conditions. Indian Journal of Science and Technology. 2016;9(4):1-5.
- Li N, Peng W, Shi J, Wang X, Liu G, Wang H. The natural variation of seed weight is mainly controlled by maternal genotype in rapeseed (Brassica napus L.). PLoS One. 2015, 10(4).
- Özdemir S, Karadavut U. Comparison of the performance of autumn and spring sowing of chickpeas in a temperate region. Turkish Journal of Agriculture and Forestry. 2003;27(6):345-352.
- Singh RM, Verma RS. Effect of seeding rate and row spacing on the yield and quality of lentil (Lens culinaris) varieties. Indian Journal of Agronomy. 1999;44(3):584-587.
- Tahir A, Ilyas MK, Sardar MM, Pouya AK, Rasouli F, Bibi A, et al. Selection criteria for yield potential in a large collection of Vigna radiata (L.) accessions. Euphytica. 2020;216:1-12.